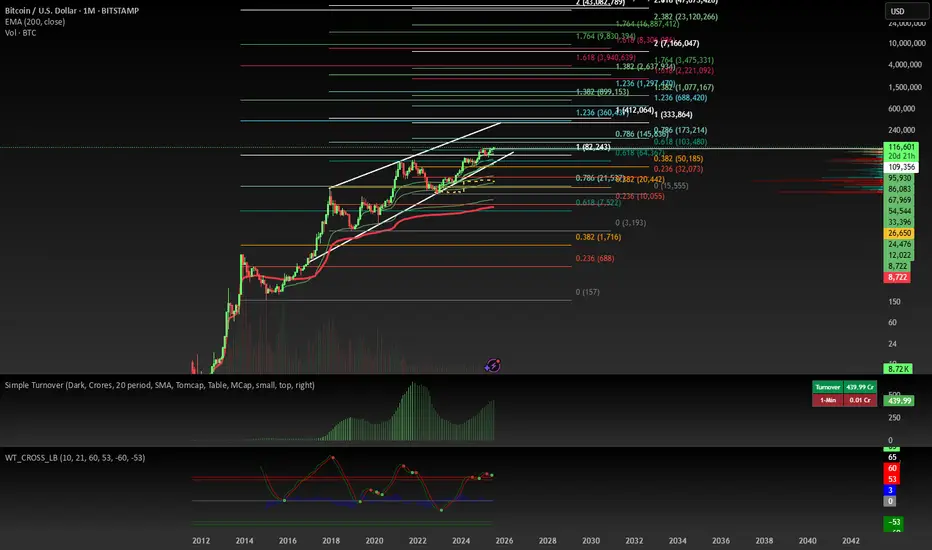
BTC monthly yelling at us for something interesting ?We read daily news about ETF, accumulation by institutes and scarcity in the exchanges, but I recognize something different in the chart based on multiple indicators. Historically, BTC boomed after touching 50 EMA and whenever it is extended it traces back to 50 EMA on monthly chart. As per current data, BTC is extended far from it. Also RSI and MACD indicating that it is losing momentum with -ve divergence. Volume as well descreasing since last leg, though price moved up. So, I expect price to retrace to 50 EMA which coincides with previous high at 60K. Let us see how it unfolds.
BITCOIN trade ideas

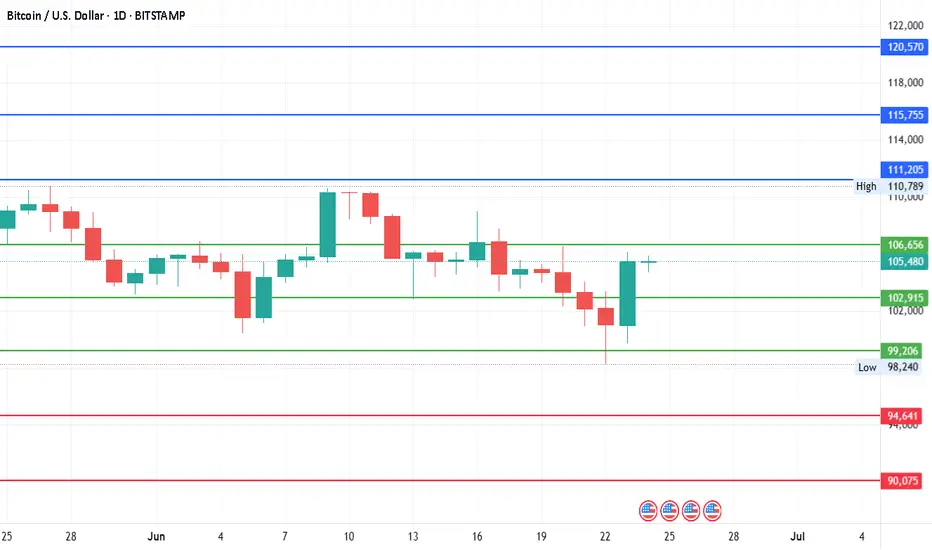
#Bitcoin - Pivot is $102915 | Target $125385 or $80445 ?Date: 24-06-2025
#Bitcoin
Current Price: 105375
Pivot Point: 102915.00 Support: 99206.48 Resistance: 106655.63
#Bitcoin Upside Targets:
Target 1: 111205.31
Target 2: 115755.00
Target 3: 120570.00
Target 4: 125385.00
#Bitcoin Downside Targets:
Target 1: 94640.74
Target 2: 90075
Target 3: 85260
Target 4: 80445.00
80k BTC On The Move - WHAT It Means 80,000 BTC Wallet Movement (2011 Miner)
• Source: 8 wallets containing 10,000 BTC each — mined in 2011, dormant for 14 years
• Total Value: Over $8.6 billion USD
• Timing: Moved on July 4, 2025 — largest dormant BTC transfer in history
• New Addresses: Funds moved to modern SegWit wallets
• Probable Owner: Likely a single early miner with 200k+ BTC history
Possible Reasons for the Move
• Key Rotation: Upgrading to modern wallets for better security
• Recovered Access: Private keys may have been recently recovered
• Market Strategy: Positioning for profit-taking or major sell-off
• Yield Farming: Preparing COINBASE:BTCUSD for use in DeFi/lending platforms
• Collateral Use: Possibly for loans, stablecoin leverage, or RWAs
• Estate Planning: Legal restructuring or generational wealth setup
• OTC Transfer: Could be prepping for off-exchange institutional sale
• Psychological Warfare: Could be intended to spook or manipulate the market
• Regulatory Response: Aligning with new compliance or tax jurisdiction
Market Reaction
• COINBASE:BTCUSD Price Dip: Price briefly fell below $108,000 post-move
• ETF Context: Movement occurred despite record ETF inflows
Key Note: These wallets had not been touched since COINBASE:BTCUSD was worth ~$0.78. Their reactivation adds uncertainty and opportunity in a fragile macro environment.
• What to do????: Watch the orderbook to find these large bitcoin moves in case of exchange selling
Near term support & resistance
$106000 support
$109500 first resistance
👍 If this breakdown helped your trading, smash that Like and drop a comment below—let me know what you think will happen with the 80k COINBASE:BTCUSD . 👍
Best Reguards
MartyBoots, 17-year market trader

BTCUSD BUY 105750On the 4-hour chart, BTCUSD is currently oscillating at a high level. Currently, we can pay attention to the support near 105750, which is a potential buying position for the bullish bat pattern. At the same time, this position is in the demand area.

BUYTrend Line Break
Previous Day low breached
Previous week bullish
Divergence
US session
@ Trade Manage Smile

BTC's Situation, A Comprehensive Analysis !!!Bitcoin is now at a point where it cannot be ignored! In my view, the bullish wave has started after the corrective wave ended. This wave could continue until it breaks the ascending triangle, then with a slight correction, push the price upward again. The current period and the coming days could be crucial in determining the market's trend.
Best regards CobraVanguard.💚

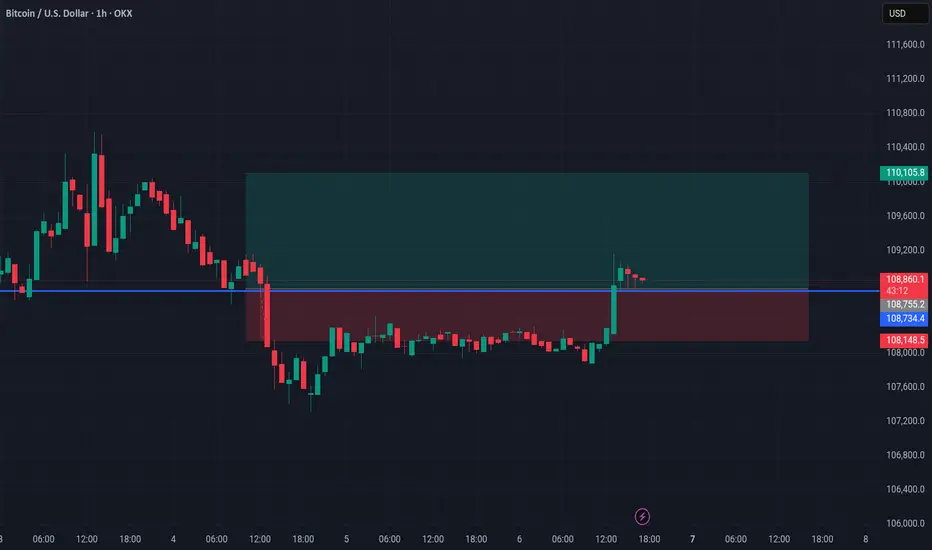
Bitcoin can rebound from resistance level and start to declineHello traders, I want share with you my opinion about Bitcoin. Recently, the price broke above a local resistance and quickly approached the key resistance level at 110000, which also aligns with the upper boundary of the seller zone (110000 - 110700 points). This area has already proven its strength multiple times, causing sharp rejections in the past. Moreover, the price has tested it again recently and failed to break through. In addition, we can see a triangle structure, which fits the logic of a pennant pattern after a bullish wave. However, the latest move upward has already lost momentum near the apex, and the price is now trading just under the upper edge of this formation. That makes this zone technically overloaded and vulnerable to a downside reversal. Based on this, I expect Bitcoin to test the resistance level one more time and then roll back down toward TP 1 at 106000 points, a zone near previous liquidity accumulation and a local consolidation range. If selling pressure increases, the price might aim for the buyer zone (103800 - 103100). Given the current rejection at resistance, the structure of the triangle, and the reaction inside the seller zone, I remain bearish and expect further decline toward the support. Please share this idea with your friends and click Boost 🚀
Disclaimer: As part of ThinkMarkets’ Influencer Program, I am sponsored to share and publish their charts in my analysis.

BTC/USD Bullish Reversal Breakout Pattern BTC/USD Bullish Reversal Breakout Pattern 🚀
Technical Analysis:
🔹 Trend Reversal: The chart shows a clear inverse head and shoulders pattern highlighted with orange circles — a strong bullish reversal signal after a downtrend.
🔹 Breakout Zone: The neckline resistance around 108,000 USD has turned into support (marked as “SU00QT” due to a typo, assumed to be “SUPPORT”). Price action is consolidating just above this zone.
🔹 Trendline Support: The upward blue trendline confirms bullish structure, with price forming higher lows. Recent price action is bouncing off this trendline, showing strength.
🔹 Bullish Confirmation: Green arrows indicate strong bullish rejections from key levels, aligning with breakout retests.
🔹 Target Projection: The measured move from the inverse head and shoulders pattern projects a target towards the 114,000 USD resistance zone 📦 highlighted above, suggesting a potential 5-6% upside move 📊.
Conclusion: As long as price holds above the 108,000 support zone and the ascending trendline, BTC/USD remains bullish with potential continuation towards 114,000 USD. A breakout above minor consolidation could trigger a strong bullish rally 💥.
🛑 Invalidation: A sustained break below 106,000 USD would invalidate the bullish structure and may lead to further downside.

BTC POTENTIAL BULLS TRAP IN DEVELOPMENTI am inspecting the 4 hour candle in comparison to the daily chart on BTC and it seem we have all the characteristics of a bulls trap on the chart. If the next 4 hours candle does not close bullish, it will confirm a bulls trap and price will likely pullback into the triangle. So be cautious trading at this resistance level.
Bull Trap Chart Characteristics
Look for:
A strong bullish candle that breaks above recent highs or resistance.
Volume spike on the breakout — signs that traders are buying.
Followed by a sharp bearish candle (like a shooting star, bearish engulfing, or long wick).
Price falls back below resistance, turning the breakout into a fakeout.
Cheers !!

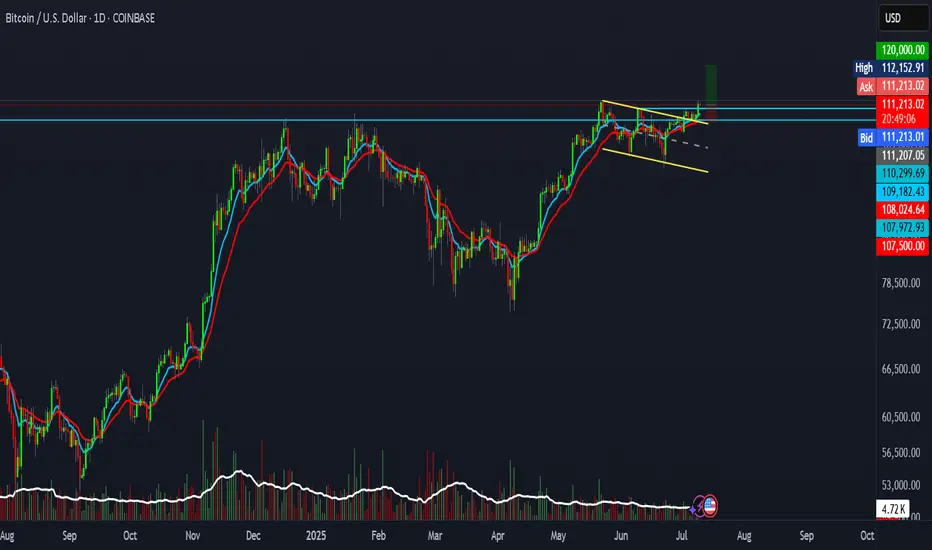
BTC setup with 2R R:R.BTC is showing signs of a real breakout.
This setup offers a 2:1 risk-reward ratio.
Entry: 111,207
Stop Loss: 107,500
Target: 120,000
Not financial advice.
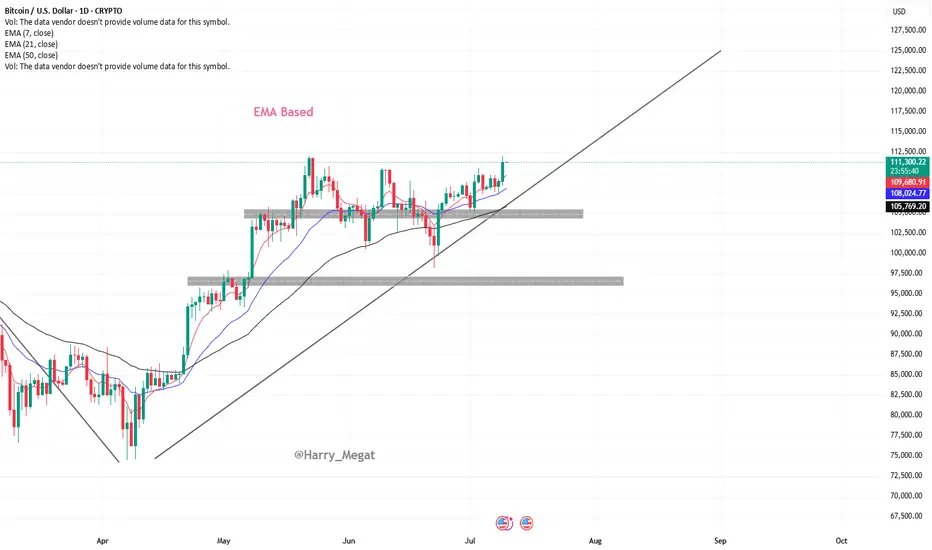
BTCUSD Chart Analysis (Daily Timeframe)Chart Analysis – BTC/USD (Daily Timeframe)
Trend Overview:
* The chart shows **Bitcoin (BTC/USD)** on the **daily timeframe**.
* Price is in a **clear uptrend**, making **higher highs and higher lows**.
* The recent breakout above **\$111,000** suggests a **bullish continuation**.
Moving Average Analysis (EMA 7, 21, 50):
* **EMA 7 > EMA 21 > EMA 50** — this alignment confirms **strong bullish momentum**.
* Price is **well above all EMAs**, especially the 50 EMA (\~\$105,546), showing trend strength and possible institutional support.
* EMAs are **sloping upward**, which further confirms the upward momentum.
Recent Breakout:
* BTC broke out of a **short-term consolidation zone** between \~\$108,000–\$111,000.
* Today’s candle shows a **strong bullish close**, indicating fresh buying interest.
* If this breakout holds, price could extend toward the **next psychological level of \$115,000–\$117,500**.
Support Zones to Watch:
* **Minor support:** \~\$109,000 (EMA 7 + breakout retest area)
* **Stronger support:** \~\$105,500 (EMA 50 and previous swing low)
A break below **\$105,500** could signal a trend shift or deeper pullback.
Summary:
Bitcoin is showing **strong bullish structure** on the daily chart with EMAs aligned upward and a recent breakout above \$111,000. If momentum holds, next upside targets are around **\$115,000–\$117,500**. The bullish trend remains intact unless price breaks and closes below **\$105,500**.
$BTC Will Hit Unimaginable Numbers :) Honestly not much to say the chart looks fantastic a lot of potential to the downside but from a Macro standpoint we could reach 150k in the coming months. Bitcoin will see extreme gains in the next 5 years. If you are not bullish I have news for you. you lost......
Short term I think we reach as far as 120k before a pull back. Only time will tell but these fib extensions do not lie. When you blow through the 1 fib ALWAYS AND I MEAN ALWAYS LOOK HIGHER. Obviously this is the monthly chart and will take year to play out. I do not expect much attention as I am a small trader but I will post occasional updates. In the mean time I will be buying large dips.
BTCUSD going long after breaking resistance Price heading towards previous high after strong move up from the 200 ema.
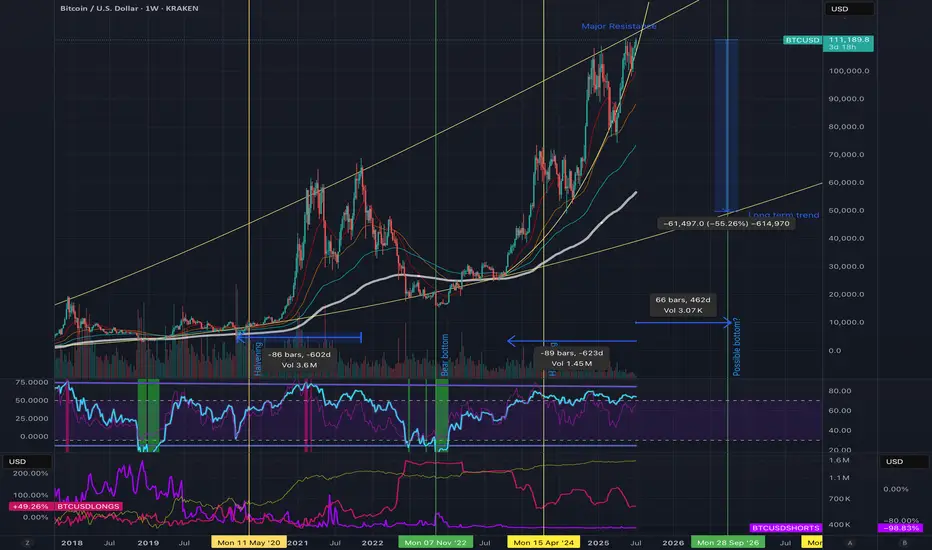
End in sight, Bull run near complete, don't be fooled. Bitcoin has experienced an incredible surge, rising from $15,000 to over $111,000 in this bull cycle so far. I expect the market peak to be around $114,000 to $115,000, with historical trends indicating strong resistance at these levels. As a long-term Bitcoin bull who has navigated through multiple cycles, I see several indicators suggesting we might be nearing a market top.
Firstly, this bull run has lasted 623 days, with only 462 days remaining until the predicted next cycle bottom. This could lead to a significant correction in the short term, potentially dropping prices by at least 50% down to below $40,000. Additionally, trading volume is declining; although exchange volume is decreasing, the number of trades per day is also dwindling. This means there’s less buying and selling pressure in the market. If this trend shifts to more selling pressure amidst such low volume, we could see a rapid decline. This scenario seems to align with what market whales may be anticipating.
MicroStrategy (MSTR) is certainly supporting the market, along with new institutional investors. However, we have yet to fully assess the impact of tariffs and other economic factors, which could result in fewer people willing to invest, especially in high-risk markets.
The Net Unrealized Profit/Loss (NUPL) has been high, remaining above 66 since March 2024, which also suggests that a correction is due, as many holders are currently in profit. Although institutional investment has been steadily increasing, we are now observing a plateau in the Accumulation/Ddistribution chart. The number of BTC long positions is decreasing, while shorts remain very low, indicating a lack of confidence that Bitcoin will rise significantly higher. This low interest in both longs and shorts suggests that market pressure could shift soon.
ETF inflows have remained stable, but profit-taking is likely to occur as investors seek to increase their positions in the bear market. While we all love Bitcoin and want the rally to continue, it's crucial to remember that a bear market will eventually happen, along with the next halving—it's just a matter of timing.
Looking at the charts, if anything signifies a market top more than “Laser Eyes,” it could very well be Trump coin. We might see another upward push, but history has shown that if everyone expects a massive rally in September or the fourth quarter, the opposite usually occurs; we end up buying the rumor and selling the news.
Safe trading, everyone! I remain a staunch Bitcoin bull, but I recognize that all good things must eventually come to an end and the next cycle will be so exciting, so make sure youe have the reserves to invest in the bear!
BTC / ETH / SOL / XRP / HYPE: Potential Trend StructuresIn this video, I share my current daily and weekly analysis on the trend structures of BTC, ETH, SOL, XRP, and HYPE, highlighting key support and resistance zones to watch in the coming sessions.
Charts featured in the video:
BTC
ETH
SOL
XRP
HYPE
Thank you for your attention and I wish you successful trading decisions!
If you’d like to hear my take on any other coin you’re tracking feel free to ask in the comments (just don’t forget to boost the idea first 😉).

Bitcoin Is Looking For A Bullish ContinuationMorning all! Bitcoin has impulsive characteristics on 4h time frame, and we can clearly see five waves up that can send the price even higher after recent projected ABC correction. With the current impulsive recovery back above 106k area, it confirms that bulls are still here and we should be aware of further rally in July, especially if breaks above channel resistance line near 110k area. Seems like it's in wave (1) of a new five-wave bullish impulse, so after current wave (2) pullback, we can expect more gains within wave (3).

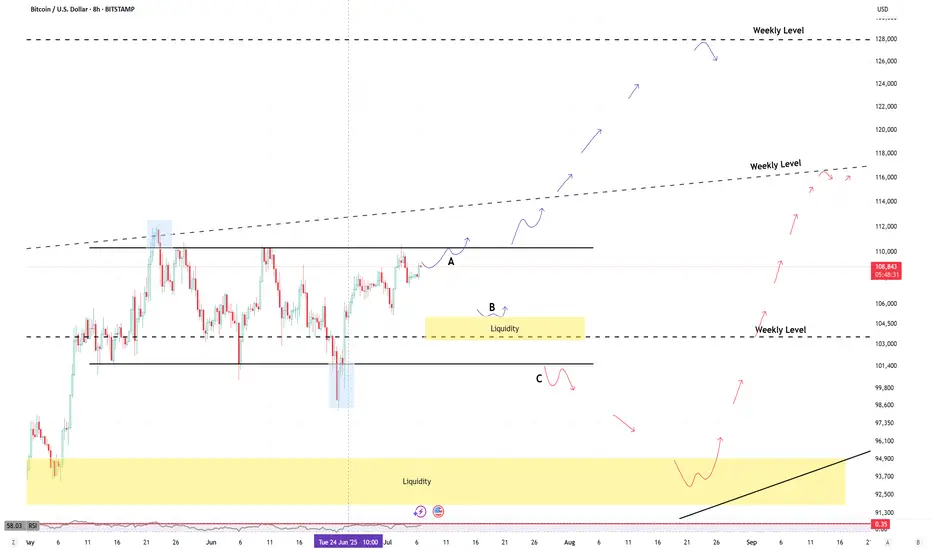
BTC Summer Roadmap: Key Levels & Breakout ScenariosBTC has retested the weekly resistance trendline (around $114K) that has been in place since February 2021. Over the past 4 years, this trendline has been tested four times, and a fifth retest appears imminent in the short term.
Historically, a fifth retest often leads to a breakout. If that breakout occurs, the next major target for BTC is around $128,000.
That said, the market rarely moves in a straight line.
As outlined in the chart, I’ve considered three potential scenarios for BTC to unfold this summer.
New trades will be based on these movements, with optimal entries either at the yellow-highlighted zones or upon a confirmed breakout above the current weekly resistance.
Disclaimer:
This analysis is based on my personnal views and is not a financial advice. Risk is under your control.
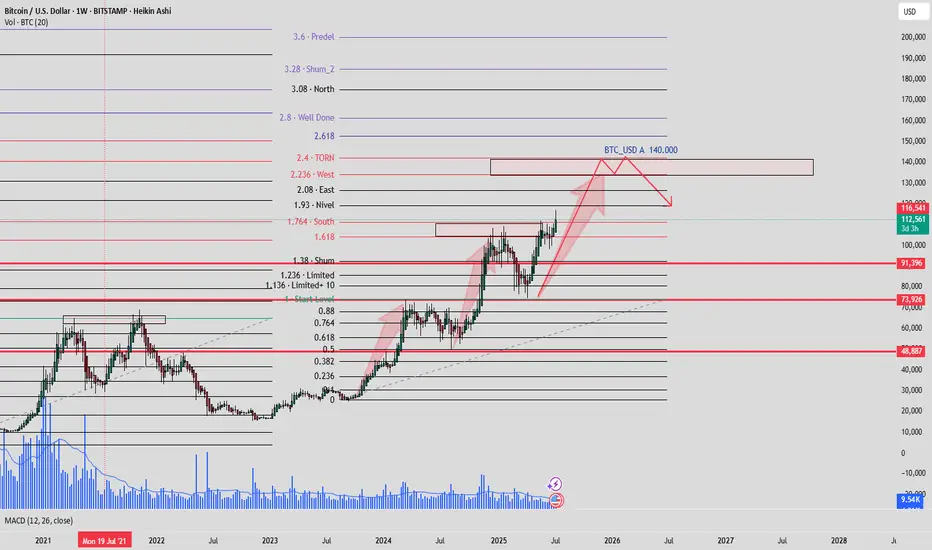
#BTC ALMAZOV PROJECTION#BTCUSD ALMAZOV PROJECTION WEEKLY
Price projection according to Almazov's theory, Bitcoin should at least touch $140,000, before pulling back or continuing to go long if its dimensionality decreases.
Congratulations to those of us that took this trade we just hit Congratulations to those of us that took this trade we just hit take profit now

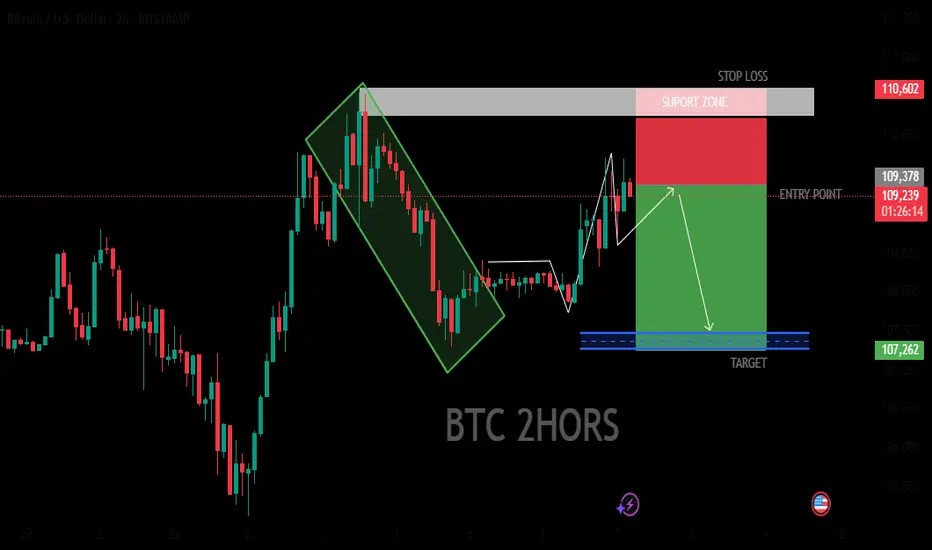
BTC 2HORS BEARISH ANALYSIS
The image suggests that the trader is using technical analysis to identify potential trading opportunities in the Bitcoin market. The use of specific patterns and indicators, such as the descending triangle and target price level, indicates a systematic approach to trading. However, it's important to note that trading carries inherent risks, and past performance is not necessarily indicative of future results.
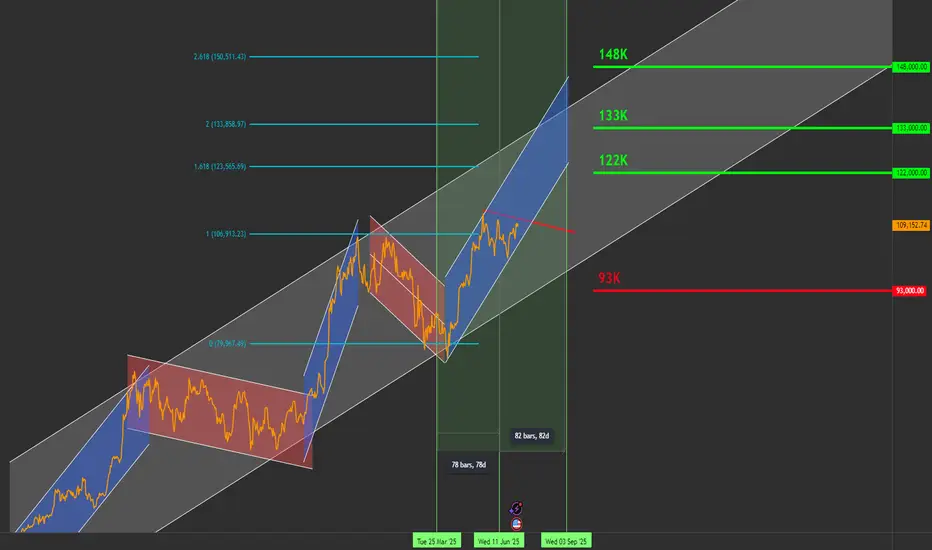
Bitcoin Roadmap to $144K by September – Daily Chart Breakout SetHello traders,
I'm sharing my current outlook on Bitcoin using the daily timeframe. Price is ~109K below a key descending trendline (in red), which has defined the structure since 21 May.
🔍 Key Levels to Watch:
Resistance: $111,000
Support: $91,000
Current Price: ~$109,000
⚡ Breakout Scenario:
If Bitcoin closes above $111K on the daily chart, backed by strong volume (ideally 30% above the 20-day average), I expect the next targets to unfold as:
✅ $122,000
✅ $133,000
✅ $144,000
🗓️ Target date for $144K: Around 22 September 2025
This projection is based on a pivot structure I’m tracking:
🟢 25 March 2025: Pivot low at ~$84K
🔴 12 June 2025: Pivot high
🟡 Expected pivot high: ~4 September 2025 (if symmetry holds)
This pattern suggests a 1-2-3 formation that could lead to a breakout move.
🧯 Failure Scenario:
If BTC fails to break out, I’m watching for a pullback toward the $91K support zone.
🛑 Current Stance:
I’m not in a position yet. Waiting for a daily candle close above $111K with volume confirmation and momentum indicators.
📣 Stay Updated
I’ll be sharing daily updates as the price action evolves.
Follow me here on TradingView, and feel free to share your analysis or ask questions in the comments!
🏷️ Hashtags:
#BTCUSD #BitcoinAnalysis #CryptoTrading #BTC #TechnicalAnalysis #SwingTrade #BreakoutSetup
Let me know your comments.
Bitcoin(BTC/USD) Daily Chart Analysis For Week of July 4, 2025Technical Analysis and Outlook:
During this week's trading session, Bitcoin rebounded from our Mean Support level of 104900 and, with significant momentum, subsequently completing the Mean Resistance level of 110300. Currently, the cryptocurrency is poised for a continuation of its downward trajectory, with a target set at the Mean Support level of 105500. This downward trend may necessitate heightened resilience to address the Key Resistance point at 111700 and the emerging historical price action of the Outer Coin Rally at 114500 and beyond. Nonetheless, it remains essential to acknowledge the possibility that current prices may experience an uptick from this juncture, bolstering the rally mentioned above.

Trading Recommendations for BTC/USDBitcoin and Ethereum are demonstrating stable growth amid new forecasts regarding the number of interest rate cuts expected from the Federal Reserve this year. Another dovish stance from the Fed Chair and criticism from Trump over Powell's inaction triggered buying on the U.S. market, which also impacted the cryptocurrency market.
Investor enthusiasm is fueled by expectations of more accessible financial resources, which typically drive capital into riskier assets like cryptocurrencies. Bitcoin, as the flagship of the crypto market, traditionally reacts first to changes in macroeconomic conditions. However, one should not forget the inherent volatility of the crypto market. Even positive macro signals do not guarantee sustainable growth-especially as Bitcoin has been hovering near its historical highs, where buyer interest has been waning recently. It's essential to c consider technical factors, market sentiment, and regulatory risks, all of which can significantly influence price dynamics.
Meanwhile, alongside Strategy, Japanese investment company Metaplanet purchases Bitcoin for its balance sheet. Data shows the company acquired an additional 1,234 BTC for approximately $132.7 million just one day after announcing a $515 million capital raise to fund its Bitcoin treasury strategy. The Tokyo-listed firm stated that this latest purchase at around $107,557 per Bitcoin raised its total holdings to 12,345 BTC. The company holds about $1.3 billion worth of Bitcoin based on current market prices. This makes Metaplanet the seventh-largest publicly listed corporate holder of Bitcoin, surpassing Tesla, which holds 11,509 BTC.
As for intraday strategy in the cryptocurrency market, I will continue to act based on any major pullbacks in Bitcoin and Ethereum, expecting the medium-term bullish market to persist
For short-term trading, the strategy and conditions are described below.
Buy Scenario
Scenario #1: I will buy Bitcoin today if it reaches the entry point around $106,227 aiming for a rise to $ 107,042. Near $107,042 I plan to exit the long position and sell on pullback. Before buying on a pullback, ensure the 50-day moving average is below the current price and the Awesome Oscillator is above zero.
Scenario #2: If the market does not react to a breakout, Bitcoin ca also be bought from the lower boundary at $105,039 with targets at $106,221 and $106,748.
Sell Scenario
Scenario #1: I will sell Bitcoin today if it reaches the entry point around $107,695 aiming for a drop to $106,008. Near $106,008, I plan to exit the short position and buy on a bunce. Before selling on a breakout, ensure the 50-day moving average is above the current price and the Awesome Oscillator is below zero.
Scenario #2: Bitcoin can also be sold from the upper boundary at $106,753 if there is no market reaction to a breakout, targtion the $104,651 and $103,888 levels.
