Clear View zooming out This Pattern may be playing out and retesting but its not confirmed until we have an RSI break out -
For clarification, i dont believe we would hit the upside target given the timing but it is very possible this may be a longer term play-
Pull backs are normal but the trend way upwards would be clear.
BITCOIN trade ideas

Bitcoin (BTC/USD) Technical Forecast🧭 Market Snapshot:
Bitcoin is showing signs of short-term weakness with price hovering around $102,800. The daily candle is forming an inside bar, suggesting indecision — typically a setup for a larger move ahead.
🔮 Forecast:
📅 1-Day Outlook:
BTC is expected to remain in a narrow consolidation range between $102,200 and $104,000. A breakout from this inside candle could push price toward $105K, but risk remains skewed slightly lower if support fails.
📅 1-Week Outlook:
With daily and 4H RSI trending under 45 and price below key EMAs, downside risk builds. If $100K fails, BTC may test the $98.5K zone, potentially down to EMA 144 near $96.5K.
📅 1-Month Outlook:
If BTC can base between $96.5K–$106K and reclaim the $105K resistance cluster, momentum may shift bullish. Until then, price action is likely to remain choppy and rangebound.
⚠️ Key Technicals:
Support Zones: $102,600 (EMA 55), $99,950 (EMA 89), $96,648 (EMA 144)
Resistance Zones: $105,000–106,000 (EMA 21/34 cluster)
Momentum: RSI < 50 across all timeframes → no bullish momentum yet
Volatility: Moderate, with ATR (14) = 2795
📌 Conclusion:
The bulls need a clear reclaim above $105K to regain control. Until then, expect range trading and possible tests toward $98K–$96K. Stay nimble, watch RSI and EMA reactions closely.

CHECK BTCUSD SIGNAL READ CAPTAINbtcusd sell now ✅
entry point (106800.00) (106600.00)
TAKE PROFIT 1: (105800.00)
TAKE PROFIT 2: (104800.00)
LAST TARGET(103700.00)
STOP LOSS (107650.00)

#Btc Faces Crucial Decision Near Resistance — Bearish DivergeBitcoin is showing repeated rejections from the $110K and $108K zones. Currently, it's moving upward from the $98K area toward resistance, but price action remains compressed between the major trendline support and resistance.
This range-bound structure suggests that a pullback may be imminent, especially as RSI is forming consistent bearish divergence and the MACD is signaling weakness. A liquidity sweep to the downside could occur before a decisive move.
However, if BTC manages to break above the converging trendlines with strong volume, we may see a move toward $110K again for a retest. Watch $106K as an intermediate support. If that fails, further downside may follow.

BTCUSD H4-Keep entering and exiting Follow a Plan #BTCUSD #SMCTRADE BUY BTCUSD TIME FRAME H4 : BTCUSD H4-Keep entering and exiting Follow a Plan #BTCUSD #SMC

BTC USDT PLAN I favor a short-term pullback unless BTC can reclaim and close above the $111K–112K zone with strong volume.
If price breaks below $106K and confirms it as resistance, it could accelerate a move toward $100K and below.
Caution is warranted for bulls — this looks more like a distribution phase near the highs than a breakout.

ABC Flag / Support LevelAn ABC flag looks to be playing out. If so, BTC's price should not dip below 100 again, but if it does, there is nothing but air until the 95-96 order block.

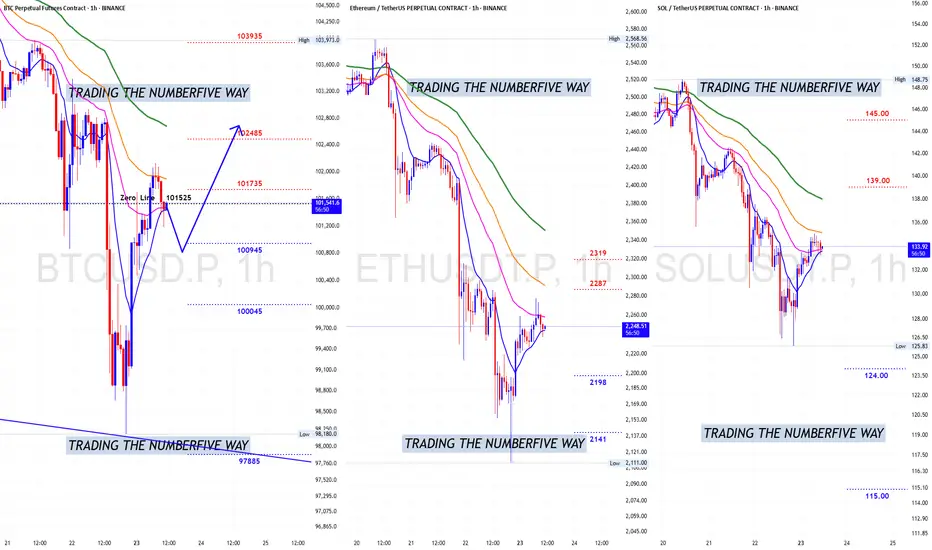
Bitcoin / U.S. Dollar 2-Hour Chart (BTCUSD)2-hour chart displays the recent price movement of Bitcoin (BTC) against the U.S. Dollar (USD), showing a current price of $102,459.21 with a decline of $853.19 (-0.83%) over the period. The chart highlights a significant drop from a peak near $105,898.45, with a shaded area indicating a potential support zone between $101,682.19 and $99,732.49, and a resistance level around $103,000. The timeframe spans from 9:00 to 29:00, with technical indicators and price levels marked for analysis.

BTC is expected to retreat in the short term, focus on 104500📰 Impact of news:
1. The ceasefire agreement reached earlier did not take effect, and Trump believed that both sides violated the agreement
2. Federal Reserve Chairman Powell delivered a speech 3 hours later
📈 Market analysis:
I haven't updated BTC for a while. Today I want to share my views on BTC with you. BTC is currently encountering resistance and pressure at the 106,000 level and is beginning to retreat. From the technical indicators, MACD is in a dead cross, and RSI is retreating after reaching the overbought area. There is no problem with the short-term bearish trend, and it is expected that it will be able to retreat to the 104,500 level without much problem. However, the recent decline in the gold market, DXY market, and crude oil market may cause funds to flow into the BTC market.
🏅 Trading strategies:
SELL 106000-105500
TP 105000-104500
BUY 140500-103500
TP 105000-106000
If you agree with this view, or have a better idea, please leave a message in the comment area. I look forward to hearing different voices.

$BTC Weekend Update - The Revenge of the BearsHello Fellow Gamblers,
Bears are in total control of BTC and are dragging the price lower and lower. Our 1st target has been hit so my eyes are now turning towards our 2nd target right above 93k. In the Video I talk about a possible Target 3 that could happen if we break below 93k.
- I am currently watching for a possible move up towards 103k to fill any FVG previously opened, I might be early but it is never early enough to be mentally prepared for it.
- I expect an accumulation to happen above 93k. That would lead us to a reversal and continuation of the bullish trend.
- Levels to watch: 93.1k, 97.5k,101k, 103.4k, 106.6k.

Altseason AnalysisTo determine whether we're approaching a true Altseason, we're analyzing the macro relationship between Bitcoin Dominance (BTC.D) and Total 2 (the total crypto market cap excluding Bitcoin). This comparison has consistently revealed where capital is flowing and helps signal shifts in market cycles.
Current Market Structure
BTC Dominance: Currently at 64% and testing resistance zone.
A breakdown below 57% could trigger fresh capital rotation into alts.
Total 2: Hovering near 1.2T ; watching for breakout confirmation.
What Triggers an Altseason?
BTC stability or slow upward grind: Altcoins thrive when Bitcoin is stable not crashing, not parabolic.
BTC.D Breakdown: Often the first real signal. Look for confluence with Total 2 breakout.
Capital Rotation: Watch Ethereum and majors big cap — they usually lead before microcaps follow.
BTC.D Breakdown: Often the first real signal. Look for confluence with Total 2 breakout.
$5 Trillion??
Breakout above $1.7T ATH in Total 2 opens the door for exponential price discovery.
Key resistance zones: $2T → $3.5T → $5T
Watch for volume surge + BTC.D breakdown for strong confirmation.
Caution:
Not every BTC.D dip leads to an Altseason fakeouts happen. Confirm with Total 2 strength and sector rotation.

BTCUSD: Deja Vue from last halvingsWithin this Cycle we have a mixed price behaviour from the last 2 halvings , so if this continues ws should see a huge surge within the next few days/weeks. I expect Maximum Aug/Sept/Oct with 280-320 K . Mut we might get back to 80K next year. Be prepared

Bitcoin – Ritual Latency & Tactical Tension.⊢
⟁ BTC/USD – Binance – (CHART: 1H) – (June 21, 2025).
⟐ Analysis Price: $103,909.52.
⊢
⨀ I. Temporal Axis – Strategic Interval – (H1):
▦ EMA9 – ($103,783.82):
∴ The price oscillates around EMA9 with marginal bullish slope;
∴ Two candle rejections confirmed the EMA9 as a reactive short-term axis;
∴ Current close is above, but lacking directional follow-through.
✴️ Conclusion: Momentum attempt, yet unsupported – fragility persists.
⊢
▦ EMA21 – ($103,869.74):
∴ Flattened trajectory overlapping EMA9;
∴ Indicates tactical compression – a latency band rather than trendline;
∴ No breakout confirmation.
✴️ Conclusion: Equilibrium zone – direction undecided.
⊢
▦ EMA50 – ($104,212.18):
∴ Serves as immediate dynamic resistance;
∴ Price has not closed above since June 20, 13:00 UTC;
∴ Requires sustained move to invalidate micro-downtrend.
✴️ Conclusion: Key reversal barrier – price remains below structural trigger.
⊢
▦ SMA100 – ($104,552.65):
∴ Downsloping, acting as mid-term ceiling;
∴ No candle engagement in recent sessions;
∴ Confluence zone with EMA50 adds density.
✴️ Conclusion: Inertial resistance zone – trend continuity until breach.
⊢
▦ SMA200 – ($105,197.18):
∴ Highest structural ceiling on H1;
∴ Remains untouched, reinforcing broader tactical bearish bias.
✴️ Conclusion: SMA200 maintains bearish structure – trend remains capped.
⊢
▦ Bollinger Bands - (20,2):
∴ Bands tightened – low volatility configuration;
∴ Upper band slightly expands – minor opening signal;
∴ Price contacts upper range without strength.
✴️ Conclusion: Potential breakout pattern – requires volume ignition.
⊢
▦ RSI (14, smoothed by EMA9) – (11.00 | Avg: 13.85):
∴ RSI at historical low – indicative of exhaustion rather than momentum;
∴ EMA of RSI confirms suppressed structure;
∴ Hidden divergence plausible but not confirmed.
✴️ Conclusion: Latent reversal conditions – needs confirmation from RSI reclaim.
⊢
▦ MACD (12,26,9) – (MACD: 88.35 | Signal: -159.25 | Histogram: -247.60):
∴ Histogram remains negative but is narrowing;
∴ MACD line curling upward, approaching signal;
∴ No crossover yet – early recovery signal under surveillance.
✴️ Conclusion: Bullish divergence forming – reversal not validated.
⊢
▦ ATR (14, RMA) – (372.44):
∴ Volatility decreasing after a local spike;
∴ Range-bound structure indicates compression, not impulse.
✴️ Conclusion: Tactical latency – volatility may reawaken post-volume.
⊢
▦ Volume (21):
∴ Faint increase in last bullish candle – still below strategic threshold;
∴ Lacks institutional confirmation.
✴️ Conclusion: Spot activity insufficient – neutral, vulnerable structure.
⊢
🜎 Strategic Insight – Technical Oracle:
∴ H1 presents structural compression between EMA9/21/50, confirming tactical latency;
∴ RSI at deep oversold – signal of exhaustion, not yet momentum;
∴ Bollinger and MACD show early signs of kinetic preparation;
∴ The market is postured, not reactive – awaiting a directional event.
✴️ Tactical View: Structurally Neutral – Momentum Suspended, entry only upon RSI/Volume confirmation and MACD validation.
⊢
∫ II. On-Chain Intelligence – (Source: CryptoQuant):
∴ Update as of June 21, 2025 – Synchronized to H1 Structural Reading.
▦ Exchange Netflow Total – (All Exchanges) – (+692 BTC):
∴ Positive net inflow detected over 24h;
∴ Suggests moderate sell-side liquidity entering exchanges;
∴ Reflects defensive posturing, not panic-driven behavior.
✴️ Conclusion: Mild bearish pressure – not sufficient to invalidate structural base.
⊢
▦ Spot Taker CVD - (Cumulative Volume Delta, 90-day):
∴ Dominance of Taker Sell Volume confirmed – aggressive sellers remain in control;
∴ Pattern consistent over the last 6 sessions;
∴ No divergence between volume behavior and price structure.
✴️ Conclusion: Market remains tactically sell-biased – momentum driven by taker aggression.
⊢
▦ Spent Output Profit Ratio (SOPR) – (1.009):
∴ Marginally above 1.00 – coins being spent in mild profit;
∴ Absence of capitulation, but also no sign of deep conviction among holders;
∴ Stable rotation, not breakout-driven.
✴️ Conclusion: Structural neutrality – market is churning without direction.
⊢
▦ Adjusted SOPR (aSOPR) – (≈1.00):
∴ Flat – confirms lack of distribution or panic;
∴ Historically aligns with consolidation regimes.
✴️ Conclusion: Supply behavior is balanced – trend-neutral reading.
⊢
▦ Open Interest – All Exchanges – ($34.01B):
∴ Remains elevated – indicative of speculative leverage;
∴ Elevated risk of liquidation cascade on directional volatility;
∴ OI rising faster than spot volume = synthetic exposure dominating.
✴️ Conclusion: Market structurally exposed – fragile to external triggers.
⊢
▦ Funding Rate – All Exchanges – (-0.003):
∴ Slightly negative – shorts funding longs;
∴ Suggests bearish bias among leveraged participants;
∴ Conditions ripe for short squeeze if spot demand increases.
✴️ Conclusion: Contrarian setup building – tactical upside risk exists.
⊢
🜎 Strategic Insight – On-Chain Oracle:
∴ Metrics reflect a market under cautious speculative tension;
∴ No broad liquidation, no long-term holder exit – base intact;
∴ Taker dominance and leverage build-up suggest reactive positioning;
∴ System is neutral-leaning fragile – vulnerable to both triggers and traps.
✴️ Tactical Note: "Structurally Stable – Tactically Unsettled"
⊢
⧉ III. Contextvs Macro–Geopoliticvs – Interflux Economicus:
∴ Macro Landscape Reference – June 21, 2025.
▦ United States – Federal Policy & Risk Layer:
∴ Treasury Yield Curve remains slightly positive (+0.44%), removing short-term recession signal;
∴ 10Y yield elevated at 4.42% – reflects sustained inflation resistance and risk demand;
∴ Fed maintains QT stance – no rate cuts expected before September;
∴ Tension with Iran intensifying – military rhetoric entering fiscal discourse.
✴️ Conclusion: U.S. macro acts as compression catalyst – neutral on surface, volatile underneath.
⊢
▦ Strategic Bitcoin Reserve – (Executive Order – Trump):
∴ Recent Executive Order establishes BTC as sovereign asset class;
∴ Adds policy-level legitimacy to institutional accumulation;
∴ Reflects shift from “hedge” to “strategic reserve logic”.
✴️ Conclusion: Structural bull signal – narrative transition confirmed.
⊢
▦ China – Internal Stimulus & Soft Deflation:
∴ PPI negative at -3.3%, Retail Sales up 6.4% – stimulus-driven divergence;
∴ Fiscal revenue declining YTD – systemic drag despite easing;
∴ Not a current volatility driver.
✴️ Conclusion: China is neutral to crypto – reactive, not directive.
⊢
▦ European Union – Disinflation & Monetary Drift:
∴ HICP falls to 1.9%, ECB cuts deposit rate to 2.00%;
∴ PMI Composite < 50 – economic contraction quietly progressing;
∴ Forward guidance hesitant.
✴️ Conclusion: EU remains marginal – supportive for risk, but not catalytic.
⊢
▦ Global Fragmentation & SWIFT Erosion:
∴ Geopolitical blocs continue diverging – dollar-reliant systems weakening;
∴ Bitcoin seen increasingly as transactional hedge in sanctioned environments;
∴ De-dollarization dynamic accelerating.
✴️ Conclusion: Bitcoin positioned as neutral monetary rail – volatility shield and escape valve.
⊢
🜎 Strategic Insight – Interflux Macro Oracle:
∴ U.S. remains the dominant macro variable – its monetary and geopolitical stance defines volatility posture;
∴ Bitcoin structurally benefits from institutional legitimacy, but tactically suspended by risk-off layers;
∴ The system is internally calm, externally tense – volatility is downstream of Powell and geopolitical shock.
⊢
⌘ Codicillus Silentii – Strategic Note:
∴ Temporal structure remains compressed, yet technically reactive;
∴ On-chain behavior supports latent structural integrity, but reveals synthetic tension;
∴ Macro axis introduces dual asymmetry – stability in policy, instability in conflict;
∴ The system is in latency – not due to certainty, but due to mutual hesitation.
⊢
𓂀 Stoic-Structural Interpretation:
▦ Structurally Bullish.
∴ The underlying structure - long-term moving averages, exchange reserves, macro narrative, and holder behavior - remains intact and upward-biased;
∴ There is no technical breakdown or structural disassembly;
∴ It is the silent foundation - the “floor” of the chart remains elevated.
⊢
▦ Tactically Suspended.
∴ Although the structure points to strength, the present moment neither demands nor validates action;
∴ There is no volume, no ignition signal, no confirmation flow;
∴ Thus, the tactic is suspended - the trader (or observer) is in a disciplined state of observation, not execution.
⊢
⧉
⚜️ Magister Arcanvm (𝟙⟠) – Vox Primordialis!
𓂀 Wisdom begins in silence. Precision unfolds in strategy.
⧉
⊢

$BTC Bullish Momentum Building Bitcoin has successfully broken CRYPTOCAP:BTC Bullish Momentum Building
Bitcoin has successfully broken above both the $100K support and the 50 EMA at $103K, showing strong signs of bullish continuation. A retest of $103K may occur, but structure now favors the upside.
🔸 Support Now at 103,000 – 100,000 (Acting as Support):
The breakout above $103K flips this zone bullish. If a retest holds, it confirms strength and could launch the next leg up.
🔸 Upside Target: 110,324 and Higher
Now that BTC is trading above $103K, a move toward $110K+ is likely. If momentum continues, a breakout beyond the previous high could follow.
🔸 Risk Level at 103K:
As long as BTC holds above this level on retest, bulls remain in control. A break back below would weaken the setup.
🔸 Outlook:
🔹 Watch for a successful retest of $103K – that’s your long trigger.
🔹 Target zone: $108K → $110K+
🔹 Invalidation: Close back below $103K
Momentum shifting bullish — setup favors continuation higher unless invalidated. Stay alert for breakout volume.

BTC SHORT TP:97,500 23-06-2025We’re looking at a false bullish spike setup — that means it looks strong, but it’s all smoke.
Shorting between 102,500–103,600, targeting 97,000–97,800 with a solid 3.8 RR.
Timeframe: 4H.
Expected to play out in the next 24 to 30 hours, otherwise invalid.
There’s still a chance of manipulation to the upside, but we’re betting on rejection.
We don’t use indicators, we’re not out here drawing lines or cute little shapes — I just give you a clean trade.

Bitcoin(BTC/USD) Daily Chart Analysis For Week of June 20, 2025Technical Analysis and Outlook:
In the recent trading session, Bitcoin exhibited an upward trend; however, it subsequently experienced a significant decline from the established Mean Resistance level at 110300. On Friday, Bitcoin exhibited notable price action, characterized by a pump-and-dump scenario. At this juncture, Bitcoin is retracing downwards as it seeks to approach the Mean Support level at 101500 and the ultimate Inner Coin Dip at 96500. It is essential to acknowledge the potential for an upward rally from the Mean Support levels of $101500 and/or the Inner Coin Dip at $96500. Such a rally could culminate in a retest of the Mean Resistance level at $107000.

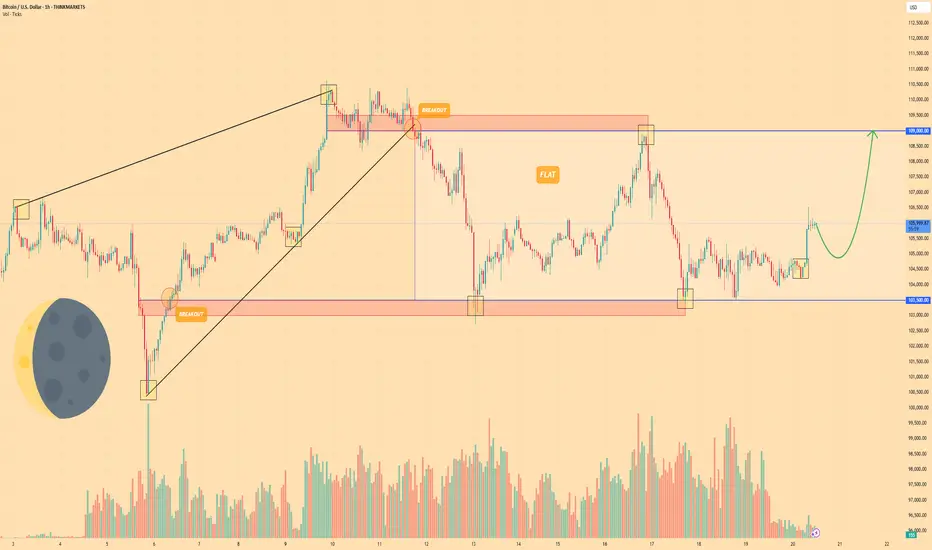
BITCOIN - Price can continue grow inside flat to $109000 levelHi guys, this is my overview for BTCUSD, feel free to check it and write your feedback in comments👊
A few days ago, the price entered a wedge, declining below the $103500 level and then making a strong impulse up.
Next, price broke $103500 level one more time and rose to resistance line of wedge, after which started to decline.
BTC broke $109000 level and started to trades inside a flat, where it declined to support level and then bounced up.
Price rose to resistance level, which is top part of flat, and then at once dropped back and started trading close.
But some time later, price bounced from this level and started to grow, and even now it continues to grow.
So, I think that BTC can make a small correction movement and then continue to grow to $109000 level.
If this post is useful to you, you can support me with like/boost and advice in comments❤️
Disclaimer: As part of ThinkMarkets’ Influencer Program, I am sponsored to share and publish their charts in my analysis.
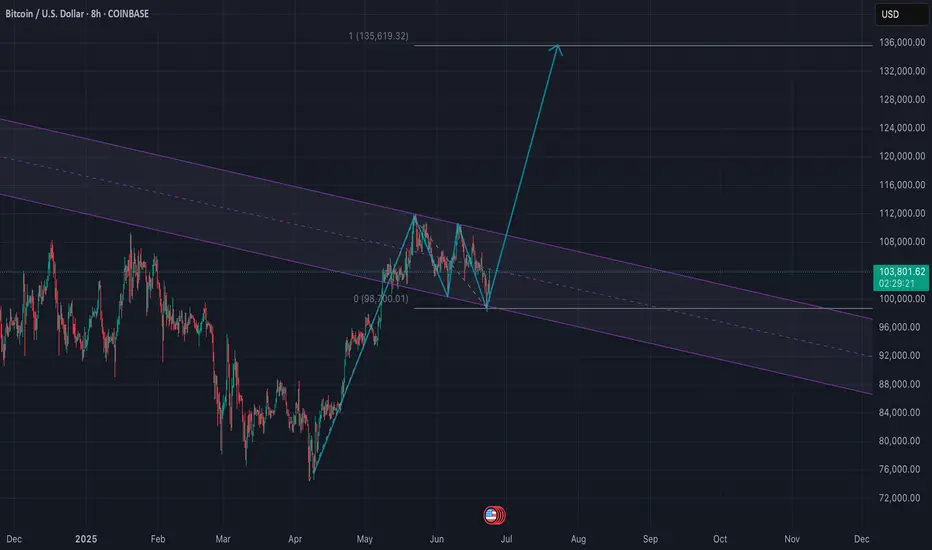
Next target, minimum $135kTo me this looks like a very obvious bull flag. Next target, $135k derived from the length of the flag pole and repeating it from the recent low.
B/$We have already seen a level below $100,000.
I think there is still more to go before it turns up.
I don't see any resistance for a trend reversal at the moment.
So you can hold your short positions and just move your stop loss even lower.

BTC levels to watch for a breakoutMarkets are quiet, and Bitcoin is coiling. A potential breakout looms as we await the President’s Working Group crypto update by July 23. Will positive news trigger a rally to $121,000? Watch for key levels and triangle patterns.
This content is not directed to residents of the EU or UK. Any opinions, news, research, analyses, prices or other information contained on this website is provided as general market commentary and does not constitute investment advice. ThinkMarkets will not accept liability for any loss or damage including, without limitation, to any loss of profit which may arise directly or indirectly from use of or reliance on such information.

WAW we ended up again following my imaginary lines .... I'm seeing a potential upside: if war accelerates government spending, it could push central banks to print more money — and that could be fuel for Bitcoin.
Historically, wars come with massive fiscal demands. Governments tend to ramp up military budgets, fund support packages, and stimulate their economies to manage instability — and that often leads to increased money printing.
More fiat currency in circulation typically leads to inflation or a devaluation of purchasing power. In that kind of environment, investors and everyday people start looking for stores of value outside of traditional currencies — like gold, real estate… and now, Bitcoin.
Bitcoin was literally born in response to central banks abusing the money printer. Its fixed supply — 21 million coins — makes it an attractive hedge against inflation and monetary debasement. If war accelerates global instability and fiscal irresponsibility, Bitcoin could benefit as a safe-haven asset.
So yes — war is tragic. But in purely macroeconomic terms, if it triggers massive government spending, printing, and inflation, it could send Bitcoin flying.

Bitcoin Tests Key Support-Healthy Correction Within Bull MarketHealthy Pullback, Strong Structure:
Bitcoin’s recent dip is a constructive correction within a broader bull trend, as it tests the critical $100,000–$105,000 support zone—a former resistance area from early 2025.
Institutional Demand Holds the Line:
Maintaining levels above the psychologically important $100,000 mark highlights continued institutional accumulation and reinforces the underlying strength of the trend.
Momentum Reset, Base Building:
This pullback has helped reset overbought conditions from the prior rally, laying the foundation for the next potential leg higher.
Key Levels to Watch:
Support: $100,000–$105,000
Breakout Trigger: A close above $108,000 would confirm uptrend continuation
Outlook: Bullish bias remains valid as long as support holds
Investor Opportunity:
With structure intact and downside contained, this consolidation presents a favorable risk-reward setup for long-term investors looking to position ahead of a potential breakout.
#Bitcoin #BTC #CryptoMarket #TechnicalAnalysis #SupportAndResistance #BullMarket #RiskReward #InstitutionalBuying #MarketOutlook #PriceAction

BITCOIN 1hr Still Bullish After dropping below the $100,000 and printing a lower low we can say that there will be a test to that low and probably will breach it, but before doing that it will go and test the $102725 - $103500 area to complete its 1hr Bullish TIME Cycle.
A break to the ATHs still on the table, remember that the ATHs is on the weekly chart and
that hasn't changed at all, only a break to the $74000 low will change the structure of the
Weekly chart. Once the 4hrs Bullish TIME Cycle sets up for a bounce we will start seeing higher highs again but for now the 30min and 1hr TIME Cycles will be playing out.
We'll follow the move with updates so stay tuned.