Long Scenario Invalidated — Watching for Deeper Correction🚫 Long scenario is canceled!
Price started to break down, taking out the early June lows.
There's now a high probability of a deeper correction toward the 90,000–95,000 range.
I won’t short from current levels. The uptrend remains intact on the weekly chart. There are safer and more asymmetric opportunities in the market from a risk-reward perspective. For example, shorting the S&P 500 or going long on precious metals looks more attractive right now.
💡 General recommendation:
Stay away from high-volatility assets like Bitcoin, oil, and natural gas for now.
Wait for setups with tight stop-loss levels and clear structure before entering.
BITCOIN trade ideas

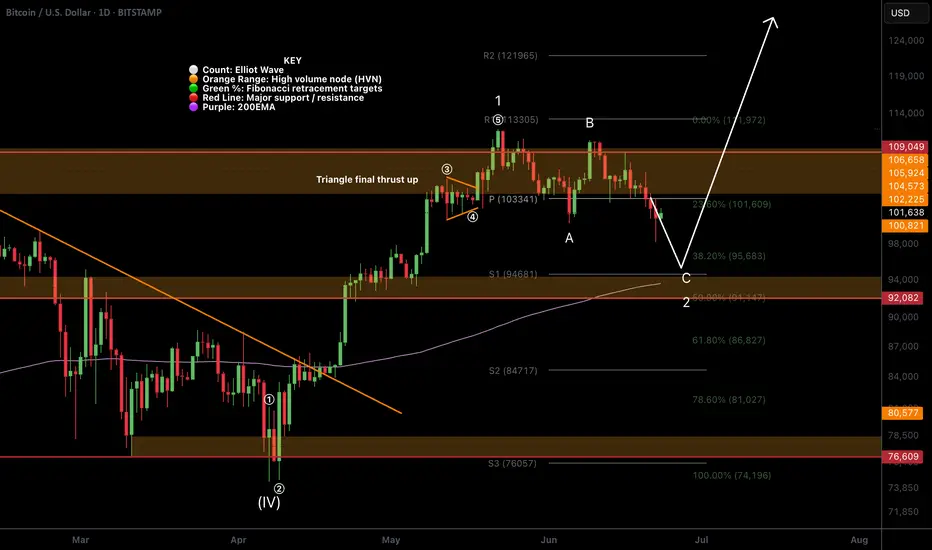
BTC Textbook Elliot Waves!CRYPTOCAP:BTC local analysis hasn't changed in a few weeks.
Price printed another text book Elliot motif wave, with the wave 4 triangle terminal pattern ending in the usual thrust up with a poke above all time high.
Price is also printing a textbook ABC for wave 2 with 5 waves down for A, 3 waves up for B and a strong wave C down to finish. Wave C's are always the strongest.
Pattern suggests price has one more push lower to complete this corrective wave tapping the quadruple support: S1 daily pivot, ascending daily 200EMA, major support High Volume Node (HVN) and 0.5 Fibonacci retracement at 92-94k range.
Most investors are publicly calling for buys in this area so price may be front run by the whales! The consensus often do not get what they want.
Safe trading
Bitcoin's Failed 60-Day Cycle: Relief Rally Before More DownsideBitcoin has officially failed its current 60-day cycle by breaking below the previous cycle low on June 5th, touching $100,000. This marks a key structural shift that traders should not ignore.
📉 What’s Next? Likely Scenario:
The highest probability setup now is a relief rally toward the Stoch RSI highs on the 1-Day and 3-Day timeframes, followed by a move downward into the 60-day cycle low, projected to form between late July and early August. This aligns with a potential retest of the Value Area Low from April, a key support zone to watch.
📈 Upside Target:
If we do see bullish continuation in the short term, the main upside target is $105,000. This level is significant as it clusters three Weekly Point of Control (POC) levels from May and June, making it a high-liquidity magnet for price. Historically, Bitcoin tends to gravitate toward these levels when several align closely.
💼 Current Positioning:
I’m currently long BTC and ETH, and I’m watching closely for Stoch RSI to top out on the 1-Day and 3-Day timeframes. I’ll look to reduce or exit those positions as we approach those cycle peaks.
🔔 Pro Tip: Price often seeks out stacked POC levels. If you’re a volume profile trader, keep $105K on your radar.
📌 P.S. For access to my custom indicators and deeper cycle analysis, check the description in my profile.

Critical Cycle Cluster 21st-22nd for BTCNote the geometrical confluences in the last hours of the 22nd (UTC-4).
A bigger swing is expected to influence the higher timeframes as well.
Notice the table, many consecutive hours with lower intensity can add up to a bigger cluster. It popped up because of the chart geometry; otherwise it may pass unnoticed.

$BTC Lost $100K Support – Retesting From Below Bitcoin broke CRYPTOCAP:BTC Lost $100K Support – Retesting From Below
Bitcoin broke the key $100K support and dropped to $98,200, but has now bounced slightly and is trading near $100,800. However, the situation remains bearish.
🔸 Key Support Zone at 99,763 – 103,112 (Broken & Retesting):
This zone is now being tested from below. If BTC fails to reclaim it, downside pressure continues.
🔸 Upside Target: 110,324 (Invalidated)
Only a strong move back above $103K can revive bullish momentum.
🔸 Risk Level at 100K:
If today’s daily candle closes below $100K, expect more downside — next major target is around $92,000.
🔸 Outlook:
BTC is in a bearish retest phase.
If $100K holds as resistance → expect further dump to $92K.
If reclaimed with strength → structure may stabilize.
Shorts still in profit — manage wisely.
Stay alert. Global tension keeps markets highly reactive. Keep risk tight and follow the trend.

[BTC] What if ...If we have to reach a new ATH soon, I want it to be after this kind of catalyser event, massive liquidations, huge levels sweeped and very pessimistic post on X about the end of the 4 years cycle.
So let's see what CRYPTOCAP:BTC can do next ...
Great Trade !

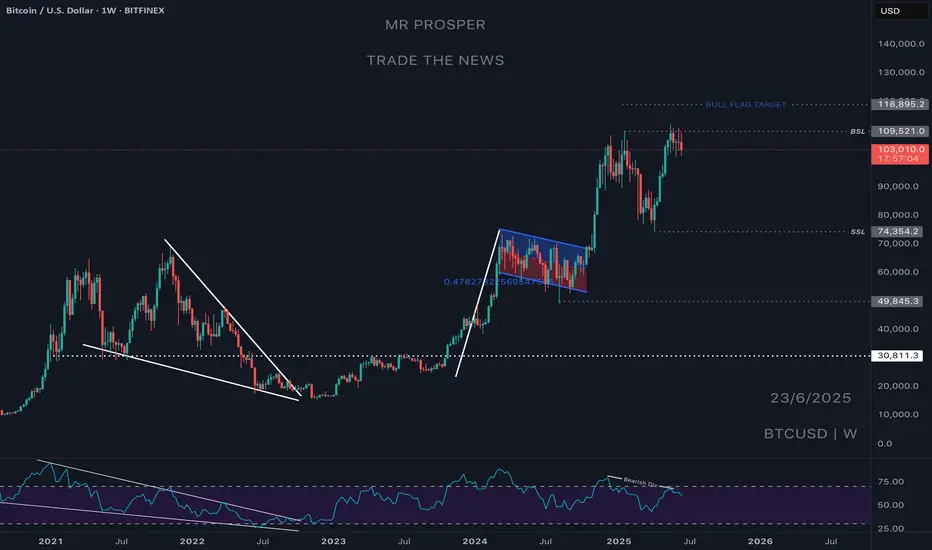
Final Shakeout Before BTC’s Last Leg Up?BTC Update
Well due update here...
Since my last forecast, price pushed higher without giving the pullback I was anticipating — instead sweeping liquidity above the prior ATH.
After taking that BSL, price stalled and has since been ranging, showing clear signs of bearish momentum creeping in. We're seeing bearish orderflow on the LTF and daily, and volume is thinning out up at these highs — not ideal for bulls.
USDT.D is also pushing higher and showing strength, which typically leans bearish for BTC in the short term. The structure on that chart is bullish and supports the idea of a BTC pullback being likely before any continuation higher.
That said, I'm still pro-trend bullish overall — as I mentioned in April — thanks to the clean bullish shift from the range lows and clear signs of accumulation. We’ve got textbook last points of support (LPS) and unmitigated demand sitting below current price, which are prime candidates for a reversal.
Right now I’m eyeing two key levels:
Upper demand zone / LPS — lining up with the top of the prior accumulation range. This has strong confluence as a breakout-retest zone.
Lower refined weekly/2W demand — valid if we see a deeper flush or capitulation leg, though less likely in the short term.
My focus is on the first level. I’ll be watching for reactions and reversal signals if price taps into it. Same logic applies to USDT.D as it approaches nearby supply zones.
Overall, I see this as a healthy correction — overdue after an extended leg — and expect BTC to push higher and break ATHs once demand is retested and confirmed.
Zooming out: the 4-year cycle is approaching its final stages, with data suggesting a cycle top could form around Q3/Q4 2025 — likely between August and October, if past cycles rhyme. I’ll be monitoring major assets against that timeline and will look to scale out and risk-off when the confluences begin aligning with that macro cycle window.
Just think...
1 last BTC leg up...
Final altseason hype to drag in latecomers...
Then the cycle ends — and the trap shuts as we re-enter bear territory.
Charts:
1D:
3D:
1W:
Extra:
1M:


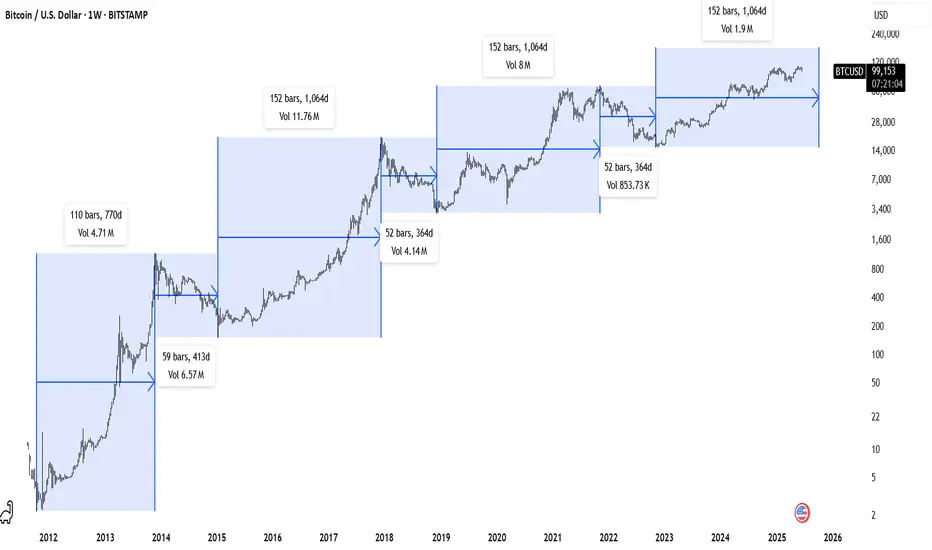
BTC Weekly - Time PatternsBitcoin Weekly Chart
52 Wk & 152 Wk Patterns // Diminishing returns
For my own personal logs.
BTC / USDT - Look Closely!!!Good evening fellas,
Take a very close look and buy bitcoin.
Trade thirsty, my friends.

BTCUSD: Israel-Iran conflict like October 2024.Despite the Middle East tension, Bitcoin remains long term bullish on its 1W technical outlook (RSI = 63.167, MACD = 6883.200, ADX = 33.150). It remains supported on its 1D MA50, in fact in the same manner it was during the previous Israel-Iran conflict. I was on October 26th 2024, when Israel launched three waves of strikes against 20 locations in Iran and other locations in Iraq, and Syria. Simila to the June 13th 2025 attacks. It is more than striking how similar the two price patterns are. Assisted by the U.S. elections on November 5th 2024, a massive rally followed the Middle East conflict. A repeat of that may very well send Bitcoin to $150,000 and above.
## If you like our free content follow our profile to get more daily ideas. ##
## Comments and likes are greatly appreciated. ##

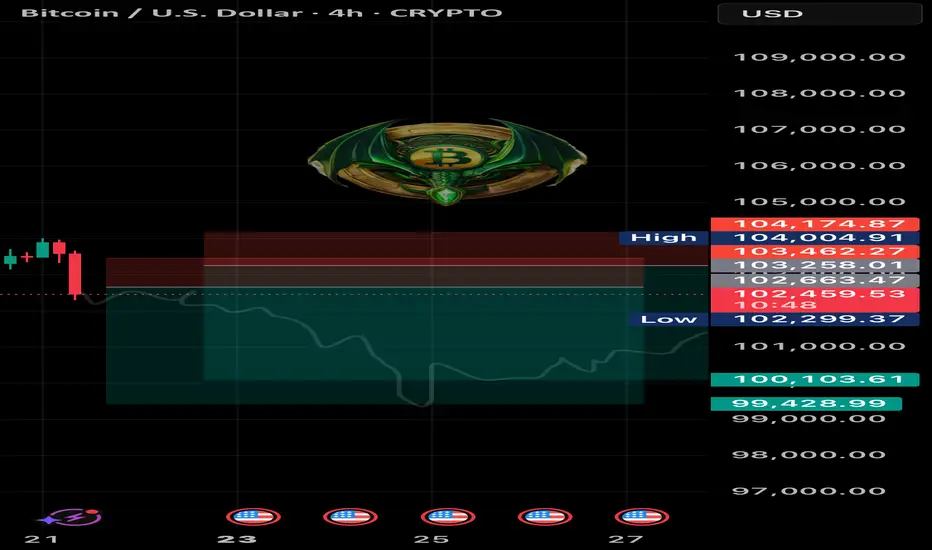
BTC SHORT TP:-100,000 21-06-2025What if this is the one that nukes it all? 😮💨
I’m entering a short between 102,500 and 103,600, aiming for a target around 99,500 – 100,200, with an average RR of 4.
This is based on the 4H timeframe, and should play out in the next 48 to 60 hours.
The structure still favors bearish continuation. If BTC breaks through the 100k level, we might be staring at a black swan scenario.
Manage your stop according to your risk plan and stay tuned for updates.
We don’t use indicators, we’re not out here drawing lines or cute little shapes — I just give you a clean trade.
If the move doesn’t happen within the estimated time, the trade is invalid.
#Btc Breakdown Begins: Double Top + Iran-Israel Tensions = CrBitcoin has clearly formed a double top pattern and is currently hanging near the critical 100K support. If this level breaks, we may first see a fall to 90K, followed by a deeper decline toward 73.5K. If that too fails to hold, the market could slide drastically to 64K–45K zones. The pattern indicates Bitcoin is exiting the distribution phase, with profit booking at aggressive levels.
The Iran-Israel conflict, intensified by U.S. involvement, has triggered panic and short positions across the market. This is a high-risk environment, and long entries could be dangerous right now. Caution is advised — we are entering a potentially sharp correction phase.

HelenP. I Bitcoin can correct to trend line and start move upHi folks today I'm prepared for you Bitcoin analytics. In this chart, we can observe how the price developed a gradual upward trend, respecting the trend line as dynamic support multiple times. After each interaction with this line, the price showed a consistent pattern of rebounding and continuing its upward movement. Recently, the price faced a notable correction, which pushed it back toward this trend line once again, a critical zone that has proven its relevance as a support area. Upon touching the line, the market reacted with a bounce, signaling that buyers are still active and defending the structure. The price began to climb again, regaining some momentum, though it hasn’t yet managed to break the previous highs. Now BTCUSD is hovering near the ascending trend line, preparing for what could be another retest. If the trend holds, we may see a short-term decline toward this line, followed by a bullish rebound. I expect the price to push higher from this level, targeting the resistance zone near 108300, which also acted as a rejection area in the past. If you like my analytics you may support me with your like/comment ❤️
Disclaimer: As part of ThinkMarkets’ Influencer Program, I am sponsored to share and publish their charts in my analysis.

#202525 - priceactiontds - weekly update - bitcoinGood Day and I hope you are well.
comment: Full bear mode. Bulls still trying to make bears doubt it and we are not moving fast enough but we are also not making higher highs. We are close to my validation level for the bears, which is a daily close below 100k. I do think any print above 104k would invalidate my thesis. Targets for bears today/tomorrow are 98k and if we have enough momentum we see 90k.
We are still seeing bigger tails above daily bars which means bulls are trying but since are printing lower lows for two weeks, they are failing. Bears now need to move strongly below 100k and then we can start the acceleration down.
current market cycle: trading range until follow-through below 100k
key levels: 100k - 111k
bull case: Bulls are still hopeful, that’s why we are still above 110k but the next touch could break it and I doubt many will hold long or scale into new ones there. Best bulls can get right now is to go sideways for longer and stay above 100k. I mean… Staying above 100k is as bullish as it get’s if you be honest.
Invalidation is a daily close below 100k - next support below 100k is 98k and then comes 93k
bear case: Bears need to print below 100k and close below. That’s the whole story. Next targets below are then 98k and 93k, breakout-re-test prices. Until they achieve that, it’s slightly higher probability that we move sideways but this market won’t be able to hold above 100k if big indexes sell-off.
Invalidation is above 107k
short term: Bearish but could wait for confirmation below 100k. I doubt we get above 107k again and continue inside the range
medium-long term - Update from 2025-06-22: Daily close below 100k is confirmation. First target below 100k is 97k the breakout retest and after that is the 50% retracement around 93k. I have no bullish for the next weeks/months. Once the gap to 97k closes we are likely in a bear trend again and I expect to hit at least 85k over the summer.

My analysis on BTCUSD I'm expecting a push to the up side from this zone marked on my chart. Please make your own research and if you're entering use a proper risk management

Bull Run Over, See you in 3 years Bitcoin Just took our previous resistance, and it's failing to displace or close above it; instead, it's rejecting and closing below it.
This to me signals a move to SSL and even lower prices for Bitcoin; I will be interested in Bitcoin around the year 2028.
Good bye crypto for now; I'm looking to stack up some funds until 2028 to buy cheap bitcoin around sub-40K levels.
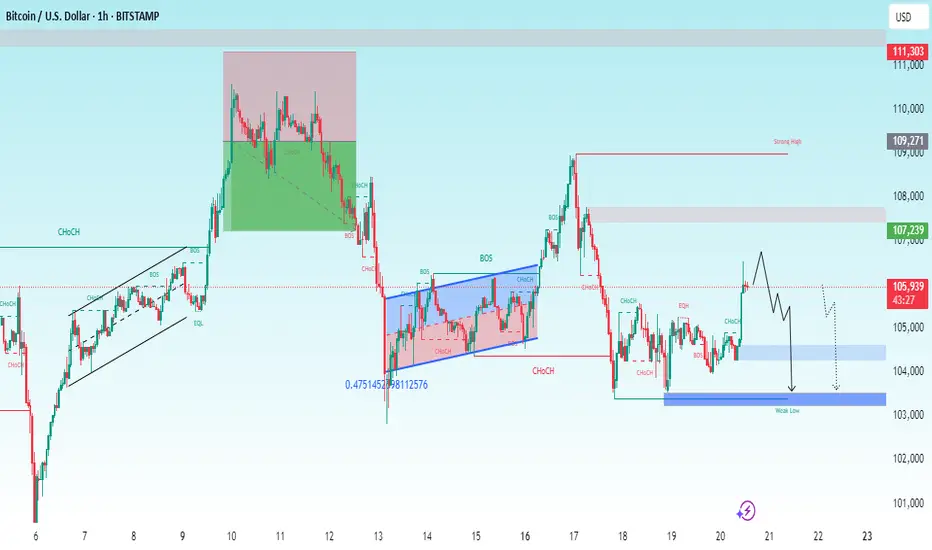
BTCUSD Analysis | is 100k the Next Target?🔍 Chart Breakdown:
Price previously formed a range under key resistance at $108,800.
A Triangle Pattern emerged after a sharp rejection from the resistance zone.
The recent breakdown from this pattern signals bearish momentum.
Support Level: $100,513 — Key level to watch for a potential bounce or further breakdown.
📊 Scenarios to Watch:
🔴 Bearish Case (Preferred):
Breakdown continuation below $104,000 could trigger a move toward the $100,500 support.
Clean rejection from triangle breakdown area confirms the bearish structure.
🟢 Bullish Case (Less Likely):
If BTC holds above $104,000 and breaks above the mid-range zone (~$106,500), a retest of $108,800 is possible.
Watch for fakeouts at the top of the range.
💡Trade Ideas:
Short opportunities on breakdown retest or rejection from $106,000–106,500.
Potential long only if $108,800 is broken with strong volume confirmation.
🛑 Risk Management:
Always use stop-loss. Monitor BTC dominance and macro sentiment for confluence.
💬 What do you think? Bearish breakdown or fakeout trap? Let’s discuss below!

Btcusd Fall ContinuesBitcoin (BTC) tumbled to a low of $101,095 on Friday amid volatility in the market. The effect of the tussle between United States (US) President Donald Trump and Tesla Chief Elon Musk negatively influenced the NASDAQ and Tesla's stock price on Thursday, although both are recovering on Friday.
BTC posibility if fundamental favoursBTC posibility if fundamental favours.
This baby has beenrushing downhill for afew days now.
As always, my thoughts are on the chart.
Please trade this RR of 1:1.69 with care

no need riskIt seems that BTC is in decline and taking inspiration from the past, I think the closest place to the averages is the safest place to buy. The safest... then I will look at the charts and evaluate the situation. If it does not look healthy, I will focus on the 2nd target.

BTCUSDT - major support, Cut n Reverse Area??#BTCUSDT... market just r ached at his one of the most expensive area of the week and month
Keep close 101200
That is our ultimate supporting area.
Note: below 101200 we will cut n reverse on confirmation.
Good luck
Trade wisely

BITCOIN (BTCUSD): Strong Bullish Confirmation?!
Bitcoin has a high chance to rise more, following
a strong bullish reaction to a rising trend line on a 4H.
Goal - 108000
❤️Please, support my work with like, thank you!❤️
