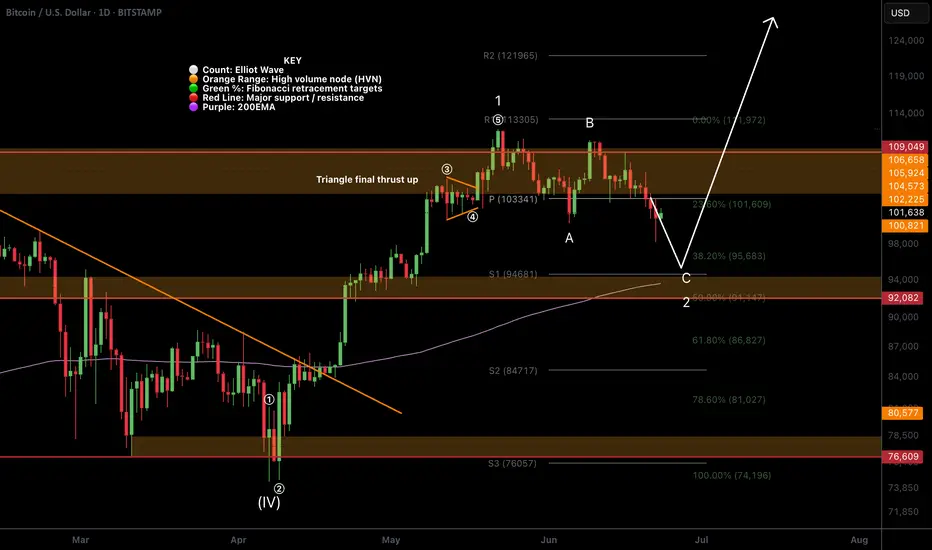
BTC Textbook Elliot Waves!CRYPTOCAP:BTC local analysis hasn't changed in a few weeks.
Price printed another text book Elliot motif wave, with the wave 4 triangle terminal pattern ending in the usual thrust up with a poke above all time high.
Price is also printing a textbook ABC for wave 2 with 5 waves down for A, 3 waves up for B and a strong wave C down to finish. Wave C's are always the strongest.
Pattern suggests price has one more push lower to complete this corrective wave tapping the quadruple support: S1 daily pivot, ascending daily 200EMA, major support High Volume Node (HVN) and 0.5 Fibonacci retracement at 92-94k range.
Most investors are publicly calling for buys in this area so price may be front run by the whales! The consensus often do not get what they want.
Safe trading
BITCOIN trade ideas
Bitcoin (BTC): Buyers Took Back Control Over $100KBitcoin has bounced and showed some buyside volume near major support area near $100K. After the re-test of 100EMA where price dipped lower than $100K we have had a decent recovery every since.
Monday is starting strong with price jumping back above $100K and most probably we will see some fruther buyside dominance from here.
Swallow Academy

BTC/USD:Intraday Trading Analysis and StrategyI. Daily Chart Trend Analysis
On the daily timeframe, BTC/USD closed with a small bearish candle yesterday, forming a consecutive series of bearish candles that clearly indicate a downtrend. The price continues to trade below the moving average system, and the technical indicators have formed a death cross, further confirming the bear-dominated market structure. However, in this clear downtrend, two key risks require attention:
1.Oversold rebound risk: After sustained declines, the market may experience a significant corrective rally.
2.Priority of risk control: Regardless of market movements, strict stop-loss management and position sizing remain core trading principles.
II. Hourly Chart Technical Analysis
The hourly chart shows that the price fell sharply under selling pressure during U.S. trading hours yesterday, breaking below the key $100,000 level. This morning, the price rebounded strongly after hitting a low, with the breakdown level near $102,700. Currently, the K-line forms a large bullish candle, and the technical indicators have formed a golden cross, suggesting that a corrective rally is likely to continue today. Note that if the price breaks above the breakdown level of $102,700, the short-term downtrend may be disrupted, and the market could shift to a range-bound pattern.
BTCUSD
sell@102000-102500
tp:101000-100500
I am committed to sharing trading signals every day. Among them, real-time signals will be flexibly pushed according to market dynamics. All the signals sent out last week accurately matched the market trends, helping numerous traders achieve substantial profits. Regardless of your previous investment performance, I believe that with the support of my professional strategies and timely signals, I will surely be able to assist you in breaking through investment bottlenecks and achieving new breakthroughs in the trading field.

$BTC Lost $100K Support – Retesting From Below Bitcoin broke CRYPTOCAP:BTC Lost $100K Support – Retesting From Below
Bitcoin broke the key $100K support and dropped to $98,200, but has now bounced slightly and is trading near $100,800. However, the situation remains bearish.
🔸 Key Support Zone at 99,763 – 103,112 (Broken & Retesting):
This zone is now being tested from below. If BTC fails to reclaim it, downside pressure continues.
🔸 Upside Target: 110,324 (Invalidated)
Only a strong move back above $103K can revive bullish momentum.
🔸 Risk Level at 100K:
If today’s daily candle closes below $100K, expect more downside — next major target is around $92,000.
🔸 Outlook:
BTC is in a bearish retest phase.
If $100K holds as resistance → expect further dump to $92K.
If reclaimed with strength → structure may stabilize.
Shorts still in profit — manage wisely.
Stay alert. Global tension keeps markets highly reactive. Keep risk tight and follow the trend.

[BTC] What if ...If we have to reach a new ATH soon, I want it to be after this kind of catalyser event, massive liquidations, huge levels sweeped and very pessimistic post on X about the end of the 4 years cycle.
So let's see what CRYPTOCAP:BTC can do next ...
Great Trade !

Bull Run Over, See you in 3 years Bitcoin Just took our previous resistance, and it's failing to displace or close above it; instead, it's rejecting and closing below it.
This to me signals a move to SSL and even lower prices for Bitcoin; I will be interested in Bitcoin around the year 2028.
Good bye crypto for now; I'm looking to stack up some funds until 2028 to buy cheap bitcoin around sub-40K levels.
The Bears and the Bulls So Bitcoin is consolidating from 101K to 109K, from an uptrend which is probably but not certainly a continuation pattern. BTC is still above the 10 EMA means bullish short-term, confluent with market structure, and above 200 EMA long term bullish. BTC might cycle back up in the flag pattern or break below the 10 EMA, which could possibly (not certainly) send it probably to the 50 EMA in purple and the trendline and a Demand zone. The bulls would love for BTC to close above the flag pattern and resistance and make HH and HL from there; and the bears would love to see rejection and a return back to the Demand levels.

BITCOIN | Bullish DivergenceBITCOIN has been in bearish trend so far but it has now formed bullish divergence which may initiate a new bullish trend.

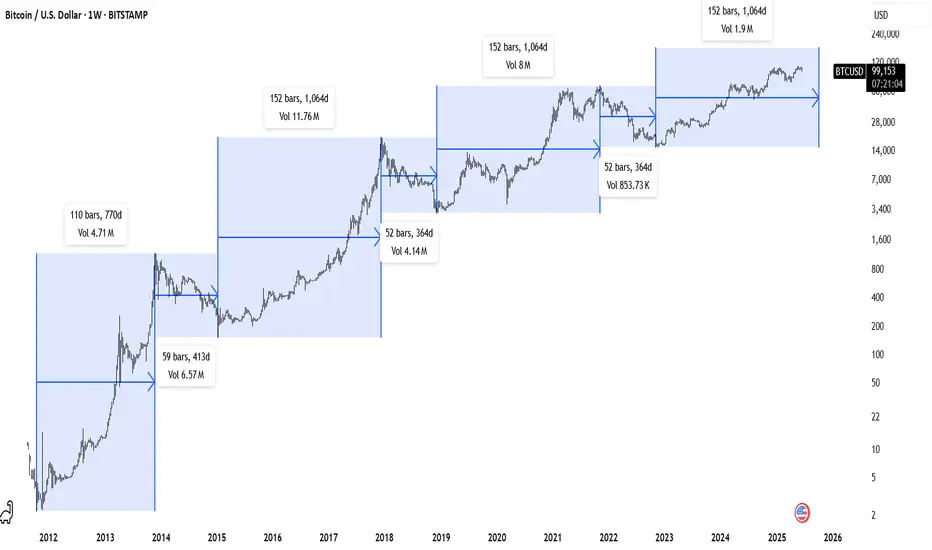
BTC Weekly - Time PatternsBitcoin Weekly Chart
52 Wk & 152 Wk Patterns // Diminishing returns
For my own personal logs.
BITCOIN Free Signal! Buy!
Hello,Traders!
BITCOIN is retesting a
Horizontal support level
Around 101,288$ from
Where we will be expecting
A local rebound so we can
Go long with the Take Profit
Of 104,324$ and the Stop
Loss of 100,300$
Buy!
Comment and subscribe to help us grow!
Check out other forecasts below too!
Disclosure: I am part of Trade Nation's Influencer program and receive a monthly fee for using their TradingView charts in my analysis.

BTC / USDT - Short Set-UpEvening friends,
Looks like a probable idea, since we're just printing a lower low.
I shorted it already, lets see it play out.
Trade thirsty, my friends!

BTC SHORT TP:-100,000 21-06-2025What if this is the one that nukes it all? 😮💨
I’m entering a short between 102,500 and 103,600, aiming for a target around 99,500 – 100,200, with an average RR of 4.
This is based on the 4H timeframe, and should play out in the next 48 to 60 hours.
The structure still favors bearish continuation. If BTC breaks through the 100k level, we might be staring at a black swan scenario.
Manage your stop according to your risk plan and stay tuned for updates.
We don’t use indicators, we’re not out here drawing lines or cute little shapes — I just give you a clean trade.
If the move doesn’t happen within the estimated time, the trade is invalid.
#Btc Breakdown Begins: Double Top + Iran-Israel Tensions = CrBitcoin has clearly formed a double top pattern and is currently hanging near the critical 100K support. If this level breaks, we may first see a fall to 90K, followed by a deeper decline toward 73.5K. If that too fails to hold, the market could slide drastically to 64K–45K zones. The pattern indicates Bitcoin is exiting the distribution phase, with profit booking at aggressive levels.
The Iran-Israel conflict, intensified by U.S. involvement, has triggered panic and short positions across the market. This is a high-risk environment, and long entries could be dangerous right now. Caution is advised — we are entering a potentially sharp correction phase.

Wyckoff Structure Targets 92K–94K Retest Before Continuation!A rare and highly instructive market structure is currently unfolding, presenting a textbook case of Wyckoff pattern integration across multiple timeframes.
Over the past weeks, I’ve been tracking a series of smaller Wyckoff accumulation and distribution patterns nested within a larger overarching Wyckoff structure. Each of these smaller formations has now successfully completed its expected move — validating the precision of supply/demand mechanics and the theory’s predictive strength.
With these mini-cycles resolved, the spotlight now shifts to the final, dominant Wyckoff structure — a larger accumulation phase that encompasses the full breadth of recent market activity. According to the logic of Phase C transitioning into Phase D, price appears poised to revisit the key retest zone between 92,000 and 94,000, a critical area of prior resistance turned demand.
📉 Current Market Behavior:
📐 Multiple minor Wyckoff patterns (accumulations/distributions) have played out as expected, both upward and downward — lending high credibility to the current macro setup.
🧩 All formations are nested within a major accumulation structure, now in the final phase of testing support.
🔁 The expected move is a pullback toward the 92K–94K zone, before the markup phase resumes with higher conviction.
📊 Wyckoff Confidence Factors:
✅ All Phase C spring and upthrust actions respected
✅ Volume behavior aligns with Wyckoff principles (climactic action → absorption → trend continuation)
✅ Clean reaccumulation signs within current structure
✅ Institutional footprint visible through shakeouts and well-defined support/resistance rotations
💬 Observation / Call to Action:
This setup is a rare opportunity to witness multi-layered Wyckoff theory in motion, offering not only a high-probability trading setup but also an educational blueprint. I invite fellow traders and Wyckoff analysts to share their interpretations or challenge the current thesis.
➡️ Do you see the same structural roadmap?
Let’s discuss in the comments.

#202525 - priceactiontds - weekly update - bitcoinGood Day and I hope you are well.
comment: Full bear mode. Bulls still trying to make bears doubt it and we are not moving fast enough but we are also not making higher highs. We are close to my validation level for the bears, which is a daily close below 100k. I do think any print above 104k would invalidate my thesis. Targets for bears today/tomorrow are 98k and if we have enough momentum we see 90k.
We are still seeing bigger tails above daily bars which means bulls are trying but since are printing lower lows for two weeks, they are failing. Bears now need to move strongly below 100k and then we can start the acceleration down.
current market cycle: trading range until follow-through below 100k
key levels: 100k - 111k
bull case: Bulls are still hopeful, that’s why we are still above 110k but the next touch could break it and I doubt many will hold long or scale into new ones there. Best bulls can get right now is to go sideways for longer and stay above 100k. I mean… Staying above 100k is as bullish as it get’s if you be honest.
Invalidation is a daily close below 100k - next support below 100k is 98k and then comes 93k
bear case: Bears need to print below 100k and close below. That’s the whole story. Next targets below are then 98k and 93k, breakout-re-test prices. Until they achieve that, it’s slightly higher probability that we move sideways but this market won’t be able to hold above 100k if big indexes sell-off.
Invalidation is above 107k
short term: Bearish but could wait for confirmation below 100k. I doubt we get above 107k again and continue inside the range
medium-long term - Update from 2025-06-22: Daily close below 100k is confirmation. First target below 100k is 97k the breakout retest and after that is the 50% retracement around 93k. I have no bullish for the next weeks/months. Once the gap to 97k closes we are likely in a bear trend again and I expect to hit at least 85k over the summer.

Bitcoin (BTC/USD) Technical Forecast🧭 Market Snapshot:
Bitcoin is showing signs of short-term weakness with price hovering around $102,800. The daily candle is forming an inside bar, suggesting indecision — typically a setup for a larger move ahead.
🔮 Forecast:
📅 1-Day Outlook:
BTC is expected to remain in a narrow consolidation range between $102,200 and $104,000. A breakout from this inside candle could push price toward $105K, but risk remains skewed slightly lower if support fails.
📅 1-Week Outlook:
With daily and 4H RSI trending under 45 and price below key EMAs, downside risk builds. If $100K fails, BTC may test the $98.5K zone, potentially down to EMA 144 near $96.5K.
📅 1-Month Outlook:
If BTC can base between $96.5K–$106K and reclaim the $105K resistance cluster, momentum may shift bullish. Until then, price action is likely to remain choppy and rangebound.
⚠️ Key Technicals:
Support Zones: $102,600 (EMA 55), $99,950 (EMA 89), $96,648 (EMA 144)
Resistance Zones: $105,000–106,000 (EMA 21/34 cluster)
Momentum: RSI < 50 across all timeframes → no bullish momentum yet
Volatility: Moderate, with ATR (14) = 2795
📌 Conclusion:
The bulls need a clear reclaim above $105K to regain control. Until then, expect range trading and possible tests toward $98K–$96K. Stay nimble, watch RSI and EMA reactions closely.

My analysis on BTCUSD I'm expecting a push to the up side from this zone marked on my chart. Please make your own research and if you're entering use a proper risk management

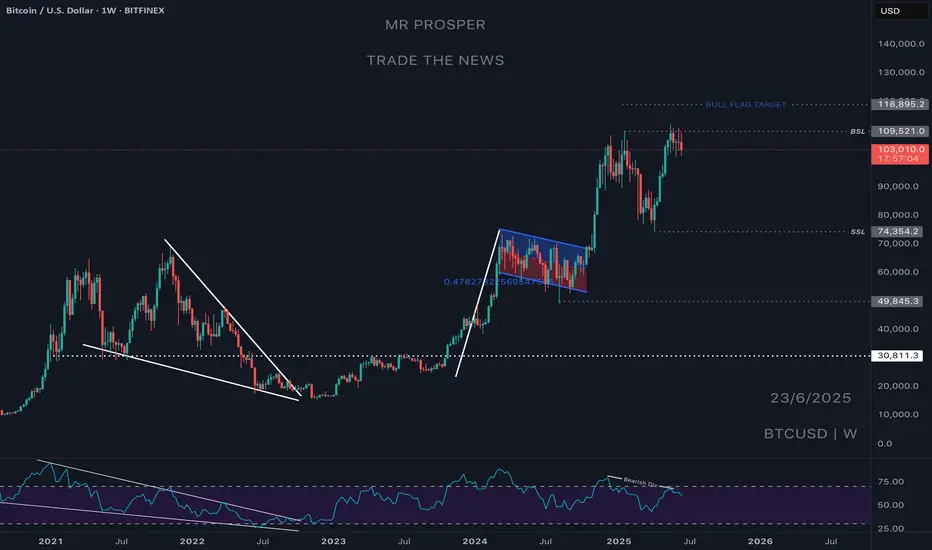
BTC USDT PLAN I favor a short-term pullback unless BTC can reclaim and close above the $111K–112K zone with strong volume.
If price breaks below $106K and confirms it as resistance, it could accelerate a move toward $100K and below.
Caution is warranted for bulls — this looks more like a distribution phase near the highs than a breakout.

Long term parabola setting up on weeklyJust a reminder to zoom out and observe the weekly trend. Even though on a daily basis it may seem we are grinding sideways, if we look at the weekly the trend is getting steeper and steeper, if this holds up we're not far away from starting a huge parabolic move.

BTC daily level observation New perspectivesOn the daily chart, MACD shows divergence.
In the yellow box, there is a possible head and shoulders top structure
Pay attention to whether there is a large real black candlestick at the daily level that breaks through the lower boundary of the box.
Let's wait patiently

ABC Flag / Support LevelAn ABC flag looks to be playing out. If so, BTC's price should not dip below 100 again, but if it does, there is nothing but air until the 95-96 order block.

no need riskIt seems that BTC is in decline and taking inspiration from the past, I think the closest place to the averages is the safest place to buy. The safest... then I will look at the charts and evaluate the situation. If it does not look healthy, I will focus on the 2nd target.

Bitcoin Dip Coming Soon1. Historical Example (Left Side of the Chart - around 2021-2022):
"NFT" Label at the Top: The trader has labeled a peak around late 2021 with "NFT." This likely signifies a period of market euphoria or a local top, possibly correlated with a peak in NFT hype.
Failure to Make New Highs / Bearish Structure: After this peak, the price action shows lower highs and lower lows, indicating a downtrend.
Break of Support: The price broke down from a previous support area.
Targeting Previous Demand: The arrow points down towards a shaded maroon box. This box represents a significant area of previous demand/support FVG (roughly $15,000 - $30,000 in this hypothetical chart) where buyers previously stepped in, or where price consolidated before a major move up. The expectation was that price would revisit this significant prior zone.
2. Current/Projected Scenario (Right Side of the Chart - 2025 onwards):
"NFT" Label at the Current Top: Again, an "NFT" label is placed near the recent high (around
105,000 − 105,000− 110,000 in this chart). This suggests the market is again at a euphoric peak or a significant local top.
Potential Double Top / Rejection: The price has made a significant high and seems to be struggling to push further, showing signs of rejection (as indicated by the recent candles with upper wicks and a potential downturn). This could be forming a double top or a lower high relative to the absolute peak.
Two-Stage Short Target:
First Target (Short Arrow): The shorter arrow points down to a horizontal line around the $75,000 - $80,000 level. This is likely a near-term support level, perhaps a previous swing low or an area of recent consolidation. A break below the current highs might lead to a test of this level.
Second, Larger Target (Long Arrow): The longer arrow points down to a much larger shaded maroon box. This box (roughly $30,000 - $40,000 in this chart) represents a significant, longer-term demand/support zone. This zone was a major area of consolidation or previous resistance that turned into support before the most recent leg up to the $100k+ levels.
Rationale for the Deeper Target: If the near-term support (around 75k−75k−80k) fails to hold, the trader expects a more significant correction.
