2021 - XRP Two MovesXRP typically moves twice during the cycle: once when BTC breaks its previous cycle highs, and again when BTC tops out at the end of the cycle. These moves often occur in waves of equal length within a 365-day window.
BITCOIN trade ideas


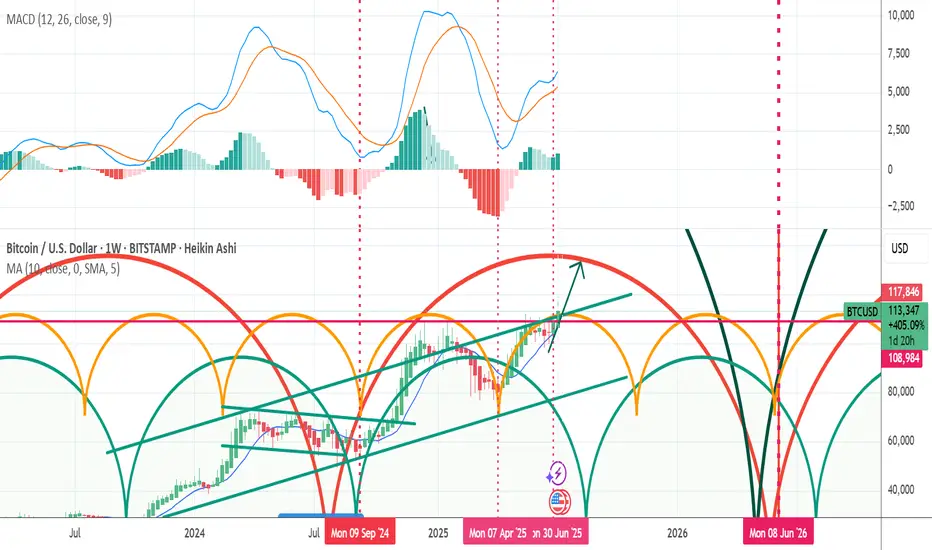
Two scenarios for Bitcoin's pathTwo scenarios for Bitcoin's path from October 2025 to October 2026: Growth to 118,000 and then a drop to 63-64,000 or growth to 236,000 and then a drop to 52,000. I currently give less weight to the second scenario. But the time frame in both scenarios is the same.

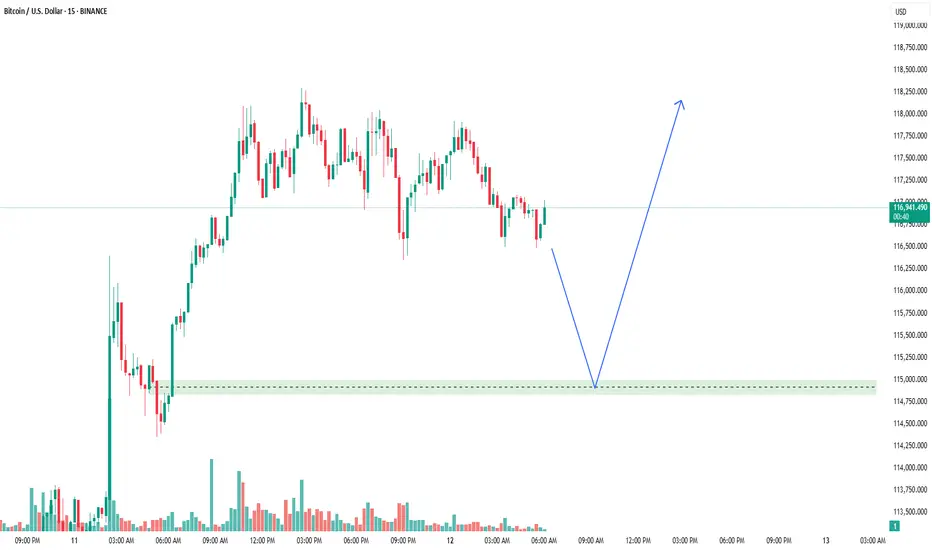
[VNFORECASTER][BTCUSD] Forecast the price action of BTCUSD Forecast the price action of BTCUSD on July 12, 2025
The price continue to move up about next 3-5 weeks
BTC Touching Heights !BTC Extremely bullish. BTC analysis shows that it touch supply zone of 107500 and later went to cross the day before previous day high which was residing on 109,684 and then swept previous week high which was 110,600 with strong buying. It hinted crossing the all time high. After crossing all time high of 111,900 gave a change of around 6000 dollars , At this position the BTC outlook shows it may show reversal of around 4K dollars change. The possibilities for the BTC are shown here. Take risk accordingly.
Disclaimer : It isn't a financial advice check my analysis and decide on your own.

BTCUSD has Breakout from major resistance of 110 KBTCUSD has Breakout from major resistance of 110 K. It may retace before up momentum continues

BTCUSDT BUYING SETUP Bitcoin (BTCUSDT) is forming a strong buying setup as price holds above a key support area. This zone is showing early signs of bullish interest, which could lead to an upward move if momentum continues.
Traders should watch for confirmation signals such as bullish candlestick patterns, higher lows, or a breakout from consolidation before entering. A bounce here could trigger the next leg higher.
Be patient, wait for clear entry signals, and manage your risk carefully! 📈🔥
Technical Analysis by Ali Khan
Bitcoin Breakout Fueled by Hidden Demand ZonesBTC just exploded out of consolidation — but the clues were all there. Price tapped the same demand zone three separate times, each time forming a higher low and respecting a clean rising trendline.
The final push broke through prior supply, flipping it into support and kicking off the breakout leg. These demand zones acted as hidden fuel for the move, offering clear entries for traders tracking structure.
📊 Demand respected at ~$104K, ~$107K, and ~$111K
📈 Breakout confirms rising structure and trendline strength
🧠 Key lesson: Strong moves are often born from clean structure, not noise
#BTCUSD #BitcoinBreakout #SmartMoneyMoves #PriceAction #TradingView #QuantTradingPro

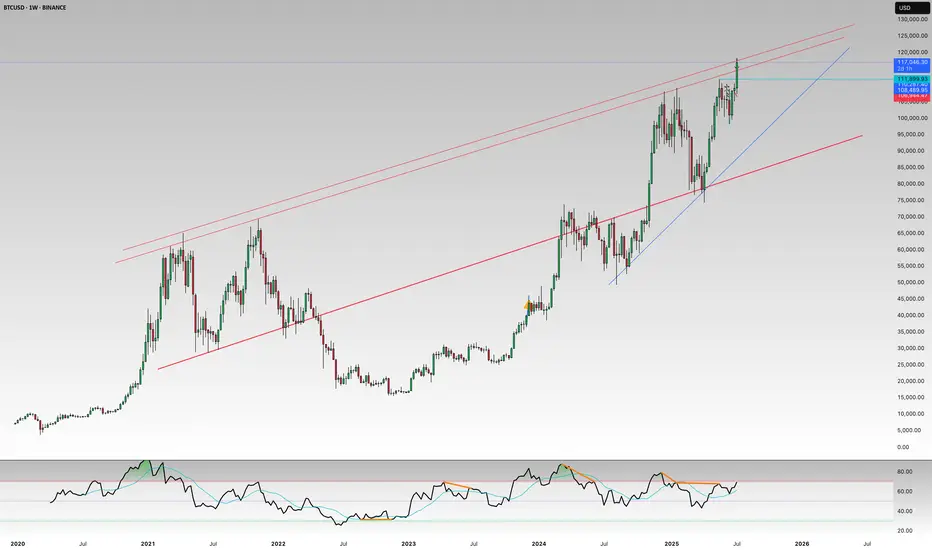
Bitcoin at History high, touching the upper channel lineBTCUSD Weekly Chart – Key Breakout Zone
Bitcoin is now testing the upper boundary of a long-respected weekly trend channel. A clean breakout above this line could trigger a major bullish expansion and lead to price discovery.
This trendline has capped price in the past—keep a close eye on how BTC behaves here. Rejection = pullback risk. Breakout = rocket fuel.
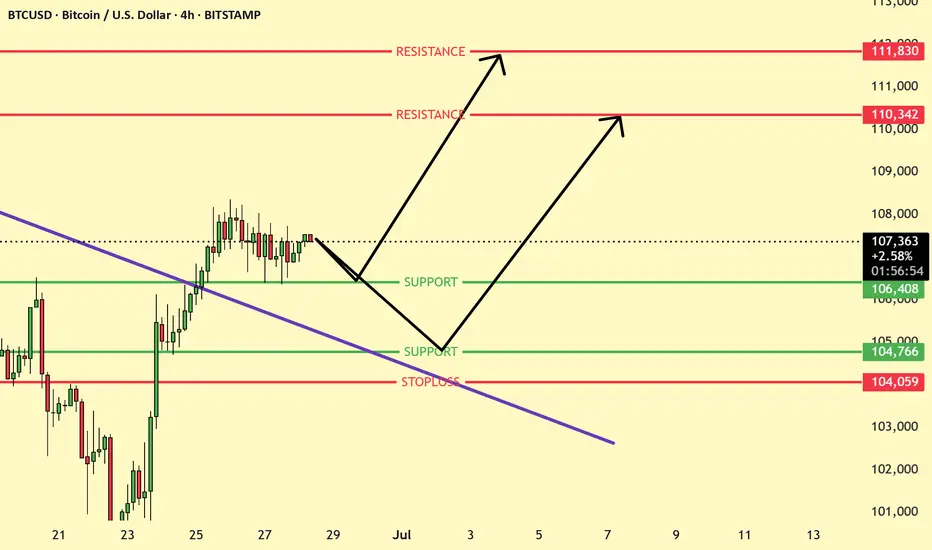
BTCUSD Set up Ready for LongBTCUSD is consolidating around 107,372 after a breakout. Two bullish scenarios are shown: a bounce from 106,408 or a deeper pullback to 104,766 before rallying. Key resistances lie at 110,342 and 111,830. Bullish bias holds as long as price stays above 104,059.
BTC to 150KYup.
I have been following this always,
so I’m sorry for the lack of updates, but life has sidetracked me
I will post more soon

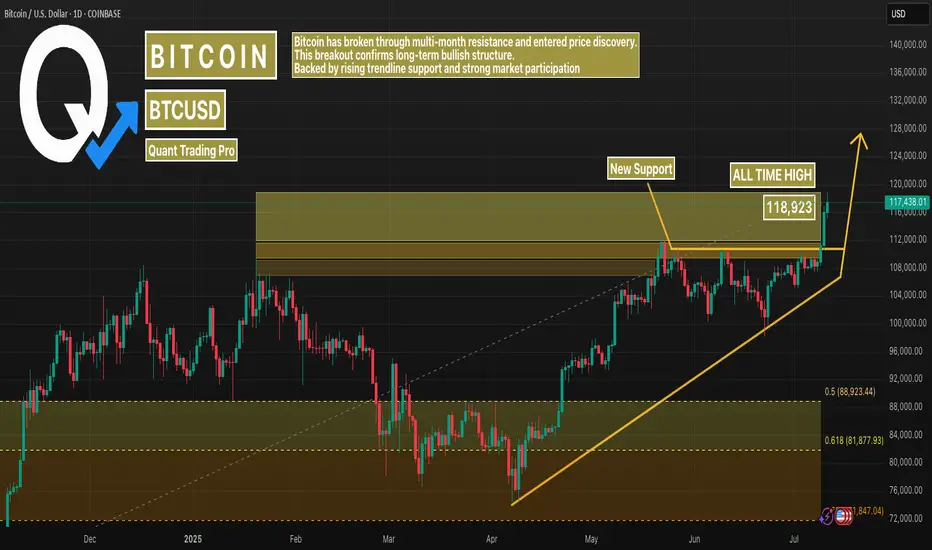
Bitcoin Sets New All-Time High – The Bull Run Is OnBitcoin has just printed a new all-time high, breaking decisively above its previous record and entering price discovery. After months of consolidation below resistance, the breakout above ~$118K confirms a major shift in market structure — from sideways to breakout phase.
This level isn’t just a number — it’s a psychological turning point. ATH breakouts often fuel aggressive momentum, FOMO, and trend acceleration, especially with no historical resistance above. All eyes now shift to round levels like $125K and $135K.
📈 New ATH: $118,923
📊 Previous Resistance: $109K → Now Support
🧠 This is what breakout structure looks like on a macro scale.
#BTC #BitcoinATH #AllTimeHigh #PriceDiscovery #CryptoMomentum #BTCUSD #TradingView
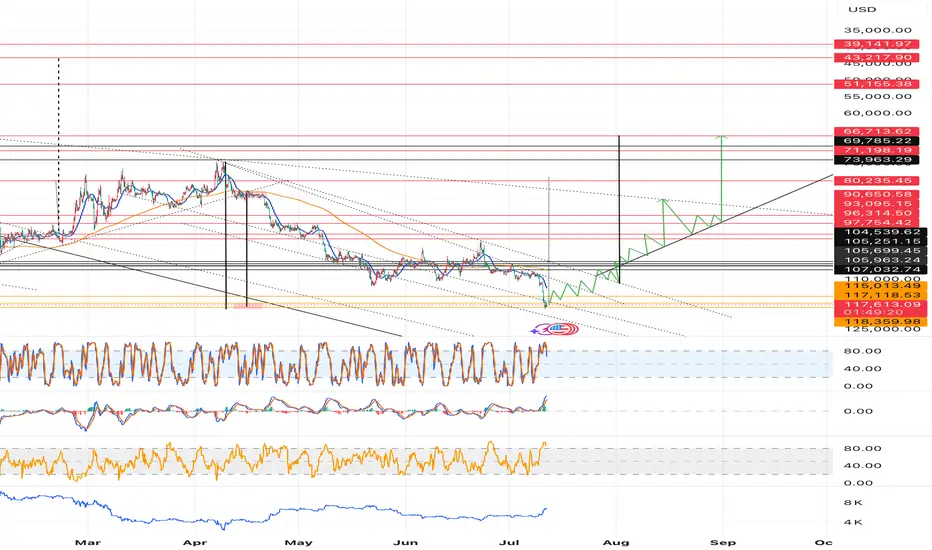
BTC Down then Bounce from 92kIt's going go to down, hit this 50% fib which is also some historical S/R level, then bounce from there.

BTCUSD: BTC at ATH. Time to celebrate? Hmmmm.....7/11/2025Good day, Guys.
I'm back for a little update for Cryptos
Bitcoin
Last, June 19, 2022, I published an idea that Bitcoin may go below $ 16,000.00 and in the future go as high as $145,000.00. Fortunately, it happened as low as $ 15,479.00. I think right now, Bitcoin is heading to 0.786 Fib $ 145,517.00 as 1st target. It can extend the bull rally up to $ 267,735.00 upon successful break of resistance at $ 145,517.00. For now, there is least resistance and more support on Bitcoin. For me, $ 145,517.00 is the only major resistance to go higher. I think, upon reaching $ 145,517.00 many news outlets will make a positive news about Bitcoin and many institutions/celebrities will declare that they invest right now and recommends Bitcoin. Then, all of a sudden, it dumps at a very discounted price due to long term holders cashing out. As a result, many new comers will be shocked and stunned, and the experience traders may short or buy the dip.
Alts & Meme
In my observation, most of the alts and meme coins haven't recover yet and didn't reach the previous all-time-high while bitcoin for past years have already broken the previous ATH. Thus, many alt & meme coin traders is disappointed and losing hope. From what I see, alt & meme coins is extremely over sold and ranging like a kangaroo. I think with this favorable conditions for experience traders will analyze that charts and fundamentals on these coins. I think the liquidity in Bitcoin will transfer to alts & memes in the coming months.
Monthly Timeframe
In Elliot Wave, Bitcoin is right now heading to III - Primary but Wave 5. The Price will go higher and may top at $ 267,735.00
Full view of my Elliot Wave. Wave (III) may last up to year 2028. 1 Bitcoin will be worth millions of dollars. May Luck be with us.
In this timeframe, Bitcoin is very bullish on RSI but if it fails to break the RSI trendline Resistance the price of Bitcoin may decline significantly. If the successfully breaks the RSI trendline resistance, it's definitely to the moon.
Weekly Timeframe
There is confluence of resistance at Trendline & 0.786 Fib $ 145,517.00
May the force be with you all.

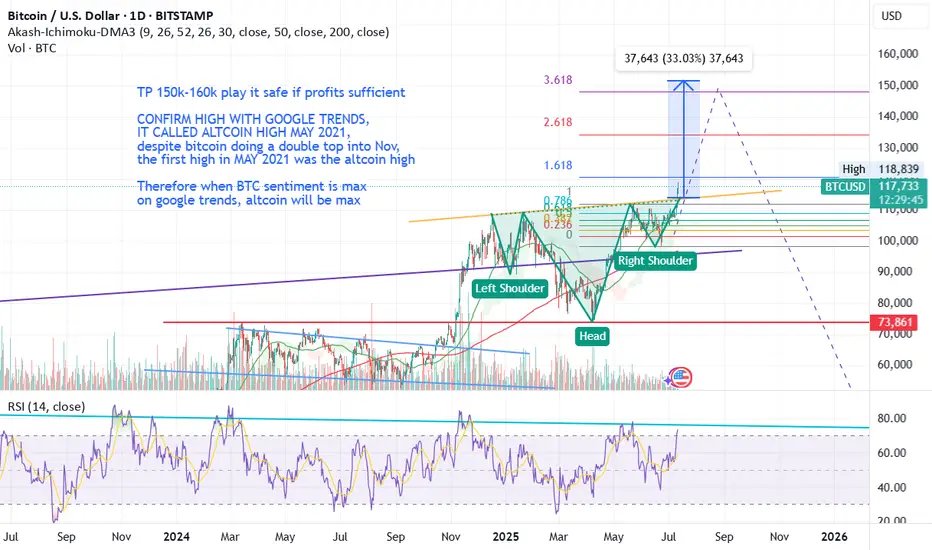
BTCUSD: Bitcoin Clears 109K, More Upside AheadAfter breaking out above its January 2025 peak at 109K, Bitcoin is showing a strong pattern that suggests there's more room to run — with the next key zone likely around 150K to 160K.

(BITCOIN UPDATE) LONG BTC Taking that previous LTF high was broken this changes everything. Now if it can establish a HL this will confirm pushes higher for the near future.
BTC Inverse H&S aligning to 3.618 fib extensionWE'RE OFF BOYS
GL ALL
Don't forget to sell
Not financial advice
Bitcoin Hits Target —Market Prepares for Next Leg UpMarket Overview:
Bitcoin surged to the 118,000 zone, testing the weekly resistance at 116,577 and marking a local top near 121,100. A pullback followed, but the price remains above the key monthly level at 112,097. The overall market structure remains bullish, and another upward leg is likely after consolidation.
Technical Signals & Formations:
— Completed extended ABCD pattern
— Breakout and retest of 112,097
— Support zone between 113,856 and 112,000
— EMA and price structure support the uptrend
Key Levels:
Support: 113,856, 112,097
Resistance: 116,577, 121,108
Scenario:
Primary: as long as BTC holds above 112,000 and forms bullish confirmation on H4, a move toward 116,577 and 121,108 remains likely.
Alternative: a drop below 112,000 may lead to a deeper correction toward 108,140–107,290.

[UPD] BTC / ETH / SOL / XRP / HYPE / SUPER / FLOKIUpdating my view on intermediate trend structures I am tracking in CRYPTOCAP:BTC , CRYPTOCAP:ETH , CRYPTOCAP:SOL , CRYPTOCAP:XRP , GETTEX:HYPE , BSE:SUPER and SEED_DONKEYDAN_MARKET_CAP:FLOKI highlighting key support and resistance zones to watch in the coming sessions
Charts featured in the video:
BTC
ETH
XRP
SOL
HYPE
SUPER
FLOKI
Thank you for your attention and I wish you successful trading decisions!
If you’d like to hear my take on any other coin you’re tracking — feel free to ask in the comments (just don’t forget to boost the idea first 😉).

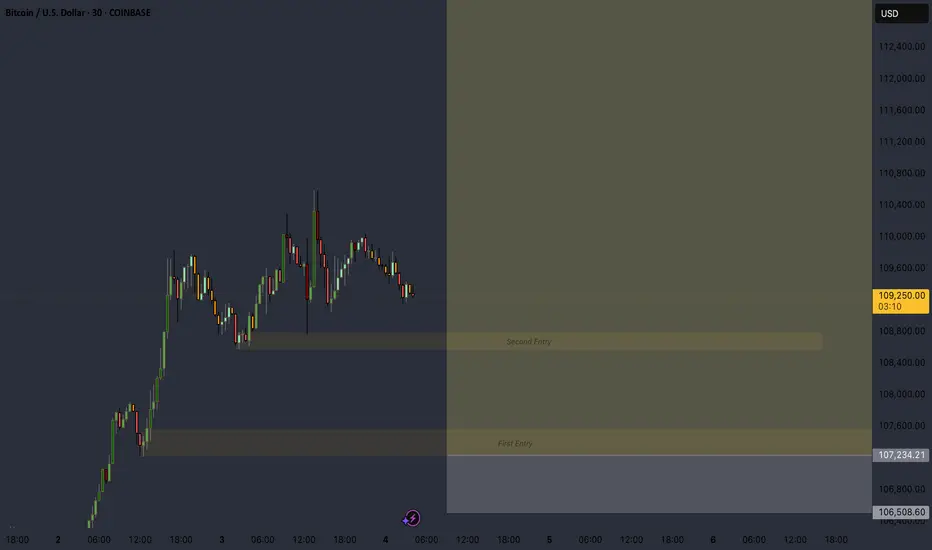
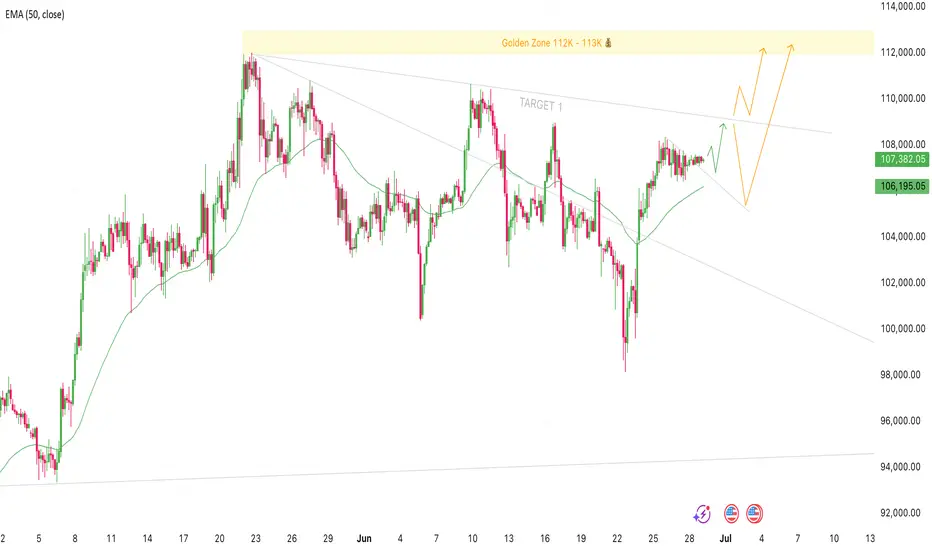
Bitcoin Setup for 109K and New Highs Could Be NextTrade Idea:
Direction: long
Entry: Now 107,350 - 106,800
Stop Loss: 102,000
Target 1: 109,000
Golden Zone: 112,000 - 113,000
Bitcoin has been consolidating for the last four days with no real price increase, but we’ve still managed to break above the short-term descending trend line. This could signal a continuation of the current swing up to the next resistance around 109K, which lines up with the daily trend line.
My bias here is that once we hit that 109K area, we could either see a pullback to around 104 to 106K before pushing higher, or we might break straight through, retest the trendline, and continue quickly to new highs above 112K.
I’ll be watching closely to see how price reacts around 109K, whether it rejects or breaks through. Either way the structure remains bullish, and if we get a rejection I'll be looking to re-enter.
Let's see how this plays out ✌️
Bitcoin breaking out - 150k likely, possibly soon- complimentary analysis to the USDT D. one since they trade opposite of each other:
- 5D volatility is extremely low
- 150k is a mid-term target, it is likely Bitcoin reaches +200k before this bull market cycle is over
