Analysis and layout of BTC trend in the third quarter📰 News information:
1. Pay attention to the movement of the cryptocurrency market
2. The impact of DAA, etc.
📈 Technical Analysis:
As demand weakens and supply pressure rises, BTC's network valuation exceeds the speed of activity. Exchange inflows and negative DAA divergences indicate that despite price stability, the risk of selling remains. Currently, BTC is experiencing a retracement after a rebound. In the short term, it is still possible to retrace to 106,500 and then rise after stabilizing.
🎯 Trading Points:
SELL 108000-107500
TP 107000-106500
BUY 106500-106000
TP 107500-108000
In addition to investment, life also includes poetry, distant places, and Allen. Facing the market is actually facing yourself, correcting your shortcomings, confronting your mistakes, and strictly disciplining yourself. I hope my analysis can help you🌐.
BITCOIN trade ideas


Bitcoin H1 Reversal – Codex Arcanvm + Tactical Breakdown.⊢
⟁ BTC/USD – BINANCE – (CHART: 1H) – (Date: Jun 30, 2025).
◇ Analysis Price: $107,599.99.
⊢
⨀ I. Temporal Axis – Strategic Interval – (1H):
▦ EMA 9 – ($107,799.64):
∴ The 9-period EMA remains above the current price, signaling downward rejection from short-term momentum line;
∴ It recently crossed below the EMA21, reinforcing a weakening of bullish impulse.
✴ Conclusion: EMA9 now acts as intraday resistance, confirming that immediate market strength has decayed and volatility expansion may continue unless reclaimed.
⊢
▦ EMA 21 – ($107,861.93):
∴ EMA21 is sharply curved downward, validating loss of directional conviction from the previous bullish run;
∴ This level aligns with a former consolidation zone, now potentially serving as a resistance pivot.
✴ Conclusion: EMA21 confirms a short-term trend break, and the inability to reclaim this line would prolong corrective action.
⊢
▦ EMA 50 – ($107,703.87):
∴ The EMA50 was breached decisively in the previous candle cluster, now positioned above price;
∴ Slope is turning neutral-to-down, reflecting a transition from trend to turbulence.
✴ Conclusion: EMA50 shift implies structural vulnerability in the intermediate frame, amplifying bearish tactical weight if no recovery emerges swiftly.
⊢
▦ SMA 100 – ($107,007.08):
∴ SMA100 is currently positioned just below price, offering momentary support in case of further weakness;
∴ Horizontal alignment indicates a pause or inflection zone, lacking directional strength.
✴ Conclusion: SMA100 is a neutral-bullish support shelf, but could flip to active resistance if breached intraday.
⊢
▦ SMA 200 – ($105,890.26):
∴ The SMA200 remains firmly upward-sloping and untouched — a sign of medium-trend resilience.
∴ It defines the lower structural boundary for this time-frame.
✴ Conclusion: SMA200 still holds bullish structural integrity, but if reached, it would represent a full reversion of recent strength.
⊢
▦ Volume + EMA 21 – (Current Vol: 5.31 BTC):
∴ Volume shows an uptick during bearish candle clusters — indicative of active sell-side participation;
∴ The EMA21 on volume reveals a rising slope, confirming that volatility is not passive, but driven by conviction.
✴ Conclusion: Volume action supports the thesis of deliberate distribution, not merely rotational choppiness.
⊢
▦ VWAP (Session) – ($107,995.35):
∴ Price has broken decisively below VWAP, showing institutional disengagement or absence of bid reinforcement;
∴ VWAP now serves as magnetic resistance during any mean-reversion attempts.
✴ Conclusion: VWAP position confirms that price is under fair-value, and current path is dominated by tactical sellers.
⊢
▦ Bollinger Bands – (Lower Band: $107,007.08):
∴ Bands have widened, with price hugging the lower edge - a hallmark of volatility expansion;
∴ Mean price ($107,895.00) sits significantly above spot, reinforcing downside pressure.
✴ Conclusion: BB's suggest momentum breakdown, with price entering statistically stretched, yet uncorrected territory.
⊢
▦ RSI + EMA 9 – (RSI: 87.06 | EMA: 92.92):
∴ RSI has sharply fallen from extreme overbought, but remains above the 70-level — reflecting ongoing exit from euphoric levels;
∴ The EMA over RSI is crossing below, signaling loss of short-term strength and potential trend reversal.
✴ Conclusion: RSI behavior implies a momentum peak has passed, though correction may still be in early phase.
⊢
▦ MACD – (MACD: 1.87 | Signal: -99.46 | Histogram: 101.33):
∴ MACD histogram turned sharply positive following a steep drop, suggesting a potential pause in bearish acceleration;
∴ Lines are converging but remain well below the zero axis - no bullish crossover yet.
✴ Conclusion: MACD reflects oversold relief, but not reversal. Current state favors tactical caution rather than confidence.
⊢
▦ ATR (14, RMA) – (315.31):
∴ ATR remains elevated, confirming ongoing high volatility and larger-than-average candle bodies;
∴ This level sustains a risk zone scenario, where price swings may be unpredictable.
✴ Conclusion: ATR indicates volatility expansion persists, further validating the need for defensive tactical posture.
⊢
🜎 Strategic Insight – Technical Oracle:
∴ The technical constellation on the 1H chart reveals a clear breakdown of short-term bullish structure, now transitioning into a tactically bearish phase;
∴ The rejection from VWAP and convergence of all EMA's above price confirm that any recovery must reclaim the 107.800–108.000 cluster to negate downside bias;
∴ The current support rests on SMA100, yet its flat orientation and proximity to price suggest fragility, not strength. Meanwhile, SMA200 at 105.890 represents a more significant structural floor - its breach would mark a deeper tactical deterioration;
∴ Volatility metrics (BB and ATR) indicate that the market is no longer coiled - it has entered expansion, and directional bias is momentarily controlled by sellers. RSI exiting overbought and MACD’s unresolved negative zone further support the thesis of ongoing correction, not mere pause;
✴ Conclusion: In essence, the market has shifted into a correctional pulse, guided by structural breakdowns and expanding volatility. Tactical recoveries remain possible, but fragile and likely limited unless EMA's are reclaimed with force.
⊢
∫ II. On-Chain Intelligence – (Source: CryptoQuant):
▦ Exchange Netflow Total – (All Exchanges) – (Last Recorded: +2.1K BTC):
∴ Recent spike in netflow reveals a sudden influx of Bitcoin into centralized exchanges, marking the first positive divergence after a long series of outflows;
∴ Such inflows historically precede tactical distribution events or profit-taking phases, especially following extended rallies.
✴ Conclusion: Netflow confirms that holders are actively preparing to sell, giving real on-chain weight to the price rejection seen on the 1H chart.
⊢
▦ Short-Term Holder SOPR – (Latest Value: 1.012):
∴ SOPR sits slightly above 1.0, but descending - indicating a transition from profit realization to potential break-even or loss selling;
∴ If the trend continues and dips below 1.0, it marks capitulation from recent buyers — often a trigger for volatility spikes or local bottoms.
✴ Conclusion: Current STH SOPR signals weakening conviction among short-term holders, supporting a corrective narrative rather than trend continuation.
⊢
🜎 Strategic Insight – On-Chain Oracle:
∴ The on-chain substrate aligns precisely with the tactical weakness shown in the chart. The positive exchange netflow acts as a material indicator of sell-side readiness;
∴ This inflow, breaking the historical trend of outflows, marks a shift in intent - from holding to liquidation;
∴ Simultaneously, the Short-Term Holder SOPR sits on a critical edge. Its descent toward the 1.0 threshold implies that recent buyers are either approaching breakeven or beginning to capitulate;
∴ This fragile posture typically amplifies local corrections, especially when coupled with rising volatility;
∴ On-chain momentum no longer supports bullish continuation. Instead, it reflects hesitation, rotation, and distribution - all hallmarks of a short-term correction phase, in alignment with the temporal analysis;
✴ Conclusion: The on-chain field confirms that the technical breakdown is not speculative - it is supported by active internal dynamics, signaling a pause or reversal in trend strength at a structural level.
⊢
⧈ Codicillus Silentii – Strategic Note:
∴ The current H1 formation is a textbook example of post-euphoric fragility. What appeared as steady accumulation has now transitioned into a volatile de-leveraging phase. The confluence of bearish momentum, increased volume, and netflow reversal suggests the market is entering a tactical contraction zone;
∴ No structural collapse is yet confirmed - but the absence of bullish defense at VWAP and EMA clusters denotes reduced resilience. Until these are reclaimed, all attempts at recovery must be viewed with caution.
✴ Conclusion: Silence in structure signals preparation - not passivity. The next move shall emerge not from noise, but from the void left by exhaustion.
⊢
𓂀 Stoic-Structural Interpretation:
∴ Structurally Bearish – Tactically Suspended ;
∴ The 1H chart shows a break below short-term momentum zones (EMA's, VWAP), confirming structural fragility;
∴ Despite momentary support on SMA100, the loss of upward slope across the EMA's and RSI reversal validate a structural bearish bias;
✴ Conclusion: Tactical direction remains suspended until one of two pivots is breached: either VWAP (~107.995) reclaimed, or SMA200 (~105.890) broken.
⊢
⧉
⚜️ Magister Arcanvm – Vox Primordialis!
𓂀 Wisdom begins in silence. Precision unfolds in strategy.
⧉
⊢

BTCUSD 6/30/2025Come Tap into the mind of SnipeGoat, as he gives you ANOTHER update, to ANOTHER successful call-out, with ANOTHER Top-Down Analysis.
_SnipeGoat_
_TheeCandleReadingGURU_
#PriceAction #MarketStructure #TechnicalAnalysis #Bearish #Bullish #Bitcoin #Crypto #BTCUSD #Forex #NakedChartReader #ZEROindicators #PreciseLevels #ProperTiming #PerfectDirection #ScalpingTrader #IntradayTrader #DayTrader #SwingTrader #PositionalTrader #HighLevelTrader #MambaMentality #GodMode #UltraInstinct #TheeBibleStrategy

Bitcoin - Will Bitcoin Hit a New ATH?!Bitcoin is trading above the 50- and 200-EMAs on the four-hour time frame and is within its short-term descending channel. Bitcoin can be bought from the demand zone indicated. A break of the channel ceiling would pave the way for Bitcoin to rise to a new ATH.
It should be noted that there is a possibility of heavy fluctuations and shadows due to the movement of whales in the market and compliance with capital management in the cryptocurrency market will be more important. If the downward trend continues, we can buy within the demand range.
In recent days, Bitcoin has been trading in a range of around $107,000, and the market is going through a consolidation phase with complex but deeply fundamental characteristics. What matters at this point is not just the current price, but the precise mix of capital flows, the behavior of major players, on-chain data, and macroeconomic ratios that shape Bitcoin’s short- and medium-term trajectory. Overall, although Bitcoin’s rapid growth after the halving has stopped, internal market signals point to a continuation of the upward trajectory in a more stable framework.
The first important component is the significant influx of institutional capital into the market via ETFs. In the past week, according to CoinShares, more than $1.24 billion in new capital entered crypto products, with Bitcoin accounting for more than $1.1 billion. This marks the 10th consecutive week of capital inflows into the market, bringing the total inflows for 2025 to over $15 billion. Prominent ETFs such as BlackRock’s IBIT and Fidelity’s FBTC are attracting hundreds of Bitcoins per day, indicating steady institutional demand that has weathered the momentary volatility and is more focused on long-term asset building.
Alongside this capital inflow, the Onchain data also paints a mixed but highly interpretable picture. While the average active address rate has declined slightly and the MVRV (market value to realized value) has fallen from 2.29 to 2.20, these changes are more indicative of profit-taking by investors than selling pressure! In fact, rather than fear of a correction or crash, the market is witnessing a “gentle shift of ownership” between short-term and long-term holders. UTXO data also shows a roughly 5% increase in Bitcoin held for over 8 years, a strong sign of long-term accumulation and a decrease in the willingness to sell at current prices!
This can be seen as a period of supply and demand equilibrium; a period in which large investors have entered, but on the other hand, some older players are taking reasonable profits. This has led to a kind of price consolidation, which in June showed itself with only 2% growth—the weakest monthly growth since July last year. However, CoinDesk and Glassnode analysts rightly emphasize that this consolidation is not a sign of market weakness, but rather evidence of the maturity of Bitcoin’s price behavior. The price is reacting to data rather than becoming emotional.
From a macroeconomic perspective, Bitcoin remains highly sensitive to the Federal Reserve’s monetary policy, the value of the dollar, and interest rates. While the market is still waiting for interest rate cuts in the second half of the year, Bitcoin will remain in a quasi-expectant state until then, reacting to macro data, short-term and reactive. However, given that most ETFs follow long-term accumulation models, any stabilization in interest rates or easing geopolitical pressures could trigger a new wave of upside. Common analyst scenarios predict a range of $120,000-$130,000 for Bitcoin by the end of the summer if current conditions are maintained and capital inflows continue. In summary, Bitcoin is now at a stage where the dynamic combination of institutional accumulation, supply and demand balance, and on-chain data has transformed it from a purely risky asset into a strategic investment vehicle. The market has moved beyond the emotional phase and entered a phase of stability and maturity. This is a promising sign for long-term investors, provided that risk management is maintained and sensitivity to macro events is maintained. Bitcoin is preparing for the next stage of its rally—but unlike in the past, this time it is standing on the shoulders of fundamentals that are much stronger than at any time in the asset’s history.
ETFs with the most volume traded on Friday
Total: $501M
BlackRock: $153M
Fidelity: $165M
Grayscale: $0M

See you in 2029!Maybe this is my last analysis after my long journey in Bitcoin.
Thank you and see you in 2029, I will be back after 20th Bitcoin journey.

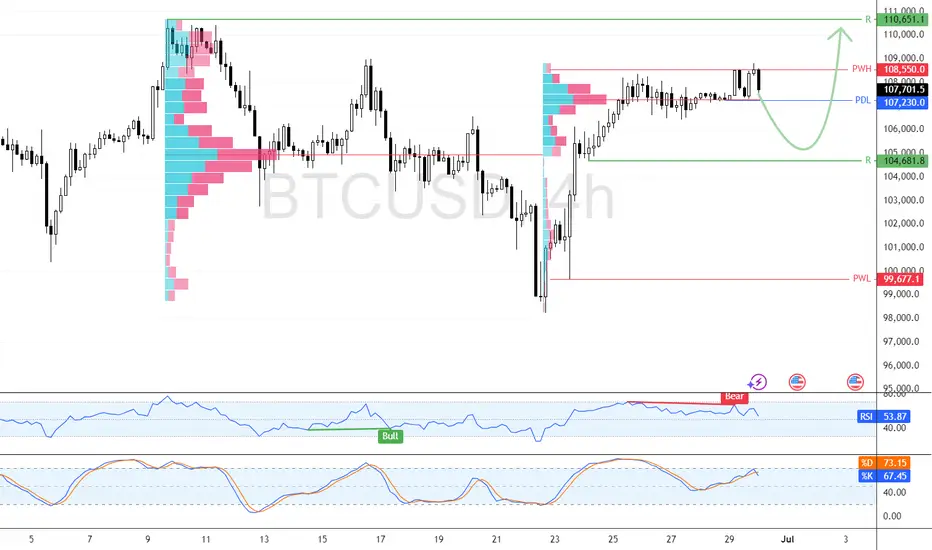
Bitcoin Eyes $110K Target Above Key Support LevelBitcoin trades slightly below last week’s high near $107,660.0, while RSI 14 shows bearish divergence without a clear downward move.
Immediate support is at $107,230.0, and resistance at $108,550.0. If BTC closes above resistance, a rally toward $110,651.0 may follow. The bullish outlook remains valid as long as the price stays above $104,681.0.
Market Manipulators Work Together to Exploit Hope | BM Is Over Iran–Israel Tensions Rising Again | A Hidden Gem for Traders
The conflict between Iran and Israel is heating up once again, and things are far from settled. Behind the scenes, there are signs that Iran may restart its nuclear weapons program, which could trigger a serious reaction — not just from Israel, but also from Western countries and nearby Arab nations.
If this conflict turns into a wider war, we could see major global impacts, including:
Rising oil prices due to tensions in the Middle East
Increased defense spending and movement in military-related stocks
Volatility in gold, USD, and crypto markets as investors seek safety
📉 While the world is watching quietly, this is actually a hidden signal for smart traders. The media might not be talking loudly about it yet, but war risk is building — and when it explodes into headlines, markets could react fast and hard.
🧠 Smart Traders Know:
Geopolitical tension = market moves
Fear fuels gold, oil, and crypto spikes
Nuclear headlines could shift investor psychology overnight

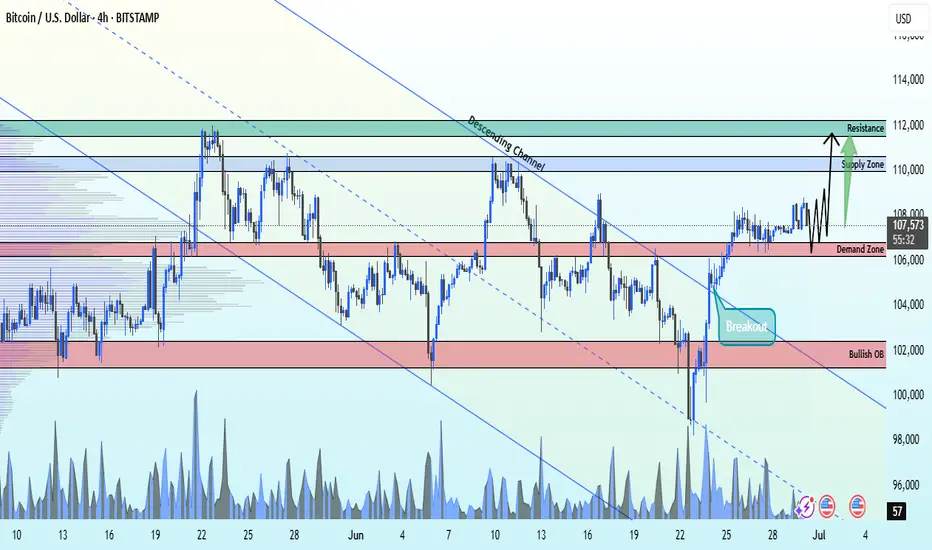
BITCOIN Breakout From Ascending Channel bullish from demand ZoneBTCUSD Breakout Alert
Bitcoin has officially broken out of the descending channel on the 4H timeframe, signaling a potential bullish reversal from the key demand zone at 106,100.
🎯 Technical Targets:
1st Target: 110,000 – Major supply zone
2nd Target: 112,000 – Strong resistance level
🔒 Stop Loss: 103,000 – Below bullish order block for risk protection
This setup offers a clean R:R with strong confluence. Watch for continuation above 108K for confirmation.
📊 TA only – always manage your risk!
🔥 Like, follow, & comment to stay ahead with more real-time updates!
#BTC #CryptoTrading #PriceAction #BitcoinAnalysis #LiviaTrades 😜
BTCUSD📉 The Setup: Bearish Divergence on BTCUSD (1H/15m/30m)
🔍 Observation:
On the 1 Hour chart, Bitcoin
🧠 Meaning: The Buying pressure is weakening, and a breakdown might be near!
Entry SL TP shared in chart

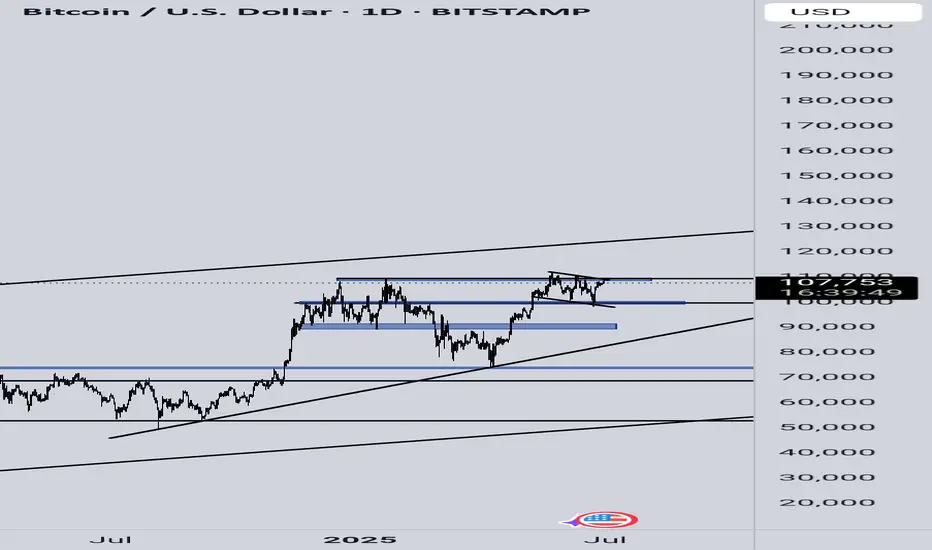
BTCUSD-Breakout Loading – Massive Opportunity Ahead!BTC is consolidating within a major structure for 224+ days. Current price action is forming a bull flag, signaling strong potential for a breakout toward $120,000–$150,000. Short-term volatility expected, but long-term trend remains bullish.
🔸 Support at $90,000–$93,000:
Strong confluence in this region including CME gap, liquidity pools, and previous structure support. Rejection from $113K could trigger a flush into this zone. Long setups should be considered here. Whales are accumulating.
🔸 Upside Target: $120,000 – $150,000
Long-term breakout from consolidation range aligning with historical accumulation patterns and macro indicators like M2 lag. Break of $113K with strength opens doors to $120K+. Clean structure with confirmed support will fuel rally continuation.
🔸 Risk Level at $88,000:
If BTC breaks below $88K with volume and closes under structure, it would invalidate the bull flag scenario short-term and signal deeper correction.
🔸 Outlook:
Monitor price reaction near $113K. Prepare for fakeout and potential sweep into $90K–$93K zone. Place laddered long orders in that range for optimal R:R. If dip occurs, treat it as a gift entry. No bearish outlook unless macro conditions shift drastically. Momentum remains upward.

Traders Gurus always wrong at the crucial pointWhy are trading gurus often wrong at market tops or bottoms?
I recently received an email from the B*itcoin L… channel (where people like P.L. Brandt, Loukas, etc. are members), and it said the following:
The next installment of the 4-Year Cycle.
Exploring the powerful bullish case for Bitcoin, driven by a perfect storm of narratives: institutional adoption, regulatory clarity, and cycle timing. From ETF inflows and corporate treasuries to a pro-crypto U.S. administration, potential interest rate cuts, and surging legitimacy post-halving — signs point to a possible super cycle unfolding.
But honestly, if you know how to read a BTC chart, where exactly do you see a “powerful bullish case for Bitcoin”? Tons of indicators suggest the opposite — even BTC Dominance (BTC.D) doesn’t confirm it.
Wasn’t the move from $16K to $110K already the bullish case?
Based on what I’m seeing in the charts, BTC is likely to cool off for a year, maybe even two. I expect it to come down to at least $50K–$65K before making any significant move upward again. We haven’t even had a proper flash crash yet, which is surprising given everything that’s been going on in the world over the past few months. Something fishy is going on.

BITCOIN NEXTKind of a Messy coorective Structure, this is What I can see right now with the movemments it has done
YIf you lower the time frame you should see the complete map also levels are Highlighted
It should go as follows
Buy from now @ 107.600 to 108.500
Sell from @ 108.500 to 105.000
buy from @ 105.000 to 111.000
Sell from @ 111.000 to 96.000
Buy from @ 96.000/ 94.000 to 120.000 and 130.000
GG
here is the #chart #btc $bitcoin
Cautiously bullish. Bitcoin is trading at $107,983.70, up 6% from last week but 3% below its all-time high of $111,891.30 (May 22, 2025). Technicals show a strong buy signal with the 50-day and 200-day moving averages supporting an upward trend. Posts on X suggest a weekly close above resistance ($108k) could push BTC to new highs ($112k-$120k). However, bearish divergence on weekly charts and tariff-related volatility introduce risks. Pro-crypto policies and Fed rate cut expectations bolster optimism, but a potential pullback to $100,400 support looms if momentum fades.

BITCOIN/USD "Eyes $112K target!"Key facts today! 1). Bitcoin is trading over $107,000, with analysts eyeing a potential all-time high above $112,000. Bulls are holding prices above $105,000 amid easing inflation and institutional buying.
2). Investor Dan Tapiero predicts Bitcoin could hit $180,000, highlighting the need to break the $115,000 resistance level for strong upward momentum.

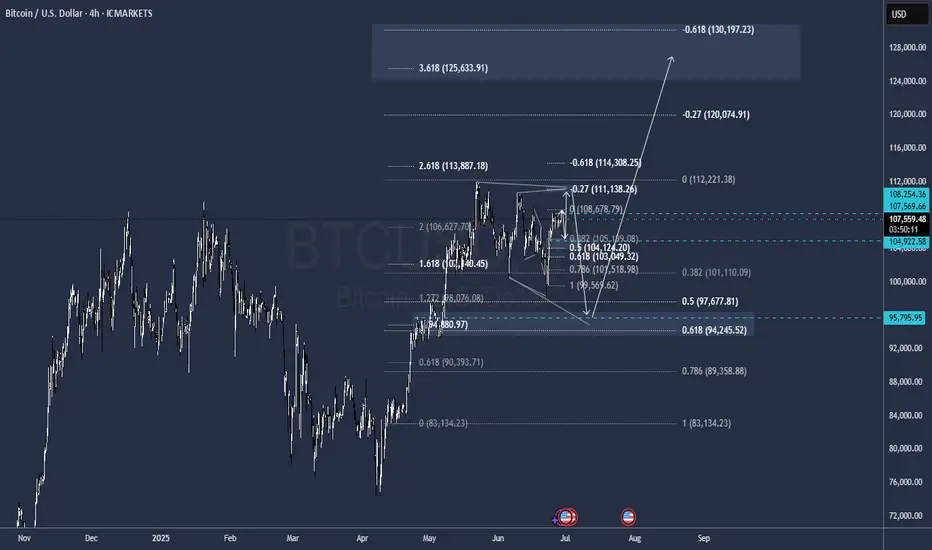
My Fav BTC Scenario Deep CrabThis is my favorite BTC htf scenario. Deep crab to 120kish with likely deviation above, potentially cycle ending.
If BTC rejects at that .786 then we have a butterfly to 115k

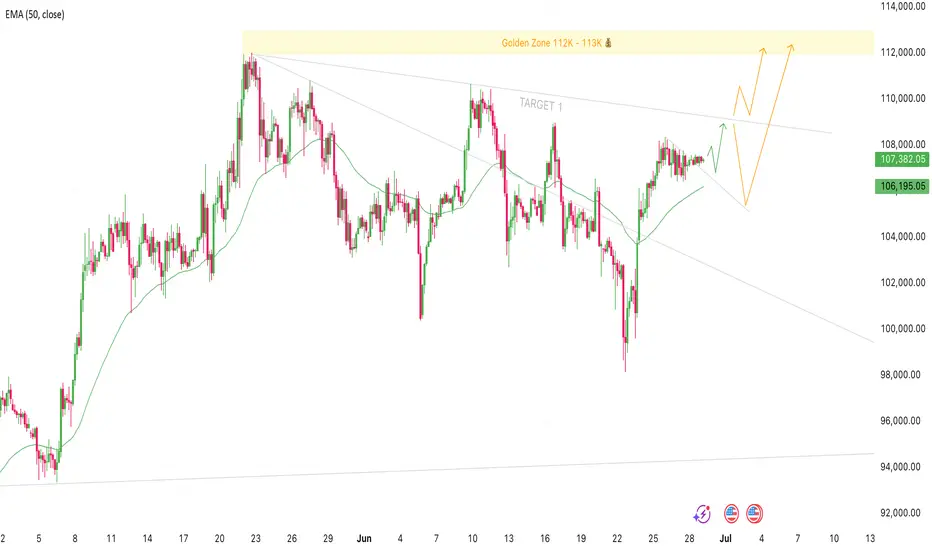
Bitcoin Setup for 109K and New Highs Could Be NextTrade Idea:
Direction: long
Entry: Now 107,350 - 106,800
Stop Loss: 102,000
Target 1: 109,000
Golden Zone: 112,000 - 113,000
Bitcoin has been consolidating for the last four days with no real price increase, but we’ve still managed to break above the short-term descending trend line. This could signal a continuation of the current swing up to the next resistance around 109K, which lines up with the daily trend line.
My bias here is that once we hit that 109K area, we could either see a pullback to around 104 to 106K before pushing higher, or we might break straight through, retest the trendline, and continue quickly to new highs above 112K.
I’ll be watching closely to see how price reacts around 109K, whether it rejects or breaks through. Either way the structure remains bullish, and if we get a rejection I'll be looking to re-enter.
Let's see how this plays out ✌️
BTCUSD Trade Setup - 28/Jun/2025Hi Traders,
I expect this pair to go Down after finishing the correction.
1) Need to wait for market to show changing of the direction.
2) The first reaction zone foe me will be at 95000 level followed by 89000 level.
3) Need to observe the characteristic of the move coming down in order to understand if market is planning to go up without coming to those levels.
Current expectation for investing is to see market dropping to 89000 level and then start to look for entry.
I only invest in BTC so no shorts for me but market shows potential to give a reversal soon and give a decent down move.

BTC Dominance and the “Double Top” Pattern🧠 BTC Dominance and the “Double Top” Pattern
1. What is a “Double Top” in BTC Dominance?
A Double Top is a bearish chart pattern formed by two peaks near the same resistance level. If the price (or dominance in this case) breaks below the neckline (middle support), it signals a potential trend reversal from bullish to bearish.
⸻
2. Is BTC Dominance forming a Double Top?
• Analysts suggest BTC dominance may be forming a double top, with two highs near the same level.
• However, it hasn’t confirmed yet. A breakdown below the neckline would confirm the reversal.
• If confirmed, this suggests that capital may start flowing from Bitcoin into altcoins.
⸻
3. What Does It Mean?
• If the Double Top is confirmed (dominance drops) → Bitcoin loses market share → capital flows to altcoins → possible start of a new Altseason.
• If dominance holds or increases → Bitcoin remains the market’s safe haven → altcoins may remain weak.
⸻
4. Current Context & Outlook
• BTC Dominance is now near 64%, a multi-year high, largely driven by institutional interest and Bitcoin ETFs.
• Historically, such highs are followed by rotations into altcoins, especially when traders seek higher returns.
• A confirmed drop in dominance might trigger runs in altcoins like ETH, SOL, or meme coins.

Playoff between down trend channel and up trend support in BTCThis is the situation Bitcoin finds itself in. On the one hand there is a strong downtrend channel which we keep getting thrown into, but on the other hand there is uptrend support that we also keep being bounced back into. We're currently in the confluence of both of these features, so shits about to get real.

Prediction for BitcoinThis is how I envision bitcoin moving based on current market events and the geopolitical situation.

BTC 120k is on about to come.- BTC retest 0.3 fib and 13 ema W with perfection.
- Stoch W is about to cross.
- MACD W is about to push upward.
- No war fud.
- Big players keep buying BTC.
- Rate cut still on the table, just a matter of time.
- Tariff soon will be settled.
Possible august 120k ?
