BTC 120k is on about to come.- BTC retest 0.3 fib and 13 ema W with perfection.
- Stoch W is about to cross.
- MACD W is about to push upward.
- No war fud.
- Big players keep buying BTC.
- Rate cut still on the table, just a matter of time.
- Tariff soon will be settled.
Possible august 120k ?
BITCOIN trade ideas


Bitcoin(BTC/USD) Daily Chart Analysis For Week of June 27, 2025Technical Analysis and Outlook:
Throughout this week’s trading session, Bitcoin has demonstrated an upward trajectory and is positioned to achieve the specified targets of Mean Resistance 110300 and Key Resistance 111700. This progression may ultimately culminate in the realization of the Outer Coin Rally 114500 and beyond. Nevertheless, it is crucial to recognize the possibility of a subsequent decline from the current price to the Mean Support level of 104900 before a definitive upward rebound.

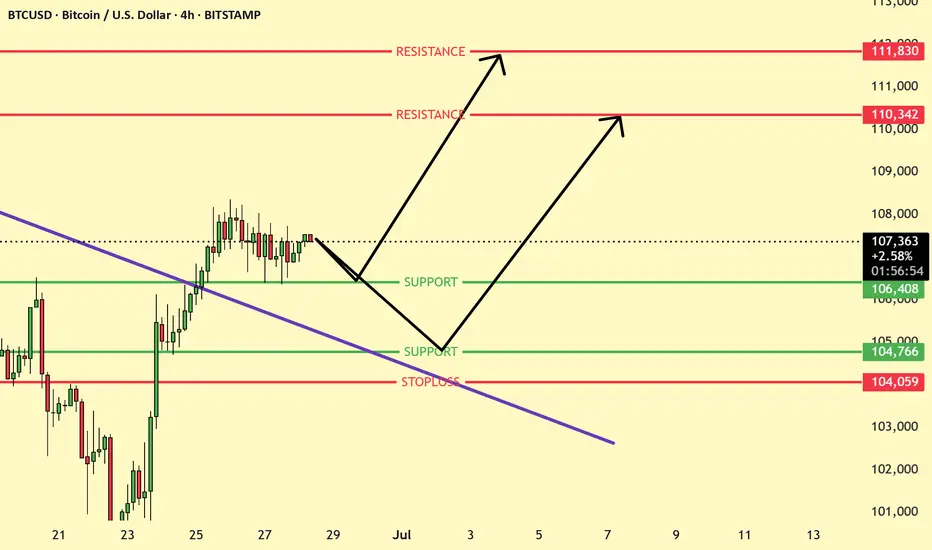
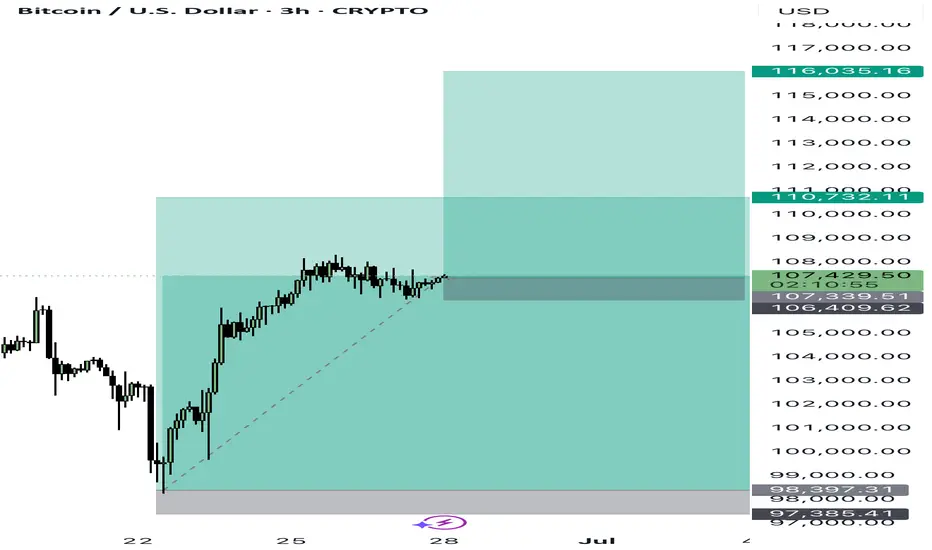
BTCUSD Set up Ready for LongBTCUSD is consolidating around 107,372 after a breakout. Two bullish scenarios are shown: a bounce from 106,408 or a deeper pullback to 104,766 before rallying. Key resistances lie at 110,342 and 111,830. Bullish bias holds as long as price stays above 104,059.
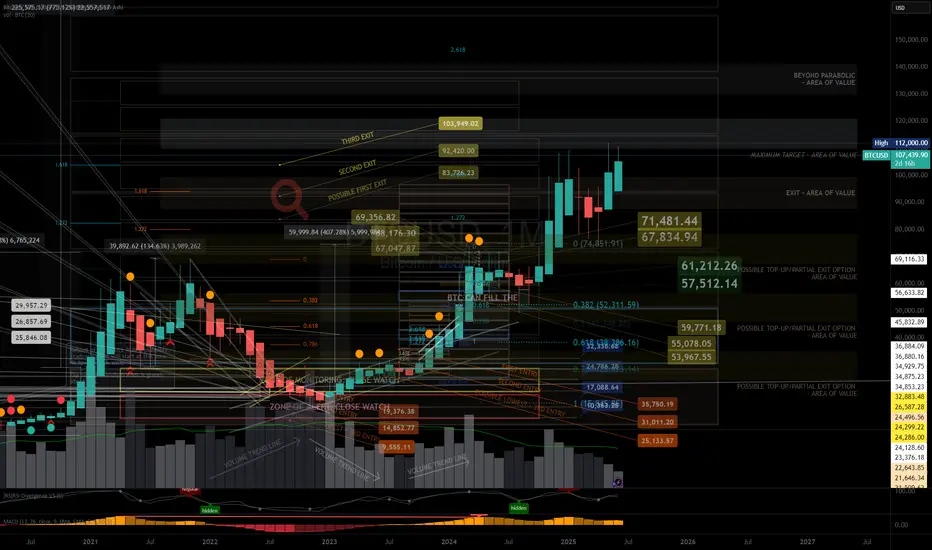
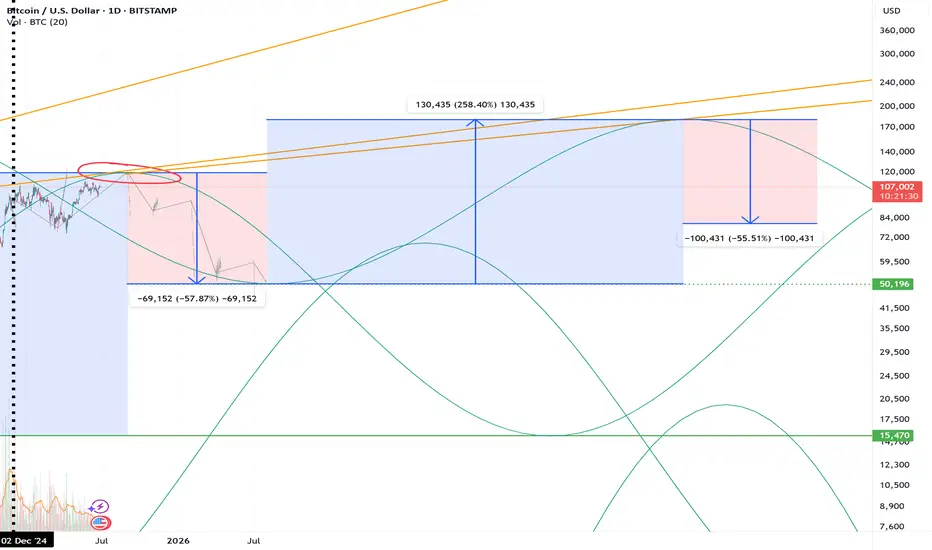
BTC Bento Box Analysis 6.28.25So far so good, I am back after 2 years of hibernation (been studying forex charts.) My analysis remains true to what BTC has done for the past 2 years. So much to learn in analyzing charts from crypto to forex to blue chips.
Again, we follow the tops and bottoms of the boxes. Minor and major boxes will suggest major and minor high and low reversals.
In a couple of weeks, i will study the charts and draw new Bento boxes for a year or two predictions as to where the most probable BTC ATH and ATL will take us to a new level.
Get ready to open buy/sell positions in the months to come.
Bitcoin uptrend breakBitcoin uptrend break probably monday since nasdaq etc is at ath bitcoin follows and tops out in september

BTC/USD: Breakout Watch - short setup BTC/USD 15-min: Watching for a potential long opportunity. Price is pressing against a key descending trendline, with recent internal 'bos' and 'ChoCh' indicating a shift in momentum.
Plan:
* Entry: Targeting a retest around 107,509 after a confirmed trendline breakout.
* Target: 108,971
* Stop Loss: 106,885
Risk management is key! What are your thoughts?

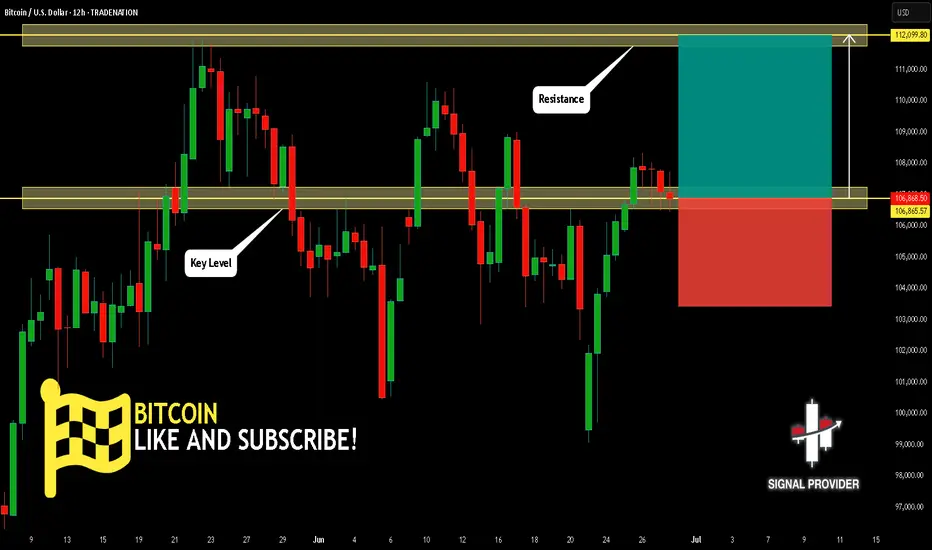
BITCOIN Is Bullish! Buy!
Here is our detailed technical review for BITCOIN.
Time Frame: 12h
Current Trend: Bullish
Sentiment: Oversold (based on 7-period RSI)
Forecast: Bullish
The market is approaching a significant support area 106,865.57.
The underlined horizontal cluster clearly indicates a highly probable bullish movement with target 112,099.80 level.
P.S
Overbought describes a period of time where there has been a significant and consistent upward move in price over a period of time without much pullback.
Disclosure: I am part of Trade Nation's Influencer program and receive a monthly fee for using their TradingView charts in my analysis.
Like and subscribe and comment my ideas if you enjoy them!
BTCUSD Buy Market Entry 107450-350 SL:106400BTCUSD
BUY By Market
Entry: 107500-107350
Sl: 106400
Tp1: 110000
Tp2: 116000
1% risk
BTCUSD is ranging in narrow zone alighning broad equiti marketBTCUSD is ranging in narrow zone alighning broad equiti market

Bitcoin Structurally Momentum Bullish – On-Chain Confirmed.⊢
⟁ BTC/USD – BINANCE – (CHART: 4H) – (June 27, 2025).
⟐ Analysis Price: $106,840.15.
⊢
⨀ I. Temporal Axis – Strategic Interval – (4H):
▦ EMA(9) – ($107,126.95):
∴ Current price is slightly below the EMA(9), indicating the beginning of intraday buyer fatigue;
∴ EMA(9) still curves upward, sustaining the recent bullish momentum, but showing signs of deceleration.
✴️ Conclusion: Short-term strength is weakening; potential micro-shift in sentiment underway.
⊢
▦ EMA(21) – ($106,574.03):
∴ EMA(21) acts as immediate dynamic support, now closely tested;
∴ Still sloping upward, suggesting buyers are attempting to defend the structure.
✴️ Conclusion: Tactical support remains intact - this is the battlefield line.
⊢
▦ EMA(50) – ($105,651.25):
∴ Mid-range structure confirms trend stability as price remains well above the EMA(50);
∴ EMA(50) direction remains mildly bullish, reinforcing medium-term control by buyers.
✴️ Conclusion: Medium trend unshaken; pullbacks remain controlled within bullish context.
⊢
▦ EMA(200) – ($104,890.51):
∴ Long-term baseline remains untouched, with price notably above;
∴ The slope of EMA(200) is stable and slightly positive.
✴️ Conclusion: Structural bullish foundation remains intact. No long-term threat detected.
⊢
▦ Ichimoku Cloud (9/26/52/26):
∴ Price remains above the Kumo cloud; Tenkan and Kijun are aligned in bullish formation, though beginning to flatten;
∴ Chikou Span remains free and clear above historical price — no conflict.
✴️ Conclusion: Structure is still bullish, but compression in the cloud signals potential pause in directional conviction.
⊢
▦ Volume (BTC) + MA(21):
∴ Volume sits below its 21-period moving average, indicating waning buyer participation;
∴ No breakout or capitulation candle - sentiment is reserved.
✴️ Conclusion: Lack of conviction - volume confirms indecision and pause in impulse.
⊢
▦ RSI + EMA9 – (RSI: 54.78 / EMA9: 59.70):
∴ RSI curves downward from the upper-neutral zone - momentum is retreating;
∴ RSI has crossed below its EMA(9), which typically signals fading bullish strength.
✴️ Conclusion: Momentum has weakened - buyers are hesitating.
⊢
▦ Stoch RSI – (K: 9.72 / D: 10.22):
∴ Oscillator is deep in the oversold region, preparing a bullish cross;
∴ No confirmation of reversal yet - early signal.
✴️ Conclusion: Setup for potential rebound exists, but signal remains unconfirmed.
⊢
▦ MACD – (MACD: 725.17 / Signal: 883.72 / Histogram: –158.55):
∴ MACD histogram turns increasingly negative, suggesting decay in momentum;
∴ Though MACD line remains above signal, curvature favors a bearish crossover soon.
✴️ Conclusion: Momentum fading; risk of technical crossover if weakness persists.
⊢
▦ OBV – (71.13M):
∴ OBV is flat and shows no divergence, suggesting balanced pressure;
∴ Movement remains parallel to EMA21, confirming neutrality.
✴️ Conclusion: Volume flow is not supporting a continuation; neutral.
⊢
🜎 Strategic Insight – Technical Oracle:
∴The structure remains bullish at the macro and medium levels;
∴ As evidenced by EMA alignment and Ichimoku posture. However, momentum signals are fading, and the current 4H candle lacks conviction;
∴ A breakout requires stronger volume and RSI reacceleration - until then, the tactical stance is suspended.
⊢
∫ II. On-Chain Intelligence – (CryptoQuant):
▦ 1. Exchange Netflow Total – (All Exchanges):
∴ Current readings show net outflows dominating, indicating coins moving out of exchanges - typically interpreted as holding behavior and bullish bias;
∴ No recent spike in inflows that would suggest imminent selling pressure or dump risk.
✴️ Conclusion: Exchange behavior is structurally bullish - environment favors accumulation.
⊢
▦ 2. Exchange Stablecoins Ratio – (All Exchanges):
∴ The ratio remains low and stable, meaning high stablecoin reserves vs. Bitcoin on exchanges - suggesting potential buying power in standby;
∴ No spike in the ratio - no immediate conversion from stablecoins into Bitcoin.
✴️ Conclusion: Stablecoins on standby confirm latent demand - supportive for bullish continuity if triggered.
⊢
▦ 3. Funding Rates – (All Exchanges):
∴ Funding is positive but mild, indicating long interest, yet not overheated;
∴ No excessive leverage detected - absence of speculative imbalance.
✴️ Conclusion: Derivatives market supports a healthy uptrend with no signs of crowd euphoria.
⊢
▦ 4. Estimated Leverage Ratio – (All Exchanges):
∴ Leverage ratio remains within neutral bounds, not expanding aggressively;
∴ Suggests market is currently not dominated by overleveraged positions.
✴️ Conclusion: The structure is stable - no systemic risk from forced liquidations.
⊢
▦ 5. Taker Buy/Sell Ratio – (All Exchanges):
∴ The ratio is slightly above 1.0 - meaning more aggressive buying than selling, but without dominance;
∴ Reinforces sentiment of cautious buying, not yet euphoric.
✴️ Conclusion: Taker flow confirms moderate bullish sentiment, no reversal pressure.
⊢
🜎 Strategic Insight – On-Chain Oracle:
∴ On-chain metrics align with structural bullishness;
∴ Netflows, leverage, and taker activity all support continuation;
∴ Importantly, stablecoin ratios signal dry powder remains available, meaning the market holds the potential energy for further upside - if volume and technical confirmation align.
⊢
⧈ Codicillus Silentii Strategic Note:
∴ In the discipline of silence, one waits as price tests its dynamic zone. The wise act after structure, not inside uncertainty;
∴ The chain speaks in whispers. Smart liquidity waits. The structure is armed - but momentum requires ignition. Not fear, not hope - signal.
⊢
𓂀 Stoic-Structural Interpretation:
∴ Structurally Bullish - (Tactically Suspended);
∴ The core architecture remains intact, but the absence of volume and declining oscillators justify a suspended stance for entry;
∴ On-chain and chart-based structures are aligned in bullish posture, but technical indicators remain in a suspended tactical phase. Awaiting breakout or deeper pullback for positioning.
⊢
▦ Tactical Range Caution:
∴ Watch $106,574 (EMA21) and $105,651 (EMA50) for reactive buying;
∴ Below $104,890 (EMA200) - structure weakens;
∴ Upside breakout requires volume reclaim above $107,330;
∴ Resistance: $107,330 / $108,200.
⊢
⧉
⚜️ Magister Arcanvm (𝟙⟠) – Vox Primordialis!
𓂀 Wisdom begins in silence. Precision unfolds in strategy.
⧉
⊢

Only all market sellllll This market is just liquidating and scares you into shorting, and suddenly it drops terribly, so if you have a short trade, hold until the first target is 75,000 and the second target is 39,000.😜😜😜😜😜

Bitcoin ready for big sell This market is just liquidating and scares you into shorting, and suddenly it drops terribly, so if you have a short trade, hold until the first target is 75,000 and the second target is 39,000.

Future idea: Bitcoin Valuation in 2030I've been thinking about how this and previous cycles seems to follow some general trends and my previous prediction is seemingly playing out pretty well. I'm hoping to look back in 5 years and be right.
BTCUSDTPrice action trading is a methodology in financial markets where traders make decisions based on the actual price movements of an asset over time, rather than relying heavily on technical indicators or fundamental analysis. It involves observing and interpreting patterns and trends in price charts to predict future price movements.

Bitcoin is bullish again!Bitcoin’s been on a wild ride lately!
After crashing down from its all-time highs earlier this year, it’s suddenly bounced back and shot up again over the last few weeks. Here’s what’s really going on, in plain English:
First off, a lot of this has to do with what’s happening in the broader economy and politics. The US dollar has gotten weaker recently, especially after Trump started criticizing the Federal Reserve and pushing for interest rate cuts.
When the dollar drops or there’s drama around central banks, people start looking for alternatives, and BITSTAMP:BTCUSD is like the go-to “digital gold” for a lot of investors these days.
There’s also been a ton of money flowing into Bitcoin ETFs (those are investment funds that directly hold Bitcoin), especially from big institutions like BlackRock and Fidelity. These huge inflows mean more demand, but since there’s only so much Bitcoin out there, the price gets pushed up even more.
Another big reason is the recent Bitcoin “halving,” which happened about a year ago. Basically, every four years, the reward for mining new Bitcoin gets cut in half, so fewer new coins are created. This makes Bitcoin even scarcer , and historically, prices have always jumped in the months after a halving event. As we said in previous ideas BTC could be near USD 200k this summer.
On top of that, there’s been some good news about trade relations between the US and China, which has made investors more optimistic and willing to take risks again. When people feel better about the global economy, they’re more likely to put money into things like crypto.
Technical confirmations
Bouncing in the previous 2024 highs is really good for Bitcoin, people was ready to buy a lot of BTC in the right price and after that a lot of inflows moved the price over the blue trendline meaning that this small downtrend is over.
Bitcoin is volatile, so this kind of movements are ideal to make money or invest in a discount. If the price moves below the support line, then I recommend to stay away of BTC because there could be a free fall...
So, to sum it up: weaker dollar, big institutional buying, post-halving scarcity, better vibes around global trade, and people running from stock market chaos—all of that has pushed Bitcoin back up after its recent dip. Who knows how long it’ll last, but right now, crypto’s hot again!

Btc top is near. The chart you don't want to see. Based on all the available data and previous pattern, I can conclude that another bullflag is forming. Top in 2-3 weeks. Wick towards 112-115k is the top.
I also believe we ll form another bull flag in few months.
Cycle cannot be over with btc dominance sky high.
Market makers are extracting maximum liquidity and btc from retails.
They scream cycle over at the end of bull flag to make retail sell everything. Then pump it again.
Just my opinion.
NFA#

A very high quality potential of double top pattern A very high quality potential of double top pattern
Neck line already broken , now retest is happened and rejection confirmed by wicks rejecting and the daily candle gonna close bearish for extra confirmation
Entry plan
Entry : 107,100 , up to 107550
Tp 1 102600
Tp 2 : 101, 250
Tp 3 : 99,666
Runners : from 98,500 to 94,000 maximum
SL 108,800
Wish the best for all traders
MG Trader ✅

BTCUSD - Liquidity Zone in Focus Ahead of Options ExpiryAnalyst: Mosilar
BTC is trading near $107K with a key liquidity zone around $108,300 – $108,800. Max Pain for tomorrow’s options expiry sits at $102K.
Historically, BTC often gravitates toward Max Pain into expiry. A potential fade from the liquidity zone toward $104K and $102K could be in play.
Key Levels:
Liquidity Zone: 108,300 – 108,800
Volume Profile: 104,000
Max Pain: 102,000

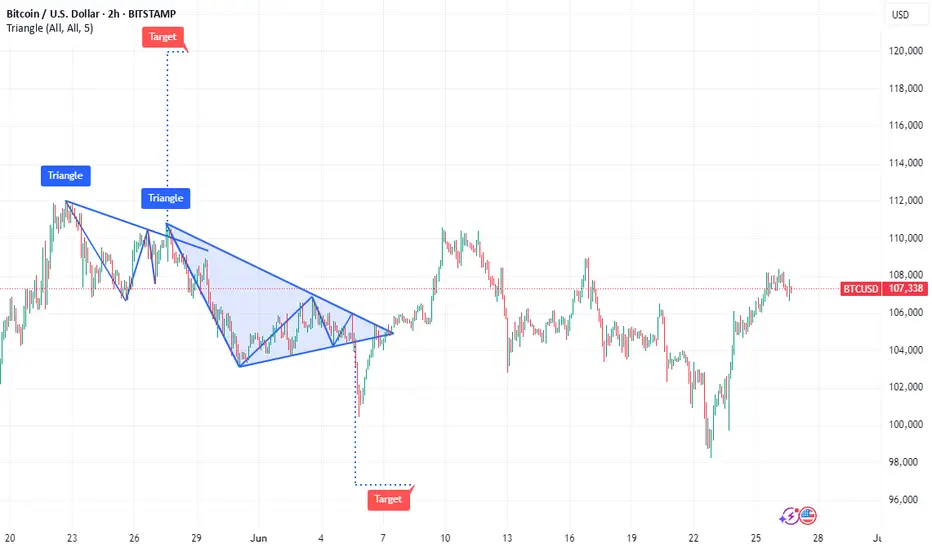
Bitcoin's Podium-Ready 'Bull Flag' Hints at Price Boom to $120KBitcoin's Podium-Ready 'Bull Flag' Hints at Price Boom to $120K
Bitcoin, the pioneering cryptocurrency that has redefined the financial landscape, continues to spark intense debate and fervent speculation about its future price trajectory. Amidst the sea of technical analyses and market predictions, a compelling pattern has emerged on Bitcoin's price chart: the 'bull flag.' This bullish continuation pattern, often seen as a precursor to significant upward price movements, has ignited excitement among Bitcoin proponents, fueling predictions of a potential surge to $120,000.
This article delves into the intricacies of the bull flag pattern, exploring its formation, characteristics, and implications for Bitcoin's price. We will analyze the current market conditions, considering the recent retreat from $108,000 and the overall sentiment of Bitcoin bulls. Furthermore, we will examine the factors that could either validate or invalidate the bull flag pattern, providing a nuanced perspective on the potential for Bitcoin to reach $120,000. By synthesizing these insights, we aim to offer a comprehensive overview of the technical and fundamental factors that could shape Bitcoin's price trajectory in the coming months.
Understanding the Bull Flag Pattern
The bull flag is a technical analysis pattern that signals a continuation of an existing uptrend. It is characterized by two distinct phases:
1. The Flagpole: This represents the initial strong upward movement in price. It is a sharp, almost vertical rally that establishes the overall bullish trend.
2. The Flag: This is a period of consolidation that follows the flagpole. The price moves sideways or slightly downwards, forming a rectangular or parallelogram-shaped pattern that resembles a flag. This consolidation phase allows the market to digest the initial rally and prepare for the next leg up.
The bull flag pattern is considered a bullish signal because it suggests that the initial uptrend is likely to resume after the consolidation phase. Traders often look for a breakout above the upper trendline of the flag as a confirmation signal to enter a long position.
Bitcoin's Bull Flag Formation
Bitcoin's price chart has exhibited a pattern that closely resembles a bull flag. The flagpole can be identified by the significant upward movement that occurred in the months leading up to June 2025. This rally propelled Bitcoin to a high of $108,000, establishing a strong bullish trend.
Following this rally, Bitcoin entered a period of consolidation, with the price moving sideways and slightly downwards. This consolidation phase has formed a flag-like pattern on the chart, characterized by two parallel trendlines that slope gently downwards.
The formation of this bull flag pattern has led many analysts to believe that Bitcoin is poised for another significant upward movement. The target price for this potential breakout is often calculated by measuring the length of the flagpole and adding it to the breakout point on the upper trendline of the flag. In Bitcoin's case, this calculation suggests a potential target price of around $120,000.
Factors Supporting the Bull Flag Pattern
Several factors support the validity of the bull flag pattern and the potential for Bitcoin to reach $120,000:
• Strong Underlying Bullish Trend: The bull flag is a continuation pattern, meaning that it relies on an existing uptrend to be valid. Bitcoin's price has been in a strong uptrend for several years, driven by increasing institutional adoption, growing mainstream adoption, and limited supply.
• Positive Market Sentiment: The overall sentiment among Bitcoin investors remains positive, despite the recent retreat from $108,000. Many analysts believe that Bitcoin is still in the early stages of its adoption curve and that its long-term potential remains significant.
• Increasing Institutional Adoption: Institutional investors, such as hedge funds, pension funds, and corporations, are increasingly allocating capital to Bitcoin. This increased institutional adoption can drive up the price of Bitcoin and provide a more stable foundation for its long-term growth.
• Growing Mainstream Adoption: Bitcoin is becoming increasingly accepted as a form of payment and a store of value by mainstream consumers and businesses. This growing mainstream adoption can increase demand for Bitcoin and drive up its price.
• Limited Supply: Bitcoin has a fixed supply of 21 million coins. This limited supply makes Bitcoin a scarce asset, which can increase its value over time as demand grows.
• Halving Events: Bitcoin's halving events, which occur approximately every four years, reduce the rate at which new Bitcoins are created. These halving events can reduce the supply of Bitcoin and drive up its price. The next halving event is expected to occur in 2028.
• Macroeconomic Factors: Macroeconomic factors, such as inflation, currency devaluation, and geopolitical instability, can increase demand for Bitcoin as a safe haven asset.
Factors Invalidating the Bull Flag Pattern
While the bull flag pattern is a bullish signal, it is not foolproof. Several factors could invalidate the pattern and prevent Bitcoin from reaching $120,000:
• Breakdown Below the Flag: If the price breaks down below the lower trendline of the flag, the bull flag pattern is invalidated. This would suggest that the consolidation phase is not a temporary pause before another rally, but rather a sign of weakening momentum.
• Negative News and Events: Negative news and events, such as regulatory crackdowns, security breaches, or macroeconomic shocks, could dampen investor sentiment and trigger a sell-off in Bitcoin.
• Weakening Market Fundamentals: If Bitcoin's adoption rate slows down, network activity declines, or transaction volume decreases, it could indicate that the underlying fundamentals are weakening, which could invalidate the bull flag pattern.
• Profit-Taking: After a significant rally, some investors may choose to take profits, which could put downward pressure on the price of Bitcoin and prevent it from breaking out of the flag.
• Alternative Investments: The emergence of compelling alternative investments could divert capital away from Bitcoin, reducing demand and potentially invalidating the bull flag.
Bitcoin Retreats From $108K: A Temporary Setback?
As of June 26, 2025, Bitcoin has retreated from its recent high of $108,000. This pullback has sparked concerns among some investors, but Bitcoin bulls remain optimistic about the long-term prospects of the cryptocurrency.
The recent retreat could be attributed to a number of factors, including profit-taking after a significant rally, regulatory concerns, or macroeconomic headwinds. However, it is important to note that Bitcoin has experienced numerous pullbacks throughout its history, and these pullbacks have often been followed by even stronger rallies.
The key question is whether this pullback is a temporary setback within the bull flag pattern or a sign that the pattern is about to be invalidated. If the price can hold above the lower trendline of the flag and eventually break out above the upper trendline, it would confirm the validity of the pattern and increase the likelihood of Bitcoin reaching $120,000.
Trading the Bull Flag Pattern
Traders who are looking to capitalize on the bull flag pattern can consider the following strategies:
• Entry Point: Wait for a confirmed breakout above the upper trendline of the flag before entering a long position. This helps to avoid false breakouts and increases the probability of a successful trade.
• Stop-Loss Order: Place a stop-loss order below the lower trendline of the flag to limit potential losses if the pattern is invalidated.
• Target Price: Calculate the target price by measuring the length of the flagpole and adding it to the breakout point on the upper trendline of the flag.
• Risk Management: Always use proper risk management techniques, such as limiting the amount of capital you risk on any single trade.
Conclusion
Bitcoin's price chart is currently exhibiting a bull flag pattern, which suggests that the cryptocurrency could be poised for another significant upward movement. The potential target price for this breakout is around $120,000.
However, it is important to note that the bull flag pattern is not foolproof, and several factors could invalidate it. Investors should carefully monitor the price action, market sentiment, and underlying fundamentals to assess the likelihood of Bitcoin reaching $120,000.
The recent retreat from $108,000 is a reminder that Bitcoin is a volatile asset and that pullbacks are a normal part of the market cycle. Whether this pullback is a temporary setback within the bull flag pattern or a sign that the pattern is about to be invalidated remains to be seen.
Ultimately, the future of Bitcoin's price will depend on a complex interplay of technical factors, market sentiment, and fundamental developments. By staying informed and using proper risk management techniques, investors can position themselves to potentially profit from Bitcoin's continued growth and success. As always, remember to consult with a qualified financial advisor before making any investment decisions. The bull flag offers a tantalizing glimpse of potential gains, but prudent analysis and risk mitigation are essential for navigating the volatile world of cryptocurrency.
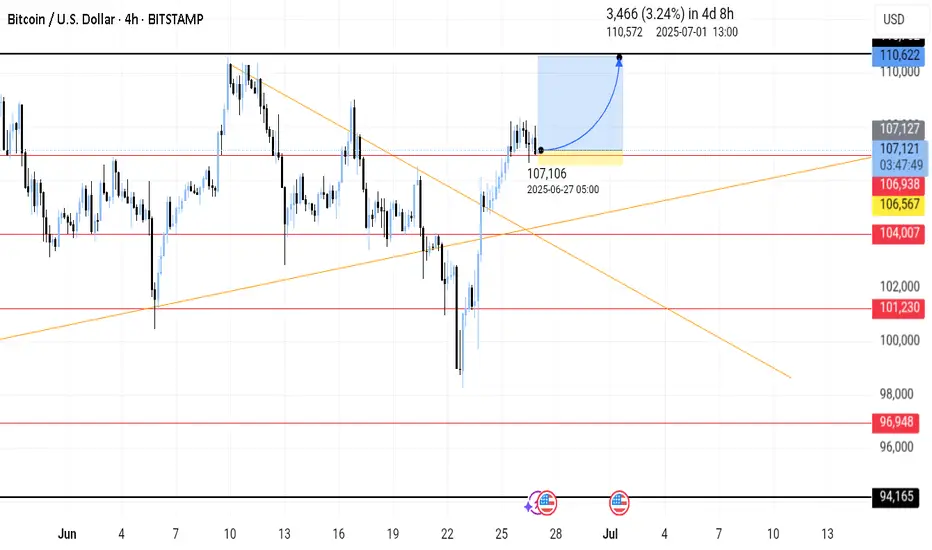
BTC/USD Today: Momentum Builds Toward the Next BreakoutBITSTAMP:BTCUSD Today: Momentum Builds Toward the Next Breakout
Previously on BTC...
1. Double Top Pattern and Target Hit
The chart shows a classic double top (early 2025), a bearish reversal pattern. Once the neckline broke, the price plunged and nailed the technical target (red arrow)—as if Bitcoin had read the textbook.
2. Trendline Break = Game Changer
After bottoming out, BTC broke through a downward sloping trendline, triggering a strong bullish move. This breakout signaled a trend reversal, and the market responded accordingly.
3. Perfect Pullback
Once the breakout played out, the price retraced back to previous resistance, now turned support. This “perfect pullback” is the kind of thing that makes technical analysts smile in their sleep.
4. Bull Trend Confirmation
The successful retest of support confirmed that Bitcoin had shifted from neutral/bearish into a full-on bull trend. Buyers stepped back in with confidence.
📊 BTC/USD – Current Outlook
Bull Flag Forming
Currently, price action is consolidating into a bull flag, a continuation pattern often seen mid-rally. If it breaks out to the upside, the projected target sits near $120,000 .
🚀 Bullish Catalysts:
- Strong structural trend: Higher highs and higher lows are still intact.
- Post-halving momentum: Historically, Bitcoin tends to go beast mode 6–12 months after each halving—and we’re right in that sweet spot.
- ETF inflows : Institutional capital continues pouring into Bitcoin ETFs, adding steady buying pressure.
- Supply crunch: With more BTC leaving exchanges, sell-side liquidity is drying up. Hodlers are hodling.
- Technical setup: A confirmed breakout from the bull flag could trigger a powerful leg higher.
⚠️ Risks and Levels to Watch:
A breakdown of the bull flag could send BTC back toward the $98k–91k range.
Macro headwinds (rate hikes, economic slowdown, dollar strength) could still rain on crypto’s parade.
🧠 Conclusion
This chart paints a textbook bullish setup for Bitcoin. The double top is in the rearview mirror, the trendline breakout gave us the green light, and now the bull flag is loading the next move.
If the breakout happens, the next destination could be $120,000.
It’s one of those “don’t blink” moments—BTC might just be stretching before its next sprint.

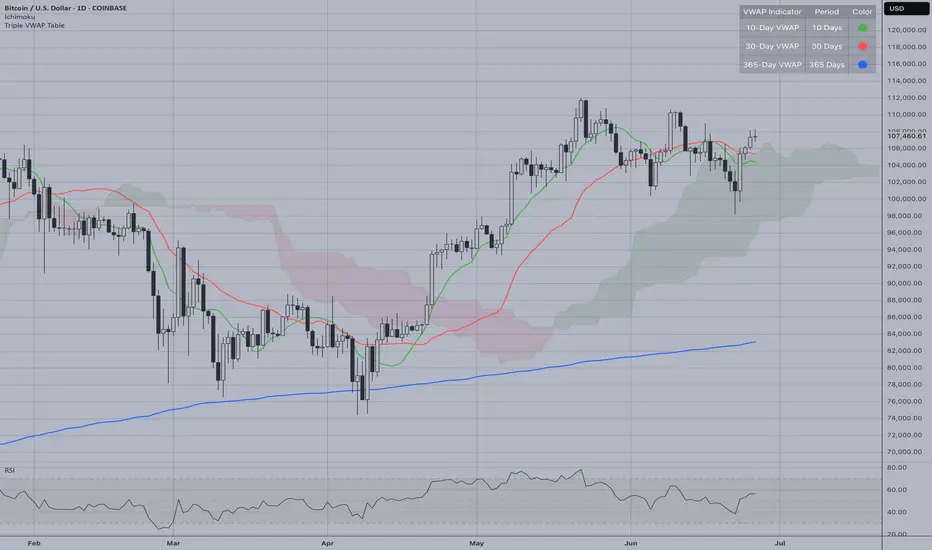
Consolidation Above Key SupportBitcoin (BTCUSD) is currently trading at $107,125 and showing a strong technical setup on the daily timeframe. After the dramatic recovery from March lows around $77,000, BTC has established a solid foundation above the $100,000 psychological level and is now consolidating in a critical resistance zone.
Current Technical Picture:
The price action shows Bitcoin trading above the Ichimoku cloud, which provides strong bullish confirmation. The ascending blue trendline from the March lows remains intact and continues to act as dynamic support around $82,000-85,000. This trendline has been crucial in maintaining the overall upward trajectory.
Key Resistance Levels:
Primary Resistance: $110,000-$112,000 (previous highs)
Secondary Resistance: $115,000 (extension target)
Critical Support Zones:
Immediate Support: $104,000-$105,000 (recent consolidation lows)
Major Support: $100,000 (psychological level + cloud support)
Trendline Support: $82,000-85,000 (ascending blue line)
RSI Analysis:
The RSI is currently hovering around 55-60, indicating neutral to slightly bullish momentum. This suggests there's room for further upside movement without entering overbought conditions.
Trading Outlook:
Bitcoin appears to be setting up for a potential breakout above the $110,000 resistance zone. A sustained break above this level could target $115,000-$118,000. However, failure to break higher and a move below $104,000 could signal a deeper correction toward the $100,000 support zone.
Risk Considerations:
Watch for any breakdown below the ascending trendline or the $100,000 support, as this could invalidate the bullish structure and lead to a retest of lower levels.