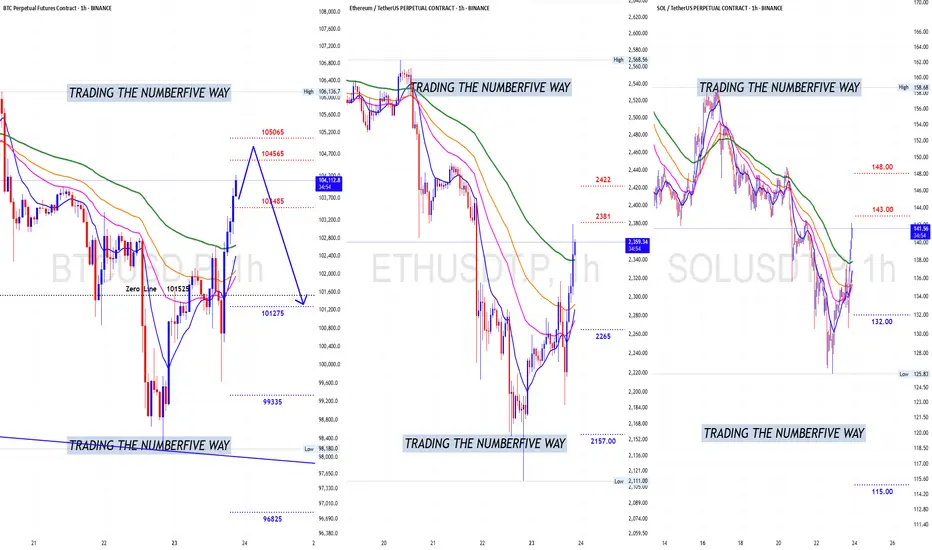
BTCUSD 6/23/2025Come Tap into the mind of SnipeGoat, as he gives you a nice quick analysis of Bitcoins current Price Action to determine Price's next move. THIS IS ONE YOU DON'T WANT TO MISS!
_SnipeGoat_
_TheeCandleReadingGURU_
#PriceAction #MarketStructure #TechnicalAnalysis #Bearish #Bullish #Bitcoin #Crypto #BTCUSD #Forex #NakedChartReader #ZEROindicators #PreciseLevels #ProperTiming #PerfectDirection #ScalpingTrader #IntradayTrader #DayTrader #SwingTrader #PositionalTrader #HighLevelTrader #MambaMentality #GodMode #UltraInstinct #TheeBibleStrategy
BITCOIN trade ideas

A TA Macro Look into Bitcoin to assess directionThis is a look into the macro developments happening currently in Bitcoin.
This is strictly a TA look into the big picture. We zoom out to Timeframes bigger than 1W.
At times zooming in to check (3 Day, 5 Day, maybe 1D) for potential swing trades.
I tend to look into things like price action, indicators, volume and other data to sway probabilities of where an asset may go and determine best opportunities of supply and demand zones based on my interpretations.
So jumping right in this is a look into price action on the 1 Month timeframe.
Notice trend lines drawn.
Notice the Ascending channel.
Notice the Blue rectangle zone.
Notice this months (June) Candle
Our current June candle is in a critical area.
We are around the horizontal resistance zone, indicated by red horizontal line.
This red horizontal resistance line is a powerful one.
Our previous interaction generated a massive Bearish engulfing monthly candle.
This area is not to be joked with and would urge to consider looking for more signs or better data to support continuation of bull run. If not a sell off is in the cards.
Notice our current June candle
Having equal length upper and lower wicks indicate that this month was neutral.
Bulls nor the Bears came on top.
If we close around this in 8 days.
Probabilities would be 50/50 just based on price action and candles for price movement in July.
We would need to look for other signs in indicators or something else, in other words look for confluence of multiple signs whether bull or bear.
The Ascending channel is also in my opinion over extended.
Notice the price action touch points on Green ascending support line.
The duration between touches is coming down.
2nd touch happened 365 days after first. Which was the initial part of Crypto bull market.
3rd touch happened 214 days after.
We are currently 61 days in after 3rd touch. Considering this and being logical, we could be getting close to another touch.
But consider also that the duration can extend well into in the 100's (of days), before we touch.
Notice also the Blue rectangle zone. This marks a side ways range of bitcoin.
The orange horizontal line is mid point of this blue zone.
A scenario could be that price goes to where the orange horizontal line meets the green sloping support line.
The confluence of these 2 support lines, can be a decent area for potential bounce (which can be temporary).
A break down of these 2 lines could also lead Bitcoin back down to the lower border of the Blue rectangle also indicated by Green horizontal line, which is a massive supply zone at the moment.
This scenario in my opinion would be a high probability trade by looking for bounce up but please keep in mind this does not mean a bull run would continue.
Look for more posts as things develop on Bitcoin.
DISCLAIMER: This is not financial advice, i am not a financial advisor. The thoughts expressed in the posts are my opinion and for educational purposes. Do not use my ideas for the basis of your trading strategy, make sure to work out your own strategy and when trading always spend majority of your time on risk management strategy.

Bitcoin Stock Chart Fibonacci Analysis 062325Trading Idea
1) Find a FIBO slingshot
2) Check FIBO 61.80% level
3) Entry Point > 100,622/61.80%
Chart time frame:C
A) 15 min(1W-3M)
B) 1 hr(3M-6M)
C) 4 hr(6M-1year)
D) 1 day(1-3years)
Stock progress:A
A) Keep rising over 61.80% resistance
B) 61.80% resistance
C) 61.80% support
D) Hit the bottom
E) Hit the top
Stocks rise as they rise from support and fall from resistance. Our goal is to find a low support point and enter. It can be referred to as buying at the pullback point. The pullback point can be found with a Fibonacci extension of 61.80%. This is a step to find entry level. 1) Find a triangle (Fibonacci Speed Fan Line) that connects the high (resistance) and low (support) points of the stock in progress, where it is continuously expressed as a Slingshot, 2) and create a Fibonacci extension level for the first rising wave from the start point of slingshot pattern.
When the current price goes over 61.80% level , that can be a good entry point, especially if the SMA 100 and 200 curves are gathered together at 61.80%, it is a very good entry point.
As a great help, tradingview provides these Fibonacci speed fan lines and extension levels with ease. So if you use the Fibonacci fan line, the extension level, and the SMA 100/200 curve well, you can find an entry point for the stock market. At least you have to enter at this low point to avoid trading failure, and if you are skilled at entering this low point, with fibonacci6180 technique, your reading skill to chart will be greatly improved.
If you want to do day trading, please set the time frame to 5 minutes or 15 minutes, and you will see many of the low point of rising stocks.
If want to prefer long term range trading, you can set the time frame to 1 hr or 1 day.

BTC vs ETH LongBTC vs ETH ratio is now net long on the regression break.
I am not trading this trade.

BTC SHORT TP:97,500 23-06-2025We’re looking at a false bullish spike setup — that means it looks strong, but it’s all smoke.
Shorting between 102,500–103,600, targeting 97,000–97,800 with a solid 3.8 RR.
Timeframe: 4H.
Expected to play out in the next 24 to 30 hours, otherwise invalid.
There’s still a chance of manipulation to the upside, but we’re betting on rejection.
We don’t use indicators, we’re not out here drawing lines or cute little shapes — I just give you a clean trade.

Bitcoin Wave Analysis – 23 June 2025
- Bitcoin reversed from round support level 100,000
- Likely to rise to resistance level 105,000
Bitcoin cryptocurrency recently reversed from the support area between the round support level 100,000, the lower daily Bollinger Band and the 38.2% Fibonacci correction of the upward impulse from April.
This support area was further strengthened by the support trendline of the daily down channel from May.
Given the clear daily uptrend, Bitcoin cryptocurrency can be expected to rise to the next resistance level 105,000.

BTC USDT 135k TARGET. BTC USDT going to cross the 135k mark by the year end before cooling off.
HISTORY REPEATS ITSELF.

BTCUSD This setup assumes institutional players:
Induce retail breakout trades at highs
Spike price slightly above the zone (stop raid)
Then dump into downside imbalance/liquidity
We’re riding that wave, not chasing price.
DYOR.

Bitcoin 1hr TIME Cycle Alright ladies and gentlemen the 1hr TIME Cycle is almost completed .
In the next 6 to 10 hrs (if not sooner) the 1hr Cycle will be completed and it will stop going up to start moving sideways and then start to rolling down for a test to the $100k line again and eventually a test to the recent low of $98k, so whatever the high it prints during that period of TIME that will be it, at least until the set up is ready again. We will follow with updates.
Book profits or at least protect capital with sl. Stay tuned
BTC USD LONG RESULT Bitcoin Price dumped after holding both the resistance zone and Trendline, and on its way down held both Support zone and the major Support Trendline, from where I took the entry to the major resistance.
But price held the lower resistance zone and dumped massively from there.
Closed at B.Even though, stronger setups to come.

Bitcoin: The price. I don't like it. I remember so clearly in November 2021 when Bitcoin showed bearish divergence on the weekly charts.
We might all be suffering from PTSD and fear the same outcome, especially with the potential for a double top.
If BTC is able to stay above the 1D 200MA, as well as the RSI remaining above 50, there may be hope... If not, i.e. a weekly close below and retest of the 1D 200MA; RSI <50, there might be a real cause for concern.
This, supported by a declining RSI would most certainly be a bearish signal and a shift in market trend.
Nobody knows the future and I think we're all running on hopium due to all the positive news about BTC this year.
Until BTC makes a new ATH, we may want to manage our expectations.
What are your thoughts?

$BTC Leading Macro Indicator Chart Predicted the Nuke to The DayYet again this chart predicted the nuke to the day 💣
I know I shouldn't be surprised at this point, but I'm still fascinated by how accurate technical analysis can be 🤓

You Gotta take this chance or its over For Bitcoinfor the short run bitcoin is showing to satisfy sellers , as the market also is rebounding
Big Buy move is to predict once the price hit the zeone
Bitcoin Between Conviction and Caution - The Market Suspended?⊢
⟁ BTC/USD – BINANCE – (CHART: 1W) – (Date: June 23, 2025).
⟐ Analysis Price: $101,226.28.
⊢
⨀ I. Temporal Axis – Strategic Interval – (1W):
▦ EMA21 – ($96,740.64):
∴ Price remains above the 21EMA, confirming bullish structural integrity in medium trend;
∴ The slope of EMA21 remains positive, reinforcing sustained market momentum;
∴ Most recent candle printed a higher low above the 21EMA, reaffirming it as dynamic support.
✴️ Conclusion: The 21EMA upholds the current cycle's bullish engine - it is the first invalidation level for any mid-term reversal.
⊢
▦ SMA50 – ($85,002.38):
∴ SMA50 sits considerably below current price, reflecting distance from mean reversion zones;
∴ Market remains extended, but no immediate signs of pullback toward this structural level;
∴ The last interaction with SMA50 was in late 2023, when it confirmed trend resumption.
✴️ Conclusion: SMA50 defines the core mid-range support - no threat to it unless a breakdown accelerates below EMA21.
⊢
▦ SMA200 – ($49,241.87):
∴ SMA200 remains deeply below market, showing that the macro bullish structure remains unchallenged;
∴ Distance from SMA200 reflects the strength and maturity of this cycle’s trend;
∴ Long-term investors remain in profit and structurally supported.
✴️ Conclusion: No macro breakdown as long as price stays well above SMA200 - the secular bull phase is intact.
⊢
▦ Ichimoku Cloud – (Kumo, Tenkan, Kijun, Chikou Span):
∴ Price is trading clearly above the Kumo (cloud), showing sustained bullish dominance;
∴ Tenkan-sen and Kijun-sen lines are positively stacked, with Tenkan still leading;
∴ Chikou Span is above price and cloud, confirming long-term bullish alignment.
✴️ Conclusion: All Ichimoku components confirm bullish control - weakening only upon Tenkan/Kijun flattening or bearish cross.
⊢
▦ MACD – (MACD: 318.17 | Signal: 4,884.24):
∴ MACD line is far below the signal line, though attempting a bottoming curve;
∴ The histogram remains red but with decreasing amplitude - bearish momentum is fading;
∴ No bullish crossover yet - momentum remains negative but weakening.
✴️ Conclusion: MACD suggests waning bearish cycle, but no official reversal signal until crossover and histogram neutralization.
⊢
▦ RSI + EMA21 – (RSI: 57.71 | RSI EMA: 59.39):
∴ RSI remains in bullish territory above 50, although flattening below its EMA;
∴ No bearish divergence observed yet - RSI is consolidating;
∴ If RSI reclaims its EMA, strength may resume; if rejected again, loss of momentum may escalate.
✴️ Conclusion: RSI reflects structural strength, but cautious momentum - monitoring RSI/EMA relationship is critical.
⊢
▦ Volume + SMA21 – (Vol: 2.51K):
∴ Weekly volume remains below the 21-week average, indicating weakening participation;
∴ Last few candles show declining volume despite price stability - possible distribution;
∴ Absence of buyer aggression may limit further upside near-term.
✴️ Conclusion: Volume suggests lack of conviction - momentum exists, but crowd participation is thinning.
⊢
🜎 Strategic Insight – Technical Oracle:
∴ Bitcoin's weekly chart maintains bullish structural posture above all key moving averages, yet momentum indicators reflect hesitation;
∴ The Ichimoku system confirms trend dominance, but MACD and RSI signal that internal strength is not expanding - only sustaining;
∴ Volume contraction reveals market indecision or fatigue, potentially foreshadowing consolidation or rebalancing phases;
∴ Despite no structural breakdown, directional conviction is lacking - further upside demands renewed volume and momentum alignment.
⊢
☍ II - GAP CME – BTC1! – Chicago Mercantile Exchange:
▦ Previous CME Close – ($99,640.00) + Spot Opening Binance – ($100,980.77):
∴ A clear upside gap is present between the institutional close and the retail spot open, measuring approximately $1,340.77, thus defining a latent Magnet Zone for downward pullback;
∴ This CME gap forms a critical vacuum range between $99.640 and $100.980, which will likely act as a liquidity reabsorption zone if spot retraces;
∴ No immediate fill has occurred, suggesting current bullish momentum persists despite latent imbalance.
∴ The latest weekly CME candle closes with a smaller real body and a pronounced upper wick — a classical signal of buy-side exhaustion below macro resistance ($102K–$103K);
∴ Despite the weakening thrust, no breakdown has yet been printed — the bullish structure remains technically intact above previous weekly lows;
∴ Volume prints are non-expansive, indicating lack of conviction among institutional buyers at this level — vigilance is required.
✴️ Conclusion: The CME structure reveals a latent institutional gap magnet to the downside, with price now suspended above an untested imbalance. The technical structure remains constructive but fragile. Further confirmation from the spot market will determine whether continuation or reversion will manifest in the coming cycle.
⊢
∫ III. On-Chain Intelligence – (Source: CryptoQuant):
▦ Exchange Inflow Total – (All Exchanges):
∴ A recent spike in total Bitcoin inflows aligns directly with the $101K zone, signaling increased movement of coins from wallets to exchanges;
∴ Historically, such inflow spikes near local tops indicate preparation for distribution or profit-taking by large holders;
∴ Current inflow levels exceed previous consolidation phases, amplifying the risk of sell pressure activation.
✴️ Conclusion: The market is facing elevated short-term risk from exchange-bound liquidity — inflows confirm readiness to sell into strength.
⊢
▦ Spot Taker CVD – (Cumulative Volume Delta, 90-Day) – (All Exchanges):
∴ The 90-day CVD curve shows clear flattening and early reversal near resistance, indicating a shift in taker behavior;
∴ Passive sell-side absorption appears to dominate, reducing the strength of buy-side aggression;
∴ Price action continues upward while CVD retreats, forming a classic hidden distribution divergence.
✴️ Conclusion: CVD reveals taker exhaustion - without resurgence in spot demand, current price levels are vulnerable to sell-offs.
⊢
▦ Exchange Inflow Mean – (7-Day Moving Average) – (All Exchanges):
∴ The 7DMA of inflow mean remains elevated, suggesting sustained presence of large-sized transactions heading toward exchanges;
∴ This behavior often precedes institutional or strategic sales, especially when combined with total inflow spikes;
∴ No decline in the inflow mean implies continuous preparation for short-term distribution.
✴️ Conclusion: Elevated inflow mean confirms that whales and large actors are preparing or executing strategic exits.
⊢
▦ Funding Rate – (All Exchanges):
∴ Rates across global derivatives platforms remain slightly positive but without speculative imbalance;
∴ The neutral-positive range suggests cautious optimism among traders - not overleveraged, but not afraid;
∴ No signs of euphoric long build-ups, which reduces liquidation risk but weakens breakout fuel.
✴️ Conclusion: A neutral funding environment supports consolidation, not explosive upside — no immediate directional conviction.
⊢
▦ Funding Rate – (Binance):
∴ Binance-specific funding remains tightly aligned with global averages, reflecting no localized distortion;
∴ Positive, stable readings indicate low speculative friction, but also lack of trend-defining aggression;
∴ Historical patterns show that breakout rallies typically require a surge in funding rate — not present yet.
✴️ Conclusion: Binance traders are balanced - not short-squeezed nor euphoric - bias remains neutral until imbalance arises.
⊢
▦ Realized Price – Short-Term Holders (MVRV-STH) – (~$47.5K):
∴ Price trades far above the STH realized price, indicating most recent buyers are deep in unrealized profit;
∴ This dynamic historically increases the chance of sell pressure at resistance zones, especially when inflows are high;
∴ No downward compression or convergence - suggesting strength remains, but realization is a persistent risk.
✴️ Conclusion: STH's are exposed to high profit levels - the market is primed for potential realization, but not structural weakness.
⊢
🜎 Strategic Insight – On-Chain Oracle:
∴ Exchange-based signals (Inflow Total, Mean) confirm active preparation for sell-side flow;
∴ Spot aggression is fading as per CVD divergence, weakening breakout thesis despite strong price structure;
∴ Neutral funding and passive miner/on-holder behavior reflect structural balance - not panic, not euphoria.
✴️ Conclusion: The market rests in a zone of speculative tension - directionally undecided, but operationally sensitive to imbalance triggers.
⊢
⌘ Codicillus Silentii – Strategic Note:
∴ The temporal structure signals resilience, but lacks expansion - technical relief exists without structural thrust;
∴ On-chain flows unveil transactional friction at current levels, with capital cycling toward liquidity zones (exchanges);
∴ Market energy is neither compressed for breakout nor collapsed into capitulation - a state of coiled hesitation;
∴ Asymmetry remains hidden within equilibrium - vigilance, not movement, defines the moment.
⊢
𓂀 Stoic-Structural Interpretation:
▦ Structurally Neutral:
∴ Price holds above key macro supports (EMA21, SMA50), confirming preservation of the bullish superstructure;
∴ Long-term holder behavior and miner flows remain passive - structural integrity is undisturbed;
∴ However, no active thrust or trend validation emerges - the system sustains but does not ascend.
⊢
▦ Tactically Cautious:
∴ Exchange inflows and CVD divergence signal short-term vulnerability near key resistances;
∴ Technical indicators (MACD, RSI, Volume) reflect a condition of deceleration - momentum is reactionary, not foundational;
∴ Until price reclaims volume-weighted levels with confirmation, the posture remains defensive and watchful.
⊢
⧉
⚜️ Magister Arcanvm (𝟙⟠) – Vox Primordialis!
𓂀 Wisdom begins in silence. Precision unfolds in strategy.
⧉
⊢

Bitcoin Bounce Alert: Holding the $100K Fortress! 📉 Market Context & Technical Levels
Key support at ~$100K: As the chart shows and multiple analysts confirm, this level continues to act as a strong defence zone. Cointelegraph noted bulls have been “defending the $100K key support level strongly,” triggering bounces during dips
Descending channel overhead: Bitcoin has retraced into a downward channel. A clean breakout above ~107K–109K (past recent peaks) is needed to signal a bullish shift .
Liquidity target at ~106K: Plenty of orders await in that region—flipping it to support may pave the way for another push higher .
📊 Indicators & Momentum
RSI dip near 25 during the latest drop indicates oversold conditions—often a precursor to rebounds
.
Volume surge on rebounds suggests absorbing sell pressure and strong accumulation interest at lower levels.
🚩 Key Price Zones to Watch
Level Significance
$100K Crucial support; losing it risks a slide toward $95K–97K or even $92K
.
$105K–106K Liquidity zone; flipping here as support could confirm upward momentum .
$107K–109K Resistance from channel tops and prior highs; a successful break is key to next leg up .
$112K–$112K+ If breakout occurs, upside targets extend toward prior ATH near $112K and beyond .
🎯 Chart Analysis Summary
Your chart shows three distinct bounces from the $100K–100.7K supply zone (highlighted in blue) and the latest one includes a sharp wick and rebound. This aligns with broader market dynamics emphasizing support at $100K and building liquidity at $106K. The arrow projection signals a probable retest of ~106K, with room to challenge ~107–109K after consolidation.
🧭 Trade Outlook
Bullish scenario: Hold above $100K → reclaim $106K → trendline breakout → potential rally to $112K+.
Bearish risk: Fails support at $100K → breakdown toward $95K–92K region.
📌 Bottom Line
Support $100K is alive and well. Bounces have been crisp and volume-backed.
Next test lies at $105–106K. That’s the battleground—flip it, and we may see bitcoin reclaim recent highs.
Watch the channel overhead (~107K–109K). A breakout could open the door to fresh records.
✅ Conclusion: BTC is defending its psychological base firmly. If this zone holds once more, the path to $106K and beyond is in focus. Breaking above demands conviction, but it’s the pivot to watch.

BITCOIN 1hr Still Bullish After dropping below the $100,000 and printing a lower low we can say that there will be a test to that low and probably will breach it, but before doing that it will go and test the $102725 - $103500 area to complete its 1hr Bullish TIME Cycle.
A break to the ATHs still on the table, remember that the ATHs is on the weekly chart and
that hasn't changed at all, only a break to the $74000 low will change the structure of the
Weekly chart. Once the 4hrs Bullish TIME Cycle sets up for a bounce we will start seeing higher highs again but for now the 30min and 1hr TIME Cycles will be playing out.
We'll follow the move with updates so stay tuned.
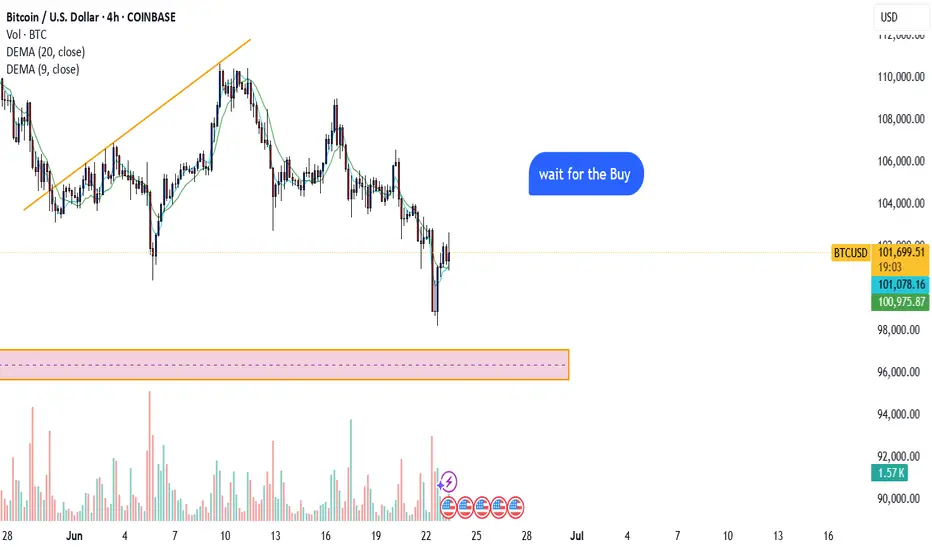
Long Scenario Invalidated — Watching for Deeper Correction🚫 Long scenario is canceled!
Price started to break down, taking out the early June lows.
There's now a high probability of a deeper correction toward the 90,000–95,000 range.
I won’t short from current levels. The uptrend remains intact on the weekly chart. There are safer and more asymmetric opportunities in the market from a risk-reward perspective. For example, shorting the S&P 500 or going long on precious metals looks more attractive right now.
💡 General recommendation:
Stay away from high-volatility assets like Bitcoin, oil, and natural gas for now.
Wait for setups with tight stop-loss levels and clear structure before entering.

CHECK BTCUSD SIGNAL READ CAPTAINbtcusd sell now ✅
entry point (101850.00) (101700.00)
TAKE PROFIT 1: (101200.00)
TAKE PROFIT 2: (100450.00)
LAST TARGET(99700.00)
STOP LOSS (102400.00)

Bitcoin - Will Bitcoin Lose $100K Support?!On the four-hour timeframe, Bitcoin is below the EMA50 and EMA200 and is in its short-term descending channel. One can look for buying opportunities for Bitcoin from the channel bottom. If the resistance level is broken, the path to the rise and its reach to the level of $107,000 will be prepared for Bitcoin.
It should be noted that there is a possibility of heavy fluctuations and shadows due to the movement of whales in the market, and capital management will be more important in the cryptocurrency market. If the downward trend continues, we can buy within the demand range.
Bitcoin has been in the spotlight again in recent days, especially as its price fluctuates within the psychologically important range of $101,000-$102,000 and its fundamental indicators are sending mixed signals.
The first and perhaps most important element in Bitcoin’s fundamental analysis is the accumulation trend by large financial institutions and corporations. According to data published by websites such as CoinShares and the Financial Times, more than $87 billion worth of Bitcoin is currently held by companies such as MicroStrategy, Tesla, Block, and ETFs, which is approximately 3.2% of the total BTC supply in circulation. This clearly shows that Bitcoin has established itself as a store of value in the portfolios of professional investors, although there is still no consensus on its function as a “digital gold”.
In this regard, analysts such as Román González of A&G have predicted that Bitcoin could reach the $200,000 range by the end of the year; on the other hand, some more conservative analysts such as Jacqui Clarke believe that Bitcoin still lacks measurable intrinsic value and should not be viewed solely as an alternative asset. This conflict of views shows the depth of complexity in analyzing Bitcoin.
From the perspective of onchain, or intra-network data, the picture looks a little more cautious. The volume of active addresses last week was in the 1.0-1.1 million range, which is lower than in previous bullish periods (such as late 2021). Also, the MVRV (Market Value to Realized Value) index, which measures the potential profit potential of investors, fell slightly from 2.29 to 2.20, indicating that the market is somewhat cooling off from the short-term heat. Also, on June 22, more than 5,200 Bitcoins were removed from exchanges, which is usually a sign of long-term accumulation and a decrease in short-term selling pressure. On the other hand, Bitcoin’s behavior in the face of geopolitical crises shows signs of a change in the dominant market narrative. During the recent tension between Iran and Israel, Bitcoin fell by nearly 4%, unlike gold, which experienced significant growth. This challenges the assumption that Bitcoin is a “hedging” or “safe haven” asset and shows that BTC is still registered more as a risk-on asset in the minds of market participants. This is considered very important as investors look for tools to hedge inflation or protect against economic shocks. In terms of correlation with traditional markets, Bitcoin is also on a path to further integration with classic assets. The 30-day correlation index between Bitcoin and the S&P500 is now around 0.78, and academic studies predict that the correlation will grow to 0.87 at some point in 2024. This means that Bitcoin’s movements are more aligned than ever with the Federal Reserve’s monetary policy, interest rates, stock market conditions, and global liquidity flows. Therefore, in the current situation, the impact of US macro data or central bank decisions plays a decisive role in Bitcoin’s volatility.
Finally, Bitcoin price prediction models in recent days also reflect this complexity. Websites such as Bitfinex, Changelly, and analysts from institutions such as Brave New Coin have estimated that Bitcoin could reach the $125,000-$135,000 range this summer if macroeconomic conditions remain stable, and even if institutional capital continues to flow and there are no macro crises, reaching $150,000 by the end of the year is not out of the question. However, such scenarios require maintaining the current level of liquidity in the market, the absence of drastic tightening measures by the Federal Reserve, and the control of geopolitical risks.
In short, Bitcoin is in a situation where, on the one hand, its supporting fundamentals are stronger than ever; With institutional inflows, accumulation of long-term addresses, and reduction of inventory on exchanges. On the other hand, the market remains highly vulnerable to macroeconomic and political risks and continues to show volatile reactions.
This situation has led to Bitcoin becoming not only a speculative tool or growth investment, but also gradually becoming a part of professional portfolios with a carefully composed risk management mix. Its medium-term outlook is positive, but with one important condition: stability in global inflation and continued institutional capital flows.

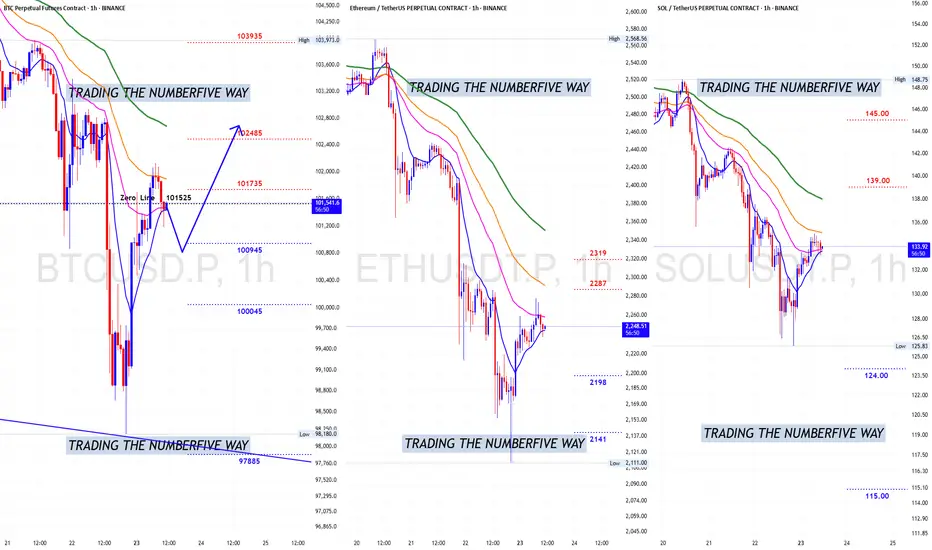
BTCUSD 6/23/2025Come Tap into the mind of SnipeGoat, as he gives you an amazing Full Top-Down Analysis & an update to his previous market call. Ohhhh & he comes with receipts...
_SnipeGoat_
_TheeCandleReadingGURU_
#PriceAction #MarketStructure #TechnicalAnalysis #Bearish #Bullish #Bitcoin #Crypto #BTCUSD #Forex #NakedChartReader #ZEROindicators #PreciseLevels #ProperTiming #PerfectDirection #ScalpingTrader #IntradayTrader #DayTrader #SwingTrader #PositionalTrader #HighLevelTrader #MambaMentality #GodMode #UltraInstinct #TheeBibleStrategy

Bitcoin's Failed 60-Day Cycle: Relief Rally Before More DownsideBitcoin has officially failed its current 60-day cycle by breaking below the previous cycle low on June 5th, touching $100,000. This marks a key structural shift that traders should not ignore.
📉 What’s Next? Likely Scenario:
The highest probability setup now is a relief rally toward the Stoch RSI highs on the 1-Day and 3-Day timeframes, followed by a move downward into the 60-day cycle low, projected to form between late July and early August. This aligns with a potential retest of the Value Area Low from April, a key support zone to watch.
📈 Upside Target:
If we do see bullish continuation in the short term, the main upside target is $105,000. This level is significant as it clusters three Weekly Point of Control (POC) levels from May and June, making it a high-liquidity magnet for price. Historically, Bitcoin tends to gravitate toward these levels when several align closely.
💼 Current Positioning:
I’m currently long BTC and ETH, and I’m watching closely for Stoch RSI to top out on the 1-Day and 3-Day timeframes. I’ll look to reduce or exit those positions as we approach those cycle peaks.
🔔 Pro Tip: Price often seeks out stacked POC levels. If you’re a volume profile trader, keep $105K on your radar.
📌 P.S. For access to my custom indicators and deeper cycle analysis, check the description in my profile.

BTC /USD 15 MINUTE CHART PATTERNYour BTCUSD 15-minute trade setup is as follows:
---
🟢 Long Position (BUY)
Entry: 101.958
Stop Loss: 99.554
Target 1: 103.100
Target 2: 104.500
Target 3: 106.391
---
🧮 Position Metrics
Risk (SL): 101.958 – 99.554 = 2.404
Reward:
T1: 103.100 – 101.958 = 1.142 → R:R ≈ 0.48
T2: 104.500 – 101.958 = 2.542 → R:R ≈ 1.06
T3: 106.391 – 101.958 = 4.433 → R:R ≈ 1.84
---
⚠ Notes
R:R at Target 1 is under 1, so consider partial profits only if you're managing risk aggressively.
Make sure to monitor price action and volume near resistance zones before committing heavily.
Trailing stop strategy can be useful once price approaches Target 2.

Btc longA great place to buy if price retraces. Buying btc at the fvg gap is a good risk to reward game.
