Bitcoin Consolidates Liquidity Around $105,000FenzoFx—Bitcoin is trading sideways near $104,650 after a sharp drop from $109,000, forming a high-liquidity zone with potential for a breakout.
The $102,746–105,266 range shows strong accumulation, offering support. BTC remains bullish above the previous week's low, but must close above the previous day's high to resume its uptrend.
BITCOIN trade ideas

Short term bearish on BTC until 92K USDPurely looking at current dealing range and the fact that price is holding in 'bearish flag' pattern, which may a false signal, when at ALH.

BTC bouncing of Support. BTC bouncing of the 1D diagonal support line at $104k but needs to flip $106k to continue the rally , don’t see it happening until July .

Crypto consolidating ahead of rally towards All Time HighsWith US equity markets closed for Juneteenth, I'm checking in on an equal weight basket of cryptos. Recently I said crypto looked to be heating up for a run at new highs.
As I look today, prices appear range bound on the daily chart. There's a bearish double-top formation, beside declining momentum. The bottom of the range resting at the 200 Day Moving Average, and a test of it seems likely.
Should there be a bounce off the 200 Day SMA, and a break through the top end of the range we might get a shot at those new All Time Highs.

BTCUSD – CME Gap Gravity & AVWAP Staircase🕯️ 4H Chart Analysis | June 19, 2025
🎯 Targeting: $93.3K CME Gap | Confluence: AVWAP zones + Structure breaks
Thesis:
We're currently hanging off the edge of a volume profile cliff. Price is coiled beneath a broken rising wedge, hugging the POC from the prior rally. The key idea: liquidity has shifted, and the next high-probability move is a breakdown through key VWAP levels into the CME gap at ~$93.3K.
📉 Funding Shift:
Funding remains slightly negative or flat across major venues — signaling late longs are trapped and paying to hold.
📊 Open Interest Still Elevated:
– Total BTC OI: $69.41B
– CME OI: $16.50B (23.77%)
– Binance OI: $11.67B (16.8%)
– Bybit OI: $7.66B
– OKX OI: $4.02B
– CME is now the largest BTC derivatives venue by notional OI — institutionals dominate this range.
– Despite the recent drop, OI only fell -0.6% (24h) system-wide — leverage still bloated and vulnerable.
💱 CME Basis Compression:
June front-month futures trade only ~$35 above spot — basis compressed to ~0.03%. Carry trade is gone; CME gap below is now magnetic.
🛡️ Macro Narrative: Credential Meltdown
Today marks the largest password leak in digital history (16 billion credentials). If this leads to broader cybersecurity fear, crypto might feel downstream de-risking effects.
📉 Spot vs. Derivatives Skew:
Derivatives OI/volume is high; spot demand remains muted. Suggests price is levitating on leverage — not sustainable without real buyers.
📍 Invalidation Levels:
– Short-term: 4H close above $106.6K = invalidates immediate breakdown setup.
– Macro: Weekly close above $109K with rising OBV = negates CME gap gravity.
✍️ Execution Logic:
If $103K breaks alongside a $500M+ OI flush → scale into short
TP1: $100.3K, TP2: $97.6K, TP3: $93.3K CME gap
🟠 AVWAP targets:
- $102K (orange line) – currently being tested.
- $97.6K – Fib 0.382 zone + AVWAP cluster.
- $93.3K – CME Gap + “Golden Supply Zone” + Fib 0.5.
📉 Liquidity Logic:
- Shorts got squeezed early June — now the longs are stuck. Thin air below. If we nuke through $102K, the dominoes fall cleanly: AVWAP by AVWAP until CME gap closes.
Volume & Profile:
🟦 High-volume node just got pierced.
📉 We’re slipping below the POC — next major support is structurally far below.
Price Levels to Watch:
Immediate breakdown: $100.3K wick zone
Support fade targets:
🔹 $97.6K (Fib & AVWAP)
🟠 $93.3K (Gap)
🟢 $88.9K (Fib 0.618, possible overshoot)
Narrative Summary:
Shorts are gone, longs are sweating. This is the AVWAP death ladder scenario. CME gap acts like gravity when no major buyers step in. Until price reclaims above broken trend structure, every bounce is suspect.

CHECK BTCUSD SIGNAL READ CAPTANbtcusd buy now ✅
entry point (105000) (104800)
TAKE PROFIT 1: (105.300)
TAKE PROFIT 2: (105.800)
LAST TARGET (106300)
STOP LOSS (104300)

BTC/USD Bearish Outlook AnalysisBTC/USD Bearish Outlook Analysis 📉🧠
📊 Technical Overview:
The BTC/USD chart is showing signs of a bearish structure formation, suggesting increased downside momentum in the short term.
🔻 Resistance Zone:
Clear resistance is identified near $110,345, marked by multiple price rejections (🔴 red arrows).
Price failed to break above this zone several times, indicating strong selling pressure.
🔸 Support Zone:
Strong support lies near the $100,000 psychological level.
Price has respected this zone multiple times (🟠 orange circles), indicating buyer interest.
📉 Current Price Action:
A descending trendline breakout attempt failed and price is now consolidating just below $105,000.
Price is forming a bearish flag/consolidation structure after recent rejection.
A breakdown from the current box range is likely to push BTC toward the support zone at $100,000.
📉 Bearish Scenario:
If BTC breaks below $104,000, expect continuation towards $100,000.
A daily candle close below support could signal further downside.
📈 Invalidation:
Bullish invalidation occurs if BTC reclaims and closes above $108,000, with volume, retesting resistance at $110,345.
🧭 Summary:
BTC/USD is exhibiting a lower highs structure within a descending channel. Unless it breaks above the resistance zone, the bias remains bearish with a high probability of retesting support.

Bitcoin Hugging The Daily 50 MABitcoin continues to hover in familiar territory, and today’s chart doesn’t add much new drama – but it does offer some useful structure to work with.
Price is grinding just above the 50-day moving average, which currently sits around $104,000. That level has provided reliable support over the last few weeks and is now reinforced by horizontal support from the prior range breakout. A clean bounce here keeps the door open for another attempt at the $112,000 high, which remains the key resistance level to reclaim.
Below the current price, the structure is layered. The next major support sits around $100,700, and below that, the psychological $100K mark acts as a backstop. A break below that level could set the stage for a deeper pullback toward $92,800 or even $88,800 – both of which served as prior resistance and could now act as support.
Momentum remains weak, volume is nothing to write home about, and volatility has tapered off. But this type of coiling action often precedes a bigger move. The good news for bulls is that despite the chop, Bitcoin has consistently made higher lows – a sign of quiet accumulation and underlying strength.
Bottom line – Bitcoin is range-bound but respecting structure. As long as it holds above $104K, bulls are still in the game. Break below $100K, and the picture changes quickly. Stay nimble.

The GENIUS Act: A Historic Breakthrough in Stablecoin RegulationIn the fast-evolving world of cryptocurrencies, stablecoins have carved out a unique role, acting as a bridge between digital assets and traditional finance. Until recently, however, the regulatory framework for these instruments remained fragmented and unclear. The adoption of the GENIUS Act marks the first major step toward establishing a coherent regulatory system for stablecoins in the United States — an event already being hailed as a historic breakthrough.
What Is the GENIUS Act?
The GENIUS Act (short for "Guaranteeing Effective National Incorporation of Ubiquitous Stablecoins") is a legislative initiative designed to set clear rules for the issuance, backing, and circulation of stablecoins. Its primary goal is to ensure transparency, stability, and security for users, investors, and financial institutions engaging with these digital assets.
The bill has received bipartisan support, demonstrating a broad political consensus on the need to bring order and trust to the digital asset market.
Why Is It a Breakthrough?
Before the GENIUS Act, the legal status of stablecoins existed in a regulatory "gray area." Issuing companies often faced uncertainty: were they subject to banking laws, SEC oversight, or fintech regulations? This ambiguity led to high-profile lawsuits, account freezes, and declining institutional trust.
The GENIUS Act introduces:
A licensing framework for stablecoin issuers, requiring 100% reserves in fiat currency or secure liquid assets
Mandatory audit and reporting standards, including independent verification and public disclosures
Clear separation between fiat-backed and algorithmic stablecoins, acknowledging their different risk profiles
Mechanisms for coordination with the Federal Reserve, paving the way for stablecoin integration into the broader financial infrastructure
Impact on the Market
The passage of the GENIUS Act has already had a ripple effect. Major issuers like Circle (USDC) and Paxos have expressed their readiness to comply with the new standards. Meanwhile, less transparent players are beginning to lose market share.
Institutional investors — including banks and asset managers — are increasingly viewing stablecoins as a reliable instrument for payments and capital storage. This growing confidence could be the key to the mass adoption of Web3 apps, decentralized finance (DeFi), and digital commerce.
Global Significance
The GENIUS Act also sets a precedent for other countries. Just as the U.S. once led the way in traditional financial regulation, it is now establishing benchmarks for digital assets. The EU, UK, Singapore, and others are closely analyzing the bill’s elements for adoption in their own jurisdictions.
Conclusion
The passage of the GENIUS Act represents a historic step toward crypto market maturity. It not only eliminates regulatory uncertainty but also lays the groundwork for sustainable digital economic growth. For the first time, stablecoins have a clear, institutionally recognized legal status — marking the transition from chaotic innovation to structured trust.

99K and 97.5K potential targetsMorning folks,
As you can see, not occasionally last time we chose only nearest 107K and 109K targets. Market indeed looks a bit heavy. Now short-term context turns bearish and we consider reaching of 99K target as rather high. Next potential target area is 97.K - butterfly target and daily Fib support.
Obviously now we do not consider any new longs and need some clear signs of sentiment changing, that we do not have by far. Let's see what will happen around support area

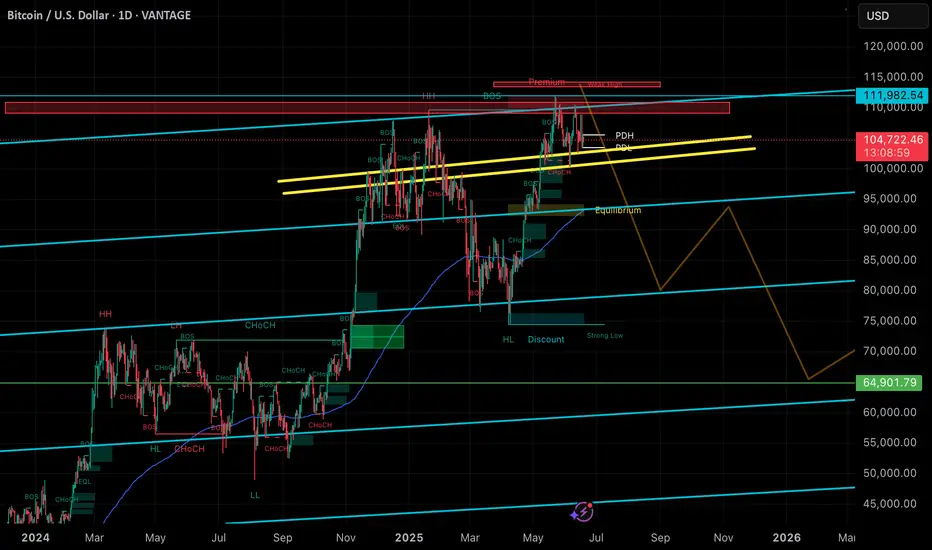
BTC Predictions for Q3 and Q4 for this year and early next yearI believe we have topped out on BTC, and we are waiting to grab liquidity at around 113-115k before we make a bottom to 65k.
BTC market update 19 6 ,2025The chart you've shared is a 1-hour BTC/USD (Bitcoin to USD) chart from Bitstamp, and it illustrates several technical patterns and a possible bearish setup:
Key Observations:
1. Rising Wedge Pattern (Bearish):
From June 13–17, a rising wedge pattern formed (higher highs, higher lows, converging trendlines).
This pattern broke down sharply around June 17, which typically signals bearish momentum.
2. Bear Flag/Range Consolidation:
After the drop, BTC entered a sideways consolidation (highlighted in a red box), forming a rectangular range between ~104,950 resistance and ~102,830 support.
This could be interpreted as a bear flag or a distribution phase, suggesting continuation of the prior downtrend.
3. Bearish Projection:
The blue zig-zag line with the downward arrow suggests the analyst expects a break below the 102,830 support.
If this happens, further downside is likely. The measured move target could be projected from the height of the range (~2,100 points) below the breakdown point.
Summary:
Short-Term Bias: Bearish
Key Support: 102,830
Key Resistance: 104,950
Next Move: Breakdown below 102,830 could lead to a drop toward ~100,700 or lower, if the bear flag confirms.
Would you like a trading idea or stop-loss/take-profit suggestions based on this pattern?

Bitcoin extended cycle, $120,000-$140,000 next july-augustBitcoin looks like its gonna be a good summer imo, too much people say it will a boring summer and we top in oktober-dec but what if we top in august and drop 50%, and sep-dec will be correction month, and we continue the bullrun end 2025 till q1 2026 and we print a top in q1 2026,

Bitcoin, Interest rates & Key fundamental points since 2021
The Growing question is just how much does the American Federal Reserve interest rate changes effect Bitcoin.
We can see how in 2022, it appears they did but from late 2022 and early 2023, it doesn't seem to.
Bitcoin began its rise even while rates were being put up.
The Fundimental Key points may have had more impact but again, there are moments were we can see something that should have been Great for BTC, had little effect and Visa Versa.
Has Bitcon Truly Broken away from being effected by the worlds "largest" economy ?
We are currently seeing the ever growing threat of WW3 and Rates being Kept artificially High by the US Fed Reserve. The EU Central banks has already reduced its rate twice while the USA remained with no change )
And Bitcoin remains stable.
And Bitcoins international adoption continues.
STACK SATS

BTCUSD potential double top patternOn the daily chart, BTCUSD forms a potential double top pattern. Currently, we can pay attention to the support near 100400. If it falls below, it is expected to continue to fall, and the downside target is 94000-98000 area.

BTCUSD H4 I Bearish Reversal Off the 50% FibBased on the H4 chart, the price is rising toward our sell entry level at 106,291.54, a pullback resistance that aligns with the 50% Fib retracement.
Our take profit is set at 103,781.90, a swing low support.
The stop loss is set at 109.135.79, an overlap resistance.
High Risk Investment Warning
Trading Forex/CFDs on margin carries a high level of risk and may not be suitable for all investors. Leverage can work against you.
Stratos Markets Limited (tradu.com ):
CFDs are complex instruments and come with a high risk of losing money rapidly due to leverage. 63% of retail investor accounts lose money when trading CFDs with this provider. You should consider whether you understand how CFDs work and whether you can afford to take the high risk of losing your money.
Stratos Europe Ltd (tradu.com ):
CFDs are complex instruments and come with a high risk of losing money rapidly due to leverage. 63% of retail investor accounts lose money when trading CFDs with this provider. You should consider whether you understand how CFDs work and whether you can afford to take the high risk of losing your money.
Stratos Global LLC (tradu.com ):
Losses can exceed deposits.
Please be advised that the information presented on TradingView is provided to Tradu (‘Company’, ‘we’) by a third-party provider (‘TFA Global Pte Ltd’). Please be reminded that you are solely responsible for the trading decisions on your account. There is a very high degree of risk involved in trading. Any information and/or content is intended entirely for research, educational and informational purposes only and does not constitute investment or consultation advice or investment strategy. The information is not tailored to the investment needs of any specific person and therefore does not involve a consideration of any of the investment objectives, financial situation or needs of any viewer that may receive it. Kindly also note that past performance is not a reliable indicator of future results. Actual results may differ materially from those anticipated in forward-looking or past performance statements. We assume no liability as to the accuracy or completeness of any of the information and/or content provided herein and the Company cannot be held responsible for any omission, mistake nor for any loss or damage including without limitation to any loss of profit which may arise from reliance on any information supplied by TFA Global Pte Ltd.
The speaker(s) is neither an employee, agent nor representative of Tradu and is therefore acting independently. The opinions given are their own, constitute general market commentary, and do not constitute the opinion or advice of Tradu or any form of personal or investment advice. Tradu neither endorses nor guarantees offerings of third-party speakers, nor is Tradu responsible for the content, veracity or opinions of third-party speakers, presenters or participants.

BTCUSD 6/18/2025Come Tap into the mind of SnipeGoat, as he gives you an outstanding Market Breakdown of Bitcoins current Price Action. Making his analysis based purely off of Technicals, & Market Structure.
_SnipeGoat_
_TheeCandleReadingGURU_
#PriceAction #MarketStructure #TechnicalAnalysis #Bearish #Bullish #Bitcoin #Crypto #BTCUSD #Forex #NakedChartReader #ZEROindicators #PreciseLevels #ProperTiming #PerfectDirection #ScalpingTrader #IntradayTrader #DayTrader #SwingTrader #PositionalTrader #HighLevelTrader #MambaMentality #GodMode #UltraInstinct #TheeBibleStrategy

Bitcoin the next store of ValueBitcoin as a store of value is not a new idea. I've been on this road a long time and my old posts are just timestamps of that.
Currently price is sitting on the Dec/Jan highs. It appears that which was resistance before could become support now.
The fact that the market reacts very fast to small market dips with fear seems like a good sign to me. Though only useful as an indicator in context. We did not break market structure and large buyers are still accumulating. Also retail interest stats like google search have not hit new all time highs. Though google specifically might be a bad metric as AI search is highly used now. There is still a risk of something breaking in US markets while rates stay up and Fed balance sheet is not growing. Though not clear what exactly would break. Kind of like stomping on an orange don't get caught up exactly where the peel breaks. QT is squeezing and you squeeze hard enough and pop. Even with them net buying 10 year US Treasury Bonds. It's still technically a QT environment. Last year bonds almost broke the banks before the Fed aloud those bonds to be listed full term value on the balance sheet. Effectively covering up the issue instead of fixing anything. (Bank Term Funding Program - BTFP)
Pros
Bitcoin has not yet rate seen US rate cuts
Bitcoin has not yet see a new wave of money printing
Fund managers suggesting 2% allocation which is no where close to being reached yet
Recurring institutional buyers, such as corporations adding Bitcoin to their balance sheets (e.g., Strategy).
Cons
Large leveraged holders will need to watch cash flows vs interest payments. In 2022 bear market this was easy for Micro Strategy now renamed Strategy. The reason profits were roughly 7x interest payments. In 2024 that has dropped to 5x. They started with a lot of cash flow and found themselves sitting on melting pile of cash. If Bitcoin holdings out grow the software income enough then finding the money for interest payments becomes a new challenge.
It's still not 100% clear long term how Bitcoin fits in a portfolio.
Most narrative seems like you keep it in a locked room where you celebrate your great
fortune that has no material benefits in your life. I think it's probably not that.
Is it just something people collect and lend against?
Act as a index for the greater crypto asset class that people rebalance?
Cash flow with cover calls?
Lend it out if Fiat fails it could act like gold being borrowed.
Important Questions:
What % allocation to Bitcoin makes sense to hold in a bear market?
How do you grow Bitcoin holdings in a bull market?
"This is not financial advice. These are my personal opinions and observations. Do your own research before making any investment decisions."

The chart illustrates a recent downtrendChart Overview
⚙️ Price Action:
The chart illustrates a recent downtrend, followed by consolidation near the current level of $104,933.
A bullish reversal structure is forming, marked by the label “Ch0CH” (Change of Character), which suggests a potential trend shift from bearish to bullish.
🧠
Liquidity Concept
:
The chart highlights a horizontal line labeled “Equal High Liquidity” around the $108,800 level.
This area suggests a liquidity pool where stop orders might be resting above the equal highs.
Market makers may drive price toward this area to collect liquidity before reversing or continuing.
📈
Projected Price Path
:
A white dotted line projects a possible bullish move:
First, a minor retracement or accumulation phase.
Then, an upward impulse aiming to take out the equal highs near $108,800.
🧩 Interpretation:
This chart implies a bullish outlook based on:
Break in bearish structure (Ch0CH).
Liquidity draw above equal highs.
Anticipation of smart money concepts (e.g., liquidity sweeps, inducement moves).

BTC on the Edge – Bounce or Break?🚨 BTC AT MAKE-OR-BREAK ZONE! 🚨
Chart by Mosilar 📊
🧠 Price is sitting on the major trend line + high-volume support around $104K 🔥
👀 A double top is in play — tension is building!
💣 Break below = potential dump to $102K
🚀 Bounce = possible rally back to $108K+
⚔️ Bulls & bears are in a standoff.
This level won’t hold forever—watch closely! 📉📈

BTCUSD: Nowhere near a top yet.Bitcoin remains neutral on its 1D technical outlook (RSI = 47.257, MACD = 443.000, ADX = 29.912) due to high volatility recently but the bullish long term trend is intact and even more so, hasn't yet started the year-end rally. The Mayer Multiple Bands have always priced a Cycle's Top on their red trendline so no matter how high that may seem from the current market price, the TP zone should be between the orange (2 Stdev above) and red (3 Stdev above) trendines. Minimum TP = 200,000 for this Cycle.
## If you like our free content follow our profile to get more daily ideas. ##
## Comments and likes are greatly appreciated. ##

Bitcoin Setup: Tight Risk, Solid UpsideBitcoin continues to trade within a strong uptrend.
Ideally, I’d prefer to see reduced volatility and stabilization on the daily chart for a cleaner entry. But overall, the current setup already looks attractive — so I’m entering now.
What I like is that for such a volatile asset, the stop-loss is relatively tight — just around -1.70%. The upside potential targets the previous high and beyond, offering 7.50%+.
Let’s go!

B/$The latest breakout of the top will give a good pullback, which is currently developing.
I think we will see a price below $100,000 again.
