BTCUSD: 1D MA50 and 100k form a strong support base.Bitcoin has turned neutral again on its 1D technical outlook (RSI = 45.783, MACD = 629.200, ADX = 20.857) and is about to get bearish as it hit its 1D MA50 today, erasing the gains of the last 3 days. The 1D MA50 has held two times since June 5th and another one might be what Bitcoin needs to justify the next rally. Besides this however, we got a heavier Support on the P1 trendline, which on the previous ATH (Dec 17th 2024) was a Resistance and since May 12th 2025 it turned into Support. Technically, as long as 100,000 holds, we expect a strong rebound into August that may repear the inverse of December 2024 - March 2025 (-31%) and rise by +31% (TP = 132,000).
## If you like our free content follow our profile to get more daily ideas. ##
## Comments and likes are greatly appreciated. ##
BITCOIN trade ideas

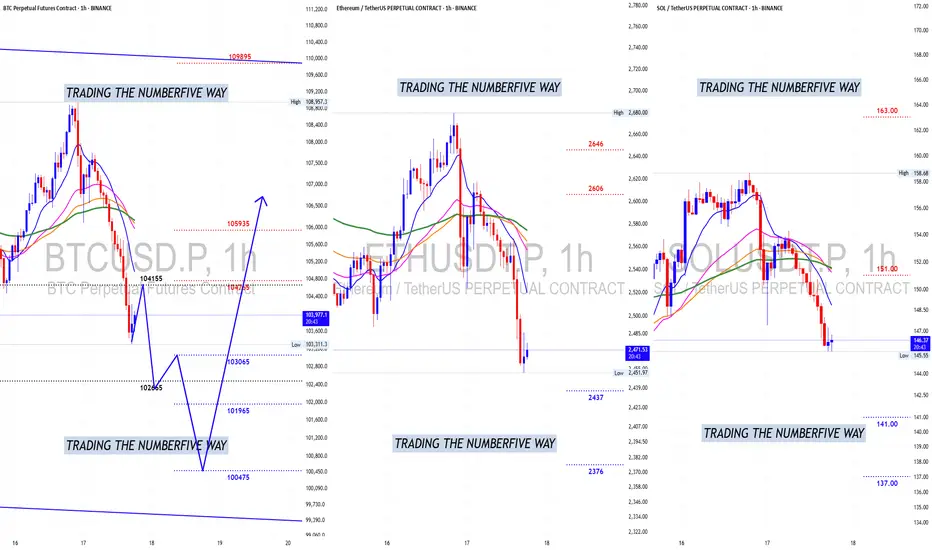
BITCOIN UPDATE: Not looking good for Bitcoin ladies and gentlemen . Its going down too fast and it just started the 1hr Bearish TIME Cycle, bears have plenty of TIME to do damage to the trend.
This is the drop that I was talking about the one that can cause serious damage to the trend.
Will see how it ends up at end of week.
BTC Trend Analysis and Trading Recommendations for TodayThe BTC market continues its sideways-down trend, with notably insufficient rebound momentum during the session. Although there were brief signs of stabilization in the early trading, bearish forces continued to exert pressure during the European session, and the index showed a staircase decline.
From the 4-hour chart analysis, the price once fell to touch the middle Bollinger Band support during the Asian session, followed by a technical rebound. However, the rebound strength was obviously weak, encountering strong resistance near the middle band. The current candlestick pattern presents a typical Dark Cloud Cover, the MACD indicator continues to release volume below the zero axis, with fast and slow lines in bearish alignment.
Technically, the price remains significantly pressured near the middle band, and the US session is likely to extend the existing downtrend. Investors are advised to maintain a bearish stance. If the price effectively breaks below the middle band support, the next target is targeted at the lower Bollinger Band. Strategically, fading rallies remains the preferred approach.
BTCUSD
sell@106500-106000
tp:105000-104000


ZONE SNIPER SETUP (BEARISH)BTC/USD Supply Zone Reaction Expected...!
Current price action is retracing toward a well defined supply zone between 107,016 and 108,576, an area of previous institutional selling. The expectation is a potential rejection from this zone, leading to a continuation of the broader downtrend.
If price taps into this supply and fails to break above, short opportunities become favorable targeting:
Intermediate support at 104,000.
Final target at 101,565, aligning with prior liquidity sweep.
Invalidation occurs on a strong close above 108,576.
#BTC/USD, #FOREX, @VeloraFXReal

BTCUSD 1DI invite you to look at the current situation example, where you can see a lower high formation that has been formed, which could potentially lead to a larger price correction and the formation of a lower low in one of the 3 potentially designated locations.

BTC/USD Analysis – Is the Pullback Just Beginning?Bitcoin has recently faced strong resistance at the $108,874 zone, a high-volume supply area identified by the LuxAlgo Visible Range. Price was rejected sharply, and now BTC is trading at $104,746 after a -1.32% move down.
---
🔍 Technical Breakdown:
🟥 Supply Zone:
$106,800 – $108,800
Price has tested this area multiple times but failed to break above it.
🟦 Key Support Zones to Watch:
1. $94,334: Mid-level support; if broken, it confirms bearish strength.
2. $77,957 – $80,000: Strong demand zone; potential reversal or consolidation area.
📉 Bearish Signals:
Lower highs forming after rejection at resistance.
Red arrows indicate potential drop targets.
Volume fading on recent rallies – suggesting weakening bullish momentum.
---
🎯 Potential Trading Plan:
🔻 Short Setup:
Entry: $104,500 – $105,000 (below current structure)
TP1: $94,300
TP2: $80,000
SL: $106,800 (above resistance zone)
🟠 Long Setup (if price reaches demand):
Entry: $78,000 – $80,000
SL: $76,000
TP: $94,000 / $100,000
---
⚡News Catalyst:
⚠️ Major U.S. and global economic events expected soon. Be ready for volatility spikes (icons indicate calendar impact).
---
📊 What I'm Watching:
Volume divergence
Price reaction to $94k level
Fed announcements and macro impact on crypto
---
💬 Do you think BTC will bounce from $94k or head to $80k?
Comment below your trade setup 👇
---
🔖 Hashtags for Reach:
#BTCUSD #BitcoinAnalysis #CryptoTrading #SupplyAndDemand #LuxAlgo #BTCShort #PriceAction #BitcoinCrash #CryptoTA #BTCTradeSetup #tradingviewcommunity
---

₿itcoin: Directly or with a Detour?!Under our primary scenario, Bitcoin remains on track to climb into the upper blue Target Zone between $117,553 and $130,891 during green wave B. The key question at this stage: will the crypto giant head straight for the zone – or take a detour below the $100,000 level first? Either path remains structurally consistent with the broader outlook. Once wave B concludes, we expect a pullback to unfold in wave C, with the low of that move – and the bottom of orange wave a – anticipated in the lower blue Target Zone between $62,395 and $51,323. From there, orange wave b should initiate a corrective rally, likely rebounding toward the $100,000 mark. This would set the stage for the final leg down in blue wave (ii). Meanwhile, our alternative scenario remains intact on the 8-hour chart. This 30% likely scenario suggests Bitcoin is still advancing within blue wave alt.(i) , rather than correcting in wave (ii). A confirmed breakout above $130,891 would validate this outcome.
📈 Over 190 precise analyses, clear entry points, and defined Target Zones - that's what we do.

BTCUSD GOING LONG AFTER AN UPWARD SHIFTBTC has recently broken its last lower timeframe High, shifting market structure and indicating Buyers are currently in control.
This break opened up a clear Demand Zone below, a small base or last bearish candle before the rise, which is a key area where unfulfilled buy orders may be resting.
Price is likely to retrace back into this Demand Zone to fill those orders. Once it reaches this area, we expect buying pressure to resume and push price upward, honoring the imbalance left by the rise.
Entry:
I’m looking to buy from this Demand Zone on a pullback, adding to go long when price enters this area.
This lets me enter at a discount price while trading in direction of the newly established upward momentum.
Target:
The first Target Profit (TP) is set at the next supply Zone above, where selling pressure might emerge.
Stop Loss:
To control risk, the Stop Loss (SL) is placed just below the demand Zone.
If price drops below this area, it would invalidate the demand’s ability to hold, signaling a potential reversal.
✅ Summary:
• Market has shifted to bullish after breaking last high.
• Demand Zone below is a key area to watch for buying opportunities.
• Buy upon retracement into Demand, with Stop Loss below and Target at supply above.

Bitcoin Strategic Compression, ETF Inflows and Powell’s Shadow.⊢
⟁ BTC/USD - Binance - (CHART: 12H) - (June 17, 2025).
⟐ Analysis Price: $105,324.51.
⊢
⨀ I. Temporal Axis – Strategic Interval – (12H):
▦ EMA13 – ($106,094.47):
∴ The arcane speed line was briefly reclaimed but lost again in the latest candle close;
∴ Price has consistently failed to close above EMA13 since June 13th, indicating weakening momentum;
∴ It now acts as primary dynamic resistance in the 12H structure.
✴️ Conclusion: EMA13 has been rejected. Bearish pressure remains in control.
⊢
▦ EMA44 – ($105,907.07):
∴ Price is currently below EMA44, though recent candles show no strong bearish conviction;
∴ This level functions as a neutral battleground - a true trend emerges only with decisive close above or below;
∴ The slope remains positive, preventing immediate breakdown.
✴️ Conclusion: EMA44 is the structural balance line. Below it, weakness persists.
⊢
▦ VWAP (Session) – ($106,117.67):
∴ VWAP sits above current price, reflecting rejection of institutional value;
∴ All recent attempts to reclaim VWAP failed, signaling lack of dominant buy-side volume;
∴ Confluence with EMA13 and Donchian upper band creates a unified technical ceiling.
✴️ Conclusion: Institutional control remains absent. Value zone denied.
⊢
▦ Donchian Channel (20) – ($106,690.95 / $102,854.49):
∴ Bands remain narrow, and price consolidates between mid-channel and the lower range;
∴ Upper band has been precisely respected for multiple sessions;
∴ This signals imminent volatility release from compression.
✴️ Conclusion: Volatility is fully compressed. Expansion is near.
⊢
▦ Volume - (MA20: 154):
∴ Volume remains below the 20-period moving average;
∴ No strong buying or selling pressure confirms indecision;
∴ Market stands in strategic silence.
✴️ Conclusion: Low activity zone. Observation mode prevails.
⊢
▦ Stoch RSI (3,3,14,14) – (21.38 / 27.27):
∴ Oscillator is crossing upward from oversold, but with weak momentum;
∴ Attempt to recover above 40 still incomplete;
∴ Risk of fakeout unless next candle confirms with bullish volume.
✴️ Conclusion: Reversal signal is weak. Watch for trap conditions.
⊢
▦ MFI (14) – (31.86):
∴ Money flow index stays in low liquidity zone - no signs of accumulation from large players;
∴ No clear bullish divergence, yet no panic selloff either;
∴ The flat trajectory since June 10 confirms institutional disengagement.
✴️ Conclusion: Capital remains cautious. No inflow to trigger reversal.
⊢
🜎 Strategic Insight — Technical Oracle:
∴ Indicators show compression, rejection at $106K and lack of institutional momentum;
∴ Price structure is neutral-bearish with volume confirming indecision;
∴ A breakout would only be valid with strong candle body and +180 BTC/12H volume.
✴️ Conclusion: Tactical patience advised. Await true breakout with confirmation.
⊢
∫ III. On-Chain Intelligence – (Source: CryptoQuant):
▦ Exchange Inflow Total – (All Exchanges):
∴ Total BTC inflows remain below 10K/day, well beneath panic thresholds;
∴ No spikes above 50K BTC since early April - aligns with neutral market conditions;
∴ This reflects dormant whale behavior and no visible distribution phase.
✴️ Conclusion: The market is in structural silence. No signs of capitulation.
⊢
▦ Exchange Inflow Mean = (MA7) – (All Exchanges):
∴ The 7-day moving average of inflow size dropped to ~0.4 BTC - a historic low;
∴ Indicates retail-dominant transactions, not whales;
∴ Precedents show this pattern often occurs before breakout events.
✴️ Conclusion: Institutional wallets remain inactive. Momentum awaits external ignition.
⊢
▦ Spot Taker CVD - (Cumulative Volume Delta, 90-day):
∴ Buyers still hold slight dominance, but the curve is flattening;
∴ This signals demand exhaustion and growing equilibrium;
∴ Historically precedes redistribution or longer sideways action.
✴️ Conclusion: Spot market is neutralizing. Demand fades. No clear strength.
⊢
🜎 Strategic Insight - On-Chain Oracle:
∴ All on-chain indicators confirm weak momentum, low inflows, and diminishing spot demand;
∴ There’s no signal of heavy sell pressure - but also no engine for rally;
∴ This is the seal of silence: light flows, thin volume, no imbalance.
✴️ Conclusion: Market waits for external driver. Watch for catalyst.
⊢
⧉ IV. Contextvs Macro–Geopoliticvs – Interflux Economicus:
▦ Middle East Tensions – Israel / Iran:
∴ Dow and S&P futures drop as evacuation alerts from Tehran raise global concern - (InfoMoney);
∴ Crude oil rises up to +2% - markets brace for supply disruption via Hormuz - (CryptoSlate);
∴ Global capital flows to Treasuries and gold, reducing liquidity in risk-on assets like BTC.
✴️ Conclusion: Geopolitical risk increases macro fear. Bitcoin faces risk-off inertia.
⊢
▦ ETF Activity vs Macro Outlook:
∴ Despite $1.7B ETF inflows last week, price failed to hold key resistances - (CryptoSlate);
∴ This divergence reflects growing fear and fragile confidence in crypto exposure amid global tension;
∴ Institutional demand is present, but impact is diluted by macro noise.
✴️ Conclusion: ETF flows bring no clear edge under macro instability.
⊢
▦ Fed Chair Powell (Upcoming):
∴ Jerome Powell will speak on June 19 - expected to comment on rate pause and forward guidance - (Cointelegraph);
∴ Retail data weakens U.S. outlook, but Fed’s stance remains cautious - (FXStreet);
∴ The speech will likely reset volatility across all assets.
✴️ Conclusion: Powell’s message is the next global pivot point. Market waits.
⊢
⚜️ 𝟙⟠ Magister Arcanvm – Vox Primordialis!
⚖️ Wisdom begins in silence. Precision unfolds in strategy.
⊢
⊢
⌘ Codicillus Silentii – Strategic Note:
The current bias is neutral with a bearish weight;
No validated entry present at this time;
Volume must confirm any breakout attempt;
The Seal of Silence remains active - we watch, not react.
⊢

CHECK BTCUSD SIGNAL READ CAPTAINbtcusd sell now ✅
entry point (105550) (105400)
TAKE PROFIT 1: (105000)
TAKE PROFIT 2: (104250)
LAST TARGET (103500)
STOP LOSS (106200)

Elliot Wave Count Bitcoin - BTCElliot Wave count BTC. Last wave up could be 1st of 5th wave, but think it's a B wave, in expanded flat wave B can take on an impulsive structure and consist of five waves, allowing it to rise above the starting point of wave A. Supported by Elliot Wave count in Equity where probably wave 5 is also placed. And by latest lower high what could be start of market structure change. Invalidation above more or less 113-116k. Fib.time 0.66 gives turning point on July 6th in confluence with end of wedge. World is mega bullish with lot of fresh Longs (big-time in ETF's) waiting for overnight millions. Lets see how this count works out.

BTCUSD bullish breakout consolidation support at 103,620Trend Overview:
Bitcoin BTCUSD remains in a bullish trend, characterised by higher highs and higher lows. The recent intraday price action is forming a continuation consolidation pattern, suggesting a potential pause before a renewed move higher.
Key Technical Levels:
Support: 103,620 (primary pivot), followed by 101,770 and 100,140
Resistance: 109.830 (initial), then 113,960 and 117,390
Technical Outlook:
A pullback to the 103,620 level, which aligns with the previous consolidation zone, could act as a platform for renewed buying interest. A confirmed bounce from this support may trigger a continuation toward the next resistance levels at 109,830, 113,960, and ultimately 117,390.
Conversely, a daily close below 103,620 would suggest weakening bullish momentum. This scenario would shift the bias to bearish in the short term, potentially targeting 101,770 and 100.140 as downside levels.
Conclusion:
Bitcoin BTCUSD maintains a bullish structure while trading above the 103,620 support. A bounce from this level would validate the consolidation as a continuation pattern, with upside potential toward the 109,830 area. A breakdown below 103,620, however, would invalidate this view and suggest deeper corrective risk.
This communication is for informational purposes only and should not be viewed as any form of recommendation as to a particular course of action or as investment advice. It is not intended as an offer or solicitation for the purchase or sale of any financial instrument or as an official confirmation of any transaction. Opinions, estimates and assumptions expressed herein are made as of the date of this communication and are subject to change without notice. This communication has been prepared based upon information, including market prices, data and other information, believed to be reliable; however, Trade Nation does not warrant its completeness or accuracy. All market prices and market data contained in or attached to this communication are indicative and subject to change without notice.

HelenP. I Bitcoin will continue to move up inside triangleHi folks today I'm prepared for you Bitcoin analytics. After rebounding from the support level, the price initially showed strength and moved upward. However, the bullish momentum was short-lived, and the price began a downward correction, forming a well-defined descending channel. During this decline, the price dropped below the support zone, confirming short-term bearish dominance. Despite this breakdown, bulls regained control, and the price started forming a series of higher lows, resulting in the development of a symmetrical triangle. This structure signals compression and potential preparation for a breakout. The current price action confirms that BTC is now recovering within this triangle, supported by the upward trend line drawn from the recent lows. Given the strength of this recovery and the stabilization above the support zone, I expect the price to make a small correction and then continue climbing toward the resistance level at 110000. That’s why my current goal remains focused on this level, representing both a psychological and technical barrier aligned with previous local highs. If you like my analytics you may support me with your like/comment ❤️
Disclaimer: As part of ThinkMarkets’ Influencer Program, I am sponsored to share and publish their charts in my analysis.

Current StructureHere is the 4H and 1D structures. Multiple smaller pennants within larger pennants. IMO, this is forming 106 as the base for the next, and possibly last, leg higher for this present cycle. Will be fun to watch the next few weeks to months play out.
Hold fast. Keep faith. Remain vigilant.

BTCUSD Interlocking Shapes H4 TFDescending wedges and channels usually breakout to the upside while ascending wedges and channels usually breakout to the downside. We currently have an ascending channel on the H4 TF. But as usual, nothing is confirmed until a clear breakout and retest.

BTC 4H: Triangle Breakout - Next Leg Up?Bitcoin (BTC/USD): 4H Triangle Breakout Signals Bullish Continuation
Hello TradingView,
On the 4-Hour (4H) timeframe, Bitcoin has convincingly completed a significant triangle consolidation pattern. This pattern, which typically signals a build-up of energy, has now resolved with a clear bullish breakout.
The price action over the last few days has been coiling, and we're now seeing strong confirmation as BTC pushes decisively above the triangle's upper trendline, ideally supported by robust volume. This indicates that the recent period of indecision has ended, and bulls are regaining control, setting the stage for the next upward move.
Crucial Invalidation Point: For this bullish setup to remain valid, Bitcoin must firmly hold above $102,664.54. A sustained close below this level on the 4H chart would invalidate our thesis and suggest that a deeper correction or re-evaluation is needed.
Outlook: With the breakout confirmed, we anticipate a push towards immediate resistance levels and potentially a retest of recent higher price points. Always manage your risk, and happy trading!
⚠️ Disclaimer:
Not financial advice. For educational and informational purposes only.
Do your own research (DYOR). Trading involves substantial risk; you can lose money.
Past performance is not indicative of future results.

Bitcoin still ranging just under ATH line but be RealisticQuick post to show you very simply that the Odds are against a push above that Blue ATH right now.
The chance of a Dip is higher than the chances of a push higher.
That does not mean to say it will not happen, just be ready in case it does not happen
Charts do not lie.

BTC IS BORINGNot much to see here – Bitcoin continues to range quietly between support at ~$100,700 and resistance at $112,000. Price is hovering just above the 50-day moving average, which has flattened out, signaling a pause in momentum rather than a directional shift.
The recent higher low around $100,700 remains the key structural level to watch. As long as that zone holds, the bullish bias technically remains intact, but the lack of follow-through toward the highs suggests weakening momentum. Volume continues to decline, which is typical during sideways consolidation and often precedes expansion – but there's no sign of that happening yet.
A breakout above $112K would likely trigger momentum buyers, while a breakdown below $100K could put $92,800 and even $88,800 back on the table. Until then, it's just rangebound chop – and patience is the only real trade.
Nothing broken, nothing confirmed – just a waiting game for now.

CHECK BTCUSD SIGNAL READ CAPTAINbtcusd) SELL zone
(trade satup)
entry point (106455) to (106145) 📊
first target (105515)📊
2nd target (104890) 📊
last target (104370) 📊
stop loss (106825)❌

BITCOIN Is exactly where it should be this time on every Cycle!Bitcoin (BTCUSD) has made a new All Time High (ATH) last month, following the April 2025 rebound on the 1W MA50 (blue trend-line). No matter how odd this price action may look to some, BTC is simply replicating the pattern it has during every past Cycle around this time of its final year.
As you can see, besides April 2025, it made 1W MA50 pull-backs and rebounds on June 2021, July 2017 and July 2013. The consistency is remarkable and since we are already now half-way through June, historically Bitcoin only went upwards!
In fact, those pull-backs have been the strongest the market saw before the Cycles peaked on each and every occasion. Two Cycles peaked just above the 2.0 Fibonacci extension while in 2017 it peaked a little below the 5. Fib ext. This indicates that the minimum Cycle Top we can be expecting towards the end of the year is $160000 (marginally below the 2.0 Fib ext).
Many studies point towards the same Target. Do you think it's inevitable? Feel free to let us know in the comments section below!
-------------------------------------------------------------------------------
** Please LIKE 👍, FOLLOW ✅, SHARE 🙌 and COMMENT ✍ if you enjoy this idea! Also share your ideas and charts in the comments section below! This is best way to keep it relevant, support us, keep the content here free and allow the idea to reach as many people as possible. **
-------------------------------------------------------------------------------
💸💸💸💸💸💸
👇 👇 👇 👇 👇 👇

BTC/USD is bearish, after a small bull runFrom the chart, you can see that btc/usd is about to drop further..
wait for full formation of bearish flag and you can benefit the market when its confirmed that's about to fall.

