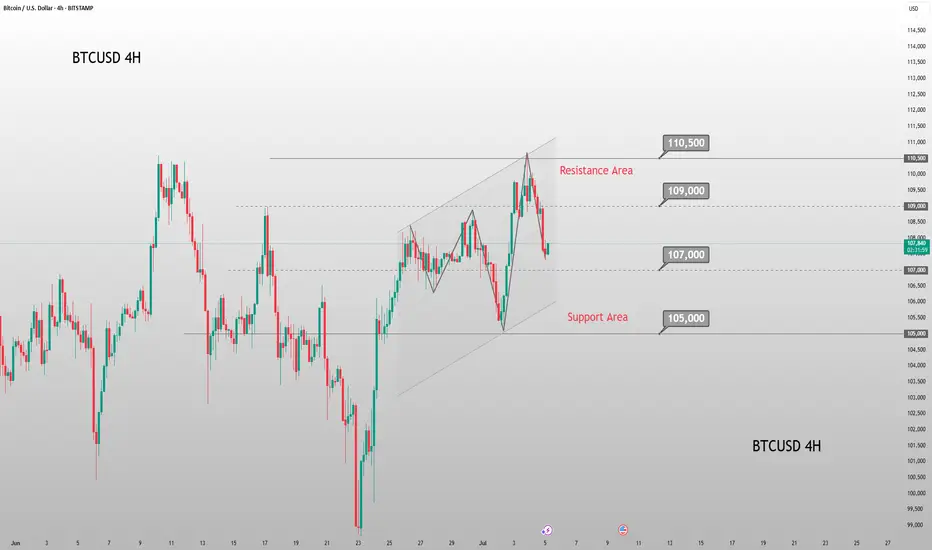
BTCUSD Heading Yesterday's Resistance Zone, Price Will React After a recovery to 107.500 BTCUSD is recovering to the upside again towards the resistance of 1.09500. This is the convergence zone between the trendline and yesterday's high. BTCUSD price may correct lower from this zone. Then find some new bullish momentum at strong support zones towards an all-time high.
Support 107.500 - 105.300
SELL Trigger: Break bellow 107.500
Resistance: 109.500- 110.500
Wish you successful trading, leave your comments about BTC.
BITCOIN trade ideas

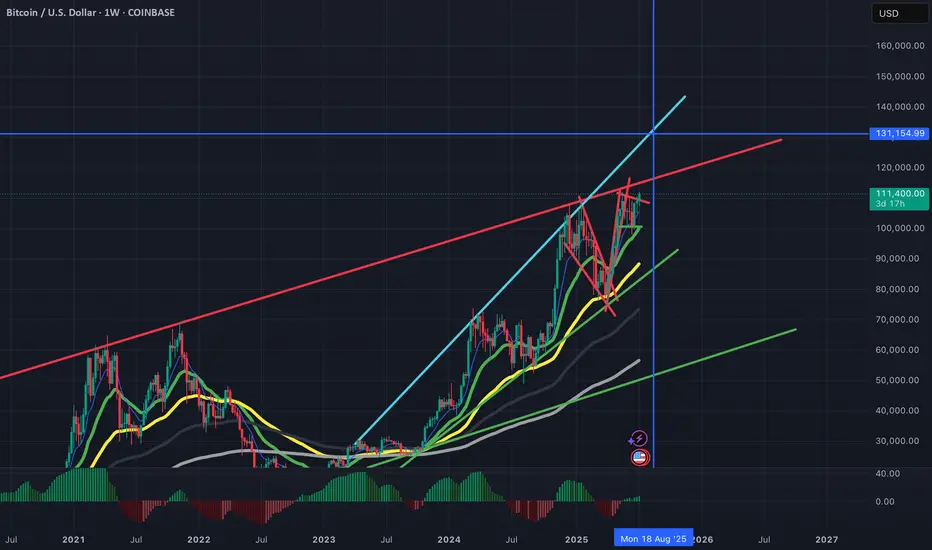
Bitcoin -> The bullrun is not over!📣Bitcoin ( CRYPTO:BTCUSD ) is still totally bullish:
🔎Analysis summary:
A couple of months ago Bitcoin broke above the previous all time high. This was basically just the expected creation of new highs, perfectly following the underlying cycles. With respect to the long term rising channel formation, this bullrun on Bitcoin is just starting.
📝Levels to watch:
$100.000
🙏🏻#LONGTERMVISION
Philip - Swing Trader

Weekend BTC Trend Analysis and Trading SuggestionsLet's review this afternoon's market performance. The BTC price, as we anticipated, rebounded to around 109,000 in the afternoon before plummeting sharply. Living up to "Black Friday", this violent drop was well within our expectations. In the afternoon's live trading, we also reminded everyone that as long as there was a rebound to the upper zone, it was a good opportunity to go short. This drop has created a space of nearly 1,500 points. Currently, the BTC price has pulled back to around 107,800.
From the current 4-hour K-line chart, after a strong upward surge, the market encountered significant resistance near the upper track of the Bollinger Bands. As bullish momentum gradually faded, the price started to come under pressure and decline, suggesting that the short-term upward trend may come to a temporary halt. At present, the market has recorded multiple consecutive candlesticks with large bearish bodies. The price has not only effectively broken below the key support level of the Bollinger Bands' middle track but also caused the Bollinger Bands channel to switch from expanding to narrowing, indicating that market volatility is decreasing. In terms of trading volume, it showed a moderate increase during the price pullback, which further confirms the authenticity of the bearish selling pressure.
BTCUSD
sell@108000-1085000
tp:107000-106000
Investment itself is not the source of risk; it is only when investment behavior escapes rational control that risks lie in wait. In the trading process, always bear in mind that restraining impulsiveness is the primary criterion for success. I share trading signals daily, and all signals have been accurate without error for a full month. Regardless of your past profits or losses, with my assistance, you have the hope to achieve a breakthrough in your investment.
BTCUSD TRADES SIDEWAYS DUE TO A LACK OF DRIVING FACTORS
BTCUSD has been moving within sideways since the end of last week. This week there will be lack of news. The first significant will be FOMC minutes tomorrow, which will definitely affect the DXY index and bitcoin. So before that time I expect that the sideways dynamic of the asset will remain.
So, nothing to trade? Not really
We may consider entering long positions at a current price with a take profit nearby 0.786 Fibo and a stop loss just below the previous low:
🔼 a market buy order at 108078.50 with
❌a stop loss at 107389.50 and
🤑a take profit at 109176.65
After that I expect the price to rebound from the upper border of the triangle. Maybe will consider another long entry.

Congratulations to those of us that took this trade we just hit Congratulations to those of us that took this trade we just hit take profit now

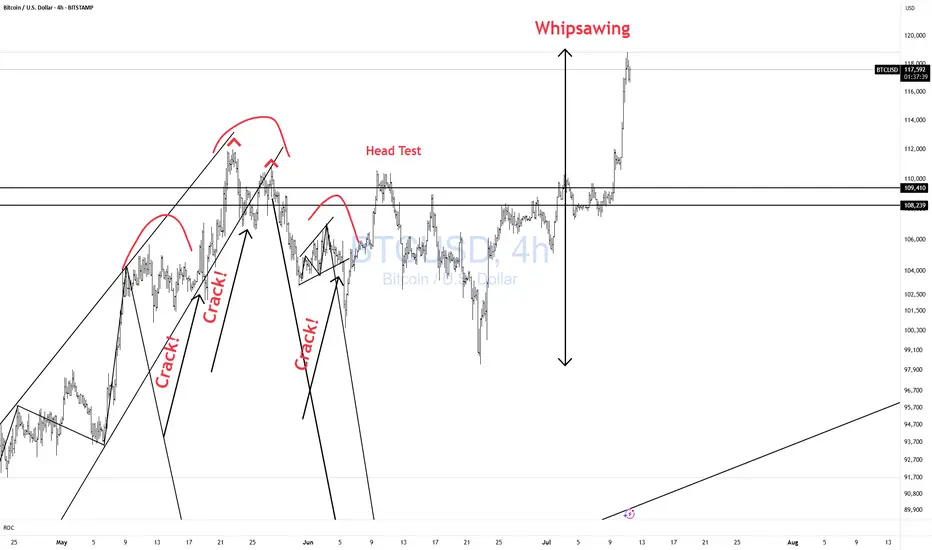
BTCUSD Whipsawing! CAUTION!Bulls CAUTION! Price is whipsawing all over the place.
Better to be out of the market wishing you were in than in wishing you were out!! Don't chase!!
$BTC Breakout Confirmed – Next Stop: $120K? CRYPTOCAP:BTC Breakout Confirmed – Next Stop: $120K?
I told you — if BTC closes above the box, a breakout was imminent… and it just confirmed!
Price has cleanly closed above the $110K resistance zone after multiple rejections — this breakout signals strong bullish momentum. 📈
Next stops: $120K and beyond
Breakout buyers are now in control — as long as BTC stays above $110K.
BuyAdditional Entry
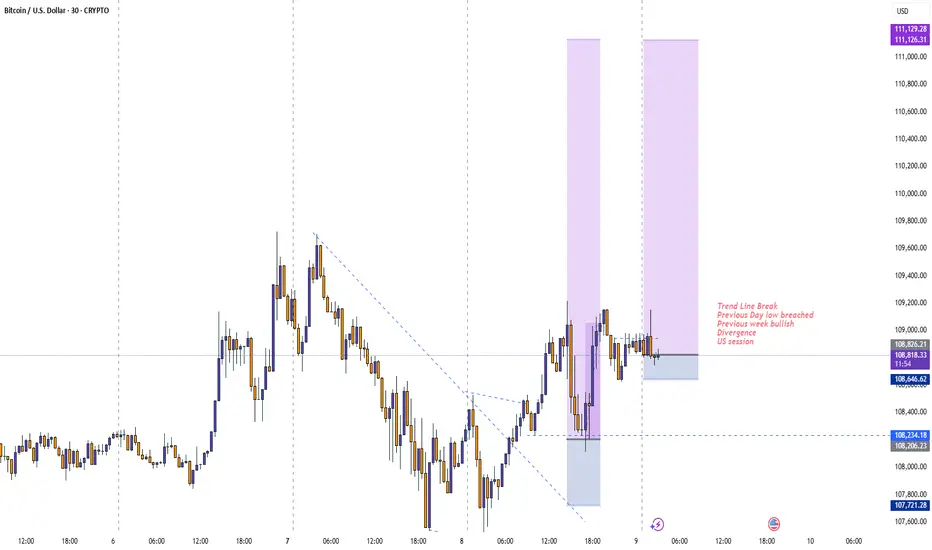
Trend Line Break
Previous Day low breached
Previous week bullish
Divergence
US session
Trade
Manage
Smile
Btc to 130k resistance Btc to 130k resistance level to watch. Confidence is high aligned with ripping higher stock market.
Trading Recommendations for BTC/USDBitcoin and Ethereum are demonstrating stable growth amid new forecasts regarding the number of interest rate cuts expected from the Federal Reserve this year. Another dovish stance from the Fed Chair and criticism from Trump over Powell's inaction triggered buying on the U.S. market, which also impacted the cryptocurrency market.
Investor enthusiasm is fueled by expectations of more accessible financial resources, which typically drive capital into riskier assets like cryptocurrencies. Bitcoin, as the flagship of the crypto market, traditionally reacts first to changes in macroeconomic conditions. However, one should not forget the inherent volatility of the crypto market. Even positive macro signals do not guarantee sustainable growth-especially as Bitcoin has been hovering near its historical highs, where buyer interest has been waning recently. It's essential to c consider technical factors, market sentiment, and regulatory risks, all of which can significantly influence price dynamics.
Meanwhile, alongside Strategy, Japanese investment company Metaplanet purchases Bitcoin for its balance sheet. Data shows the company acquired an additional 1,234 BTC for approximately $132.7 million just one day after announcing a $515 million capital raise to fund its Bitcoin treasury strategy. The Tokyo-listed firm stated that this latest purchase at around $107,557 per Bitcoin raised its total holdings to 12,345 BTC. The company holds about $1.3 billion worth of Bitcoin based on current market prices. This makes Metaplanet the seventh-largest publicly listed corporate holder of Bitcoin, surpassing Tesla, which holds 11,509 BTC.
As for intraday strategy in the cryptocurrency market, I will continue to act based on any major pullbacks in Bitcoin and Ethereum, expecting the medium-term bullish market to persist
For short-term trading, the strategy and conditions are described below.
Buy Scenario
Scenario #1: I will buy Bitcoin today if it reaches the entry point around $106,227 aiming for a rise to $ 107,042. Near $107,042 I plan to exit the long position and sell on pullback. Before buying on a pullback, ensure the 50-day moving average is below the current price and the Awesome Oscillator is above zero.
Scenario #2: If the market does not react to a breakout, Bitcoin ca also be bought from the lower boundary at $105,039 with targets at $106,221 and $106,748.
Sell Scenario
Scenario #1: I will sell Bitcoin today if it reaches the entry point around $107,695 aiming for a drop to $106,008. Near $106,008, I plan to exit the short position and buy on a bunce. Before selling on a breakout, ensure the 50-day moving average is above the current price and the Awesome Oscillator is below zero.
Scenario #2: Bitcoin can also be sold from the upper boundary at $106,753 if there is no market reaction to a breakout, targtion the $104,651 and $103,888 levels.

BITCOINBTC is showing strong bearish momentum. Price has broken below key support and is forming lower highs and lower lows, indicating continuation of the downtrend.
Until we see a clear reversal pattern or reclaim of resistance levels, I expect further downside.

HEAD AND SHOULDERThe bearish head and shoulders pattern in crypto is a classic technical analysis signal that suggests a potential trend reversal from bullish to bearish. Here's how it works:
Structure of the Pattern.
Left Shoulder: Price rises, then dips.
Head: Price rises higher than the left shoulder, then dips again.
Right Shoulder: Price rises again, but not as high as the head, then dips.
Neckline: A support level connecting the lows after the left shoulder and head. When price breaks below this line, it confirms the bearish signal.
The bullish head and shoulders pattern—more accurately called the inverse head and shoulders—is a powerful signal that a downtrend may be reversing into an uptrend. It’s the mirror image of the bearish version and is closely watched by crypto traders for potential buying opportunities.
Structure of the Inverse Pattern
Left Shoulder: Price dips, then rises slightly.
Head: Price dips lower than the left shoulder, then rebounds.
Right Shoulder: Price dips again, but not as low as the head, then rises.
Neckline: A resistance level connecting the highs after the left shoulder and head. A breakout above this line confirms the bullish reversal.

Bitcoin more high opportunity BTCUSD 4H | New Highs in Play
Price has broken structure with strong momentum. A bullish retest near 116,000–116,800 could trigger the next leg up toward the 120,000–121,000 target zone. Watching for price reaction at demand to confirm continuation.

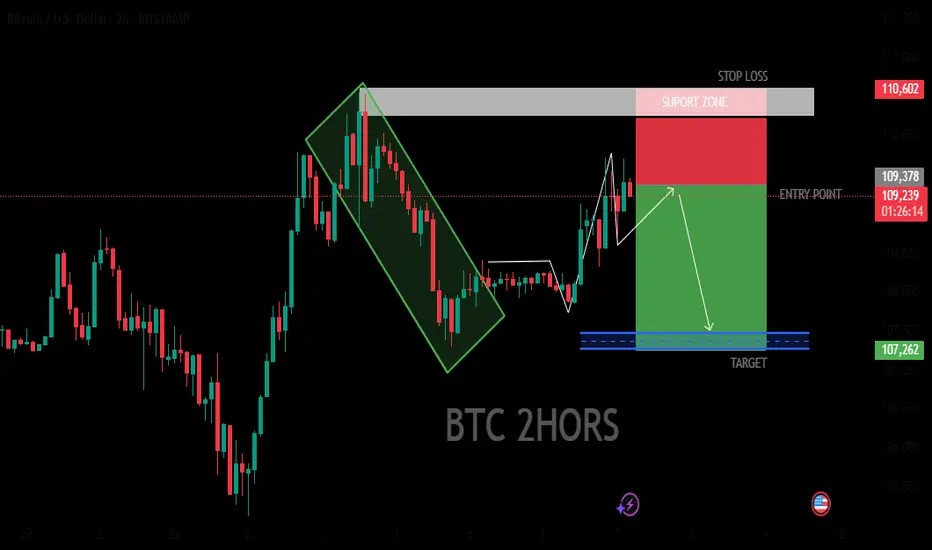
BTC 2HORS BEARISH ANALYSIS
The image suggests that the trader is using technical analysis to identify potential trading opportunities in the Bitcoin market. The use of specific patterns and indicators, such as the descending triangle and target price level, indicates a systematic approach to trading. However, it's important to note that trading carries inherent risks, and past performance is not necessarily indicative of future results.
Bitcoin Elliot Wave CountBullish for the next 90 days
Blow off top thesis
Pump into rate cuts and Big Beautiful Bill.

111-112 Resistance LevelOnce BTC breaks above the 111-112 resistance level and flips it into support we should see price run to 125+ rather quickly. If history echoes, price discovery could easily touch 150, if not 175-200. Also, we should see BTC entering the "euphoric" phase of the cycle around the week of Aug 18th. Fun days are ahead :) remain vigilent!

BTC 1 HOUR BEARISH ANALYSISbitcon market may be go for sell side. the also has lines and lable to help traders anderstand the market.

BTCUSD · 3D — Bearish Divergence + Volume Drop Suggest Pullback
🧠 Setup Overview
Bitcoin is showing signs of exhaustion after a parabolic rally:
Bearish divergence is visible on the 3D RSI — price made higher highs while RSI made lower highs.
Volume is shrinking with each push up, suggesting buyer momentum is fading.
Price is pressing into all-time highs without conviction, signaling potential for a pullback.
🔻 Downside Targets
Target 🎯 Level Why It Matters
Target 1 $92,300 (50% Fib) Midpoint of last impulse + first strong demand area.
Target 2 $82,500 (61.8% Fib) Volume-profile support + key confluence zone.
🔎 What Confirms the Setup?
Breakdown below $108K structure
Daily close below $105K with increasing volume
RSI losing midline support = momentum shift confirmed
❌ Invalidation
Daily close > $112K with strong volume = idea invalid
Would suggest continuation toward blue-sky breakout
✅ Summary
Bearish divergence + volume drop = classic topping signals
Risk is well-defined, with Fib-backed targets offering clean R:R
Trade cautiously — momentum is fading, not gone yet
📛 Disclaimer: This is not financial advice. Do your own research and manage risk according to your plan.
#Bitcoin #BTC #CryptoAnalysis #BearishDivergence #RSI #VolumeProfile #Fibonacci #TradingView

Are we breaking this resistance ? or not yet? BTC is currently trading around $108,000, sitting at a key trendline support zone. The market is at a critical decision point, with two main scenarios: a bullish breakout or a rejection and move lower.
🔍 Technical Structure Overview
Chart timeframe: 1D (Daily)
Major support: $104,000 (horizontal) & ascending trendline (cyan)
Major resistance: $110,000–$112,000 zone
Long-term resistance channel: Yellow trendline capping BTC near $140,000
Volume: Currently low — needs a spike to confirm any breakout
🟢 Bullish Scenario
BTC bounces off the ascending trendline (current zone)
A strong breakout above $112,000 with volume would confirm a Potential Breakout Bounce #2
Targets:
$120,000 (short-term)
$130,000–$140,000 (upper yellow trendline in long-term channel)
✅ Confirmation needed:
Daily candle close above $112K with high volume
RSI rising above 50, MACD bullish crossover would help confirm move
🔴 Bearish Scenario
BTC fails to hold the trendline and breaks below $104,000
This confirms a rejection and a likely move toward $96,000
If momentum weakens, this could turn into a deeper correction or sideways consolidation
BTC is in a tight consolidation range, nearing a major decision point. A breakout above resistance could send prices to new local highs, while failure to hold trendline support will likely trigger a correction. Watch key levels carefully and let volume + momentum indicators confirm your trade.

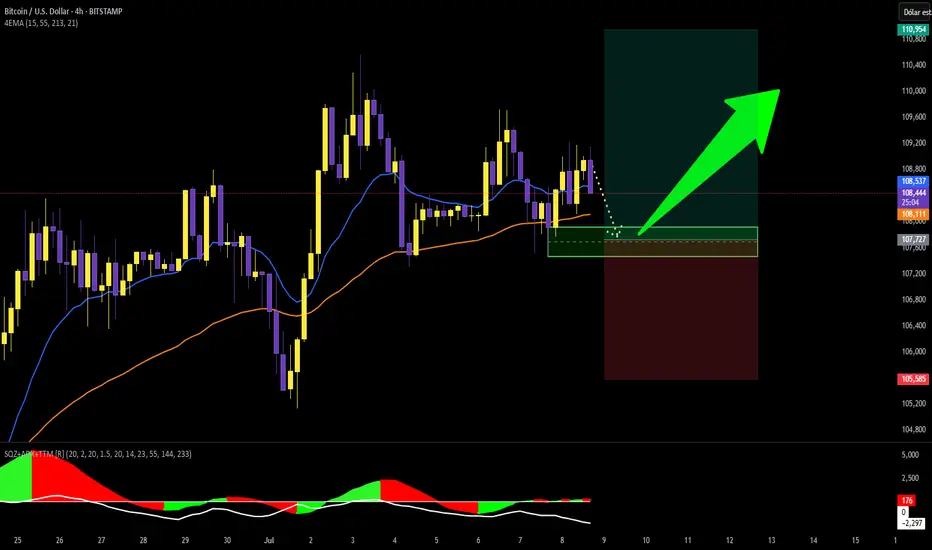
An entry for a long position incoming
It looks like a good entry point for a long position.
Close the position once the price hits the SR above or the Road level
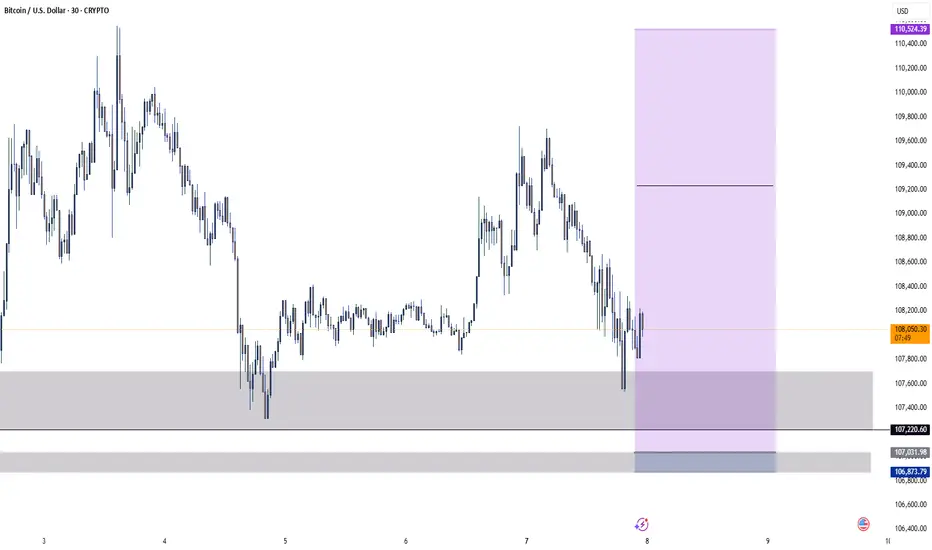
BTC/USDT, 4H chart, Futures - Bullish projection.The price of BTC is reaching points where the most likely direction is upwards, looking for areas from 107,900 to 107,400 would be long entries in the 4H futures chart with a stop at 2%
BTC Just Hit the Brakes – Is the Pump Over?Bitcoin just tagged the upper Bollinger Band on the 1H chart while Stoch RSI maxed out and crossed down — a classic signal of volatility exhaustion combined with a momentum slowdown.
Technical Breakdown:
Bollinger Band Top: Price tapped the upper band, often a sign of near-term overextension
Overbought Stoch RSI (July 9th): RSI hit 97+ and flipped — momentum may be shifting
Cooling Phase? Price is stalling inside a tight range with low follow-through
arget Zone: $109K or BB midline as a possible mean reversion area
This is a high-probability zone for a pullback setup or a more attractive long opportunity if momentum resets.
