CHECK BTCUSD SIGNAL READ CAPTAINbtcusd sell now ✅
entry point (107.650) (107.450)
TAKE PROFIT 1: (106.800)
TAKE PROFIT 2: (105.800)
LAST TARGET (105.000)
STOP LOSS (108.400)
BITCOIN trade ideas

₿itcoin: Continuing B WaveBitcoin has recently reclaimed the key $106,000 level. Under our primary scenario, we anticipate continued increases into the blue Target Zone between $117,553 and $130,891 – where green wave B is expected to conclude. From that corrective peak, we project a significant move lower in wave C, which should ultimately pull prices into the lower blue Target Zone between $62,395 and $51,323. This range is expected to mark the completion of orange wave a. We then foresee a brief corrective rally before wave (ii) completes its broader correction with a final sell-off.
📈 Over 190 precise analyses, clear entry points, and defined Target Zones - that's what we do.

#4162025 | BTCUSD Supply Zone 1:10BTCUSD Supply Zone Appears in D1 Time Frame Looking Price Action for Long Term Sell
Risk and Reward Ratio is 1:10
After 50 pips Profit Set SL Entry Level
"DISCLAIMER" Trading & investing business is "Very Profitable" as well as risky, so any trading or investment decision should be made after Consultation with Certified & Regulated Investment Advisors, by Carefully Considering your Financial Situation.

BTC Cycles & TA: 6/16/25Charts are now warning of a dangerous chart patterns again. Last time, they warned of the recent dip and we have since recovered, but now we have new negative patterns forming, except these are powerful negative patterns.

BTCUSD Expected Growth! BUY!
My dear friends,
Please, find my technical outlook for BTCUSD below:
The price is coiling around a solid key level - 10537
Bias - Bullish
Technical Indicators: Pivot Points Low anticipates a potential price reversal.
Super trend shows a clear buy, giving a perfect indicators' convergence.
Goal - 10693
About Used Indicators:
The pivot point itself is simply the average of the high, low and closing prices from the previous trading day.
Disclosure: I am part of Trade Nation's Influencer program and receive a monthly fee for using their TradingView charts in my analysis.
———————————
WISH YOU ALL LUCK

Weekly trading plan for Bitcoin In this idea I marked the important levels for this week and considered a few scenarios of price performance
Write a comment with your coins & hit the like button and I will make an analysis for you
The author's opinion may differ from yours,
Consider your risks.
Wish you successful trades ! mura


BTC/USD.4H CHART PATTERN.> Buy at 106,800
Resistance at 105,700
But resistance should be above the current price, not below. If 105,700 is below 106,800, it would typically be support, not resistance.
Corrected Interpretation:
Here's how your setup likely looks:
Buy Entry: 106,800
Support (not resistance): 105,700
Target 1: 110,000
Target 2: 112,000
---
Strategy Summary:
Level Type
105,700 Support (Stop-loss zone)
106,800 Entry
110,000 Target 1
112,000 Target 2
---
Trade Notes:
If BTC holds above 105,700, your long position is technically supported.
A break below 105,700 might invalidate the bullish setup — consider a stop-loss below that.
Momentum toward 110K–112K is possible if the market breaks out of short-term consolidation or reacts positively to macro news.
Would you like a chart or confirmation based on technical indicators (RSI, trendlines, volume, etc.)?

6/16/2025 3:33 AM PST - ChatGPTBTC/USD 15-Minute Chart Analysis – June 16, 2025 – 06:25 UTC-4
Exchange: Bitstamp | Current Price: $107,149
Trend: Short-term recovery from previous dump; nearing local resistance zone
Market Context: Rebound after consolidation below $106K; price testing $107.3K ceiling
📈 Technical Indicator Summary
1. RSI (14)
RSI: 67.40, close to overbought zone
Signal line: 69.48
➡️ Strong bullish momentum, but approaching exhaustion; potential pullback or consolidation soon
2. MACD (12,26,9)
MACD line > Signal line — bullish crossover confirmed
Histogram green and above 0, but flattening
➡️ Positive momentum remains, but bullish strength is fading
3. Volume
Volume increasing during upswings, declining during sideways phases
➡️ Accumulation confirmed; buyers were stepping in under $106K
4. Structure / Key Levels
🔻 Support Zones:
$106,600: Minor local support
$105,775 – $105,341: Consolidation demand zone
$105,000: Psychological & historical support
🔺 Resistance Zones:
$107,149: Current price, testing key resistance
$107,350 – $107,589: Major overhead barrier
Breakout could target: $108,000+
🎯 Trade Scenarios (Next 24 Hours)
✅ Scenario 1: Bullish Breakout Above $107,350
Conditions:
RSI stays above 60
MACD remains bullish
Price closes above $107,350 with volume spike
Entry:
📈 Buy breakout above $107,350
🎯 TP1: $107,750
🎯 TP2: $108,400
🛑 SL: $106,750 (below most recent higher low)
❌ Scenario 2: Rejection and Pullback from Resistance
Conditions:
RSI breaks below 60
MACD begins to turn down (bearish crossover)
Price fails to hold $107,149 and closes below $106,600
Entry:
📉 Sell on rejection from $107,350 + bearish divergence
🎯 TP1: $106,200
🎯 TP2: $105,800
🛑 SL: $107,550
📊 Probability Forecast (Next 24 Hours)
Scenario Probability Rationale
✅ Bullish Breakout 70% - Clean higher low structure
MACD + RSI strong
Testing resistance repeatedly = buildup for breakout |
| ❌ Pullback / Rejection | 30% | - RSI nearing overbought
Resistance near $107.6–107.8K is heavy
Possible fakeout if no volume follows |
🧠 Strategic Insight:
Momentum favors bulls, but resistance is thick between $107.3K and $107.6K.
Favor breakout entries on confirmation — not pre-break bets.
Watch RSI/MACD divergences closely.

BTC Weekly ChartJust consolidating around ATHs at this point.
Its bound to see a huge move either way eventually.

Trading Recommendations for the BTC/USDU.S. Treasury Secretary Scott Bessent stated yesterday that USD-backed stable coins could reach a market capitalization of $2 trillion or more. His remarks indicate growing governmental interest in cryptocurrencies, particularly stable coins, as a potentially vital component of the future financial system. Bessent emphasized that with proper regulation, stable coins could enhance payment efficiency, reduce transaction costs, and expand access to financial services for millions of people.
He also noted that stable coins could help broaden the global use of the U.S. dollar and that congress is advancing legislation requiring such coins to be backed by high-quality assets like U.S. Treasury bonds.
It's worth noting the U.S. Senate yesterday voted 68 to 30 to pass the Stable coin Regulation Act, bringing it closer to final approval. If enacted, the legislation could lead to a 10x increase in stable coin supply over the next for years - up to $2 trillion. As a result, stable coin issuers may acquire up to $1.6 trillion in U.S. government bonds for their reserves.
As for the medium-term strategy , I will continue to capitalize on deep pullbacks in Bitcoin and Ethereum, anticipating continuing the broader bullish market trend.
As for short-term trading, the strategy and conditions are described below.
Scenario 1: Buy Bitcoin today on a break above $108,1000, with a target of $108,700. Exit the buy position near $108,700 and open a short on the pullback. Before buying, ensure the 50-day moving average is below the current price and the Awesome Oscillator is in positive territory.
Scenario 2: Buy from the lower boundary of $107,500 if there is no market reaction to its breakout, aiming for a reversal back to $108,100 and $108,700.
Sell Scenario
Scenario 1: Sell Bitcoin today from $107,500, targeting $106,800. Exit shorts at $106,800 and consider buying on the bounce. Confirm that the 50-day moving average is above the current price, and the Awesome Oscillator is in negative territory.
Scenario 2: Sell from the upper boundary at $108,100 if there is no follow-through breakout, targeting $107.500 and $106,800.

BTC road map (4h)The BTC chart shows a bullish flag pattern, approaching a resistance level at 109k. A breakout above this level could confirm the next bullish target, but watch out for a potential reversal!
Best regards CobraVanguard.💚

Bitcoin (BTC)and NASDAQ: Intermarket Analysis and the Road AheadIn this four-hour BTCUSD chart, Bitcoin is currently consolidating within a symmetrical triangle pattern ⏳. The price is oscillating between a series of lower highs and higher lows, with the most recent swing high and swing low serving as key reference points for traders. This pattern reflects a market in indecision, awaiting a catalyst for a breakout.
Volume has picked up as price approaches the previous low, suggesting that buyers are stepping in to defend this area, rather than capitulating.
The next significant move will likely be determined by whether price can break above the last swing high or fall below the last swing low. A breakout above the previous high could open the door for a renewed uptrend, while a breakdown below the previous low may signal a deeper correction.
Geopolitical & Fundamental Backdrop 🌍
Bitcoin’s current consolidation is happening against a backdrop of heightened macro and geopolitical uncertainty. Recent global events, such as tensions in the Middle East and shifting US economic data, have contributed to increased volatility across risk assets. Institutional interest in Bitcoin remains strong, and the asset continues to be viewed as a hedge against inflation and currency debasement. However, short-term sentiment is sensitive to headlines and policy shifts.
NASDAQ & Correlation with Bitcoin 📈
The NASDAQ and Bitcoin remain closely correlated, especially during periods of heightened risk-on or risk-off sentiment. The NASDAQ has recently been consolidating after a strong rally, with price action also defined by a series of lower highs and higher lows. The index’s outlook is currently neutral to cautiously bullish, mirroring Bitcoin’s technical structure. If the NASDAQ can break above its recent high, it could provide a tailwind for Bitcoin and other risk assets. Conversely, a move below the last swing low in equities could trigger further caution in crypto markets.
Summary & Outlook 🚦
BTCUSD is at a pivotal juncture, with the next move likely to be determined by a break above the previous high or below the previous low on the four-hour chart.
Macro and geopolitical factors are creating short-term volatility, but the long-term structure remains constructive as long as the broader uptrend of higher lows is maintained.
The NASDAQ’s consolidation and its correlation with Bitcoin suggest that risk sentiment in equities will continue to influence crypto. Watch for confirmation from both markets before taking a directional bias.
Disclaimer:
This analysis is for informational purposes only and does not constitute financial advice. Cryptocurrency and stock markets are highly volatile and subject to rapid change. Always do your own research and consult with a financial advisor before making investment decisions.

BTC/USD Potential Reversal & Bullish Breakout SetupBTC/USD Potential Reversal & Bullish Breakout Setup 🔄🚀
Technical Analysis Overview:
🔹 Pattern Formation:
The chart displays a potential Triple Bottom pattern (🟠), a classic reversal signal forming at the $104,870–$100,000 support zone 🛡️. This structure suggests a strong base is being established for a potential upside move.
🔹 Support Zone:
📉 The price has consistently bounced off the major support area around $100,000–$104,870, indicating strong buying interest.
🔹 Resistance Zone:
📊 The key resistance level lies around the $114,000–$115,000 range 🔵, which has been tested multiple times in the past (🔴 arrows) and could act as a future profit target.
🔹 Price Action & Projection:
Currently, price is trading near $107,025 and is showing signs of bullish continuation after forming a higher low. If the price consolidates above the $104,870 zone and holds support, we could see a potential breakout targeting the $114,000 resistance 📈.
📌 Key Takeaways:
✅ Triple Bottom formation signals trend reversal.
🔄 Bullish structure confirmed above $104,870.
🎯 Next target: $114,000 if breakout holds.
⚠️ Watch for potential consolidation before continuation.

BTC RANGE-BOUNDBitcoin is once again pressing against the midpoint of its recent trading range after bouncing off the 50-day moving average near $105,000. Today’s candle shows solid follow-through from that bounce, reclaiming short-term structure and closing back above the key $105,787 level.
The broader structure remains a consolidation between $100,700 support and $112,000 resistance – with Bitcoin repeatedly testing both boundaries without breaking out. The most recent rejection at $112K marked the second failed attempt to clear that level, suggesting the presence of strong supply overhead. However, the continued defense of $105K and especially the higher low at $100,700 keeps the bullish structure intact for now.
The 50-day moving average has now been tagged multiple times and held as dynamic support, reinforcing its relevance in this trend. Meanwhile, the 200-day MA remains well below at $95K, and continues to slope upward, confirming broader trend health.
Volume remains relatively light during this bounce, which could be a cautionary signal for bulls hoping to see a breakout attempt. A move above $108K–$110K would likely re-ignite momentum toward the $112K top of range, while a clean break above $112K would open the door to a measured move toward $120K.
To the downside, the $100,700–$101,000 area is the line in the sand. A break below that level would invalidate the current higher low structure and put the $92,800 and $88,800 zones back in play as support.
In short, Bitcoin is still range-bound, but technically healthy. The bulls are defending key support levels and the 50 MA, while bears remain active at resistance. The next directional break – above $112K or below $100K – will likely dictate the next major move.

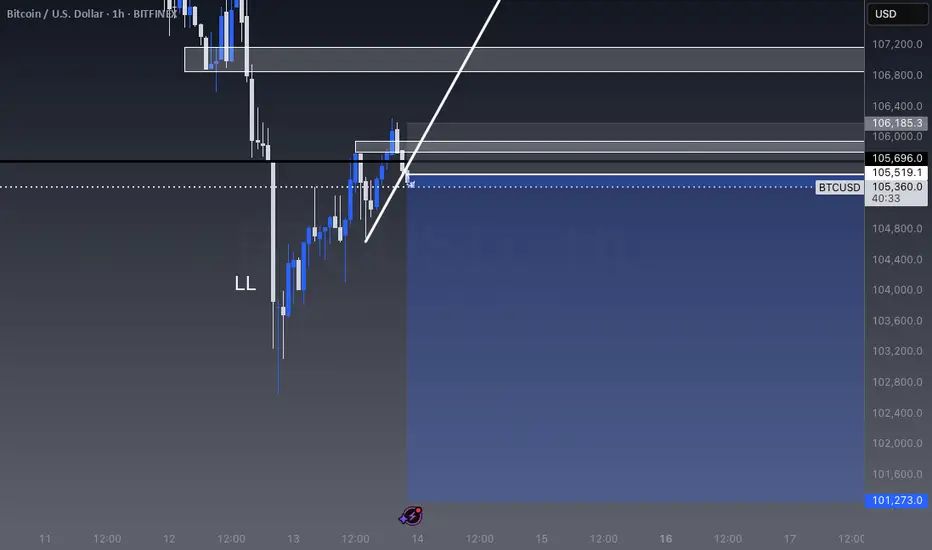
BTC SELL IDEAWe are seeing price pull back to a HL - mitigation happened on lower time frames. We entered a sell after our previous ctl broke on 1st entry then got stopped out. We drew another trend line & price seems to be breaking clean only risking 0.8%. Learning how to control my sizing when coming across these types of ideas, price hit .618 fib level & is now getting ready to head down to 100k - even 90k depending on how price unfolds.
Bitcoin - Will Bitcoin Reach Previous ATH?!Bitcoin is above EMA50 and EMA200 on the four-hour timeframe and is in its short-term descending channel. We can look for Bitcoin short positions from the specified supply range. If this range is broken, the path to the rise and a new ATH for Bitcoin will be presented.
It should be noted that there is a possibility of heavy fluctuations and shadows due to the movement of whales in the market and capital management in the cryptocurrency market is required, more than we would like. If the downtrend continues, I can buy in the desired range.
Bitcoin is now approaching its all-time high, yet unlike previous bullish cycles, we have not seen widespread profit-taking so far. The market’s whales currently seem uninterested in large-scale selling at these levels and appear to be waiting for higher price targets.
Since the start of January 2024, cumulative inflows of over $60 billion have poured into crypto-related investment products in the U.S., including ETPs and ETFs. In addition, retail investor futures trading volumes have recently surpassed their one-year average. Indicators of retail activity suggest that a significant number of smaller investors have become active in the futures markets.
The total assets under management by crypto investment funds surged to an unprecedented $167 billion in May. This impressive growth was fueled by net inflows of more than $7 billion into these funds. Meanwhile, global equity funds recorded $5.9 billion in outflows, and gold funds, for the first time in 15 months, also saw capital leaving.
The year 2025 could turn out to be the most dangerous year yet for cryptocurrency holders. Already, more than 25 incidents involving physical attacks on crypto owners have been reported, and the year isn’t even over. These attacks have targeted individuals whose digital asset information or identities were compromised, leading to thefts, kidnappings, physical threats, or assaults.
On another front, the total value of circulating stablecoins has surpassed $250 billion, more than doubling from its mid-2023 low of $123 billion. USDT remains the market leader with a 62% share, followed by USDC at 24%, while other stablecoins such as USDe, DAI, and BUIDL are also expanding their presence.
It is worth noting that average spot trading volumes on centralized exchanges have dropped to their lowest levels since October 2020.This kind of pattern typically precedes a significant price move—whether that’s a sharp rally or a deep correction. It’s also possible that this phase of uncertainty could persist for several more weeks.

BITCOIN Cup and Handle making double bounce on the 1D MA50.Bitcoin (BTCUSD) is about to complete a Cup and Handle (C&H) formation, having consolidated for almost a month since the May 22 All Time High (ATH). What makes the bullish potential even stronger is that it is rising after making a Double Bottom on the 1D MA50 (blue trend-line) for the first time since October 10 2024.
Given that the long-term pattern is a Channel Up and the 1D MA50 is acting as its natural support trend-line, the Cup and Handle can provide a short-term Target on its 2.0 Fibonacci extension at $122000. On the long-term the Channel Up still has the potential to lead it much higher.
So do you think that 122k is achievable after this Cup and Handle making double bounce on the 1D MA50? Feel free to let us know in the comments section below!
-------------------------------------------------------------------------------
** Please LIKE 👍, FOLLOW ✅, SHARE 🙌 and COMMENT ✍ if you enjoy this idea! Also share your ideas and charts in the comments section below! This is best way to keep it relevant, support us, keep the content here free and allow the idea to reach as many people as possible. **
-------------------------------------------------------------------------------
💸💸💸💸💸💸
👇 👇 👇 👇 👇 👇

Possible descending triangle, likely will break to downside.Despite Bitcoin (BTC) maintaining a price above $100,000 for several weeks now, it is clearly being supported by institutional buyers propelling the market. This is very bullish for the long term; however, BTC does need to correct in order to grow further. Volume continues to drop, and as soon as institutional buyers take a break, the price could crash.
Given that this cycle has introduced new market players, ETFs, and considering the current economic climate, a decline of over 60% down to its support level of $44,000 seems likely in the next year. We all know how it goes: when Bitcoin goes through tough times, it can seem like it’s dead, and that could be the best time to buy.
In the long run, if you're dollar-cost averaging (DCA) and have no intention of selling, I am confident that BTC will reach $250,000 in the next cycle, if not $500,000. However, it must correct to strengthen the lower supports and flush out over-leveraged traders.
Remember the saying: "When the tide goes out, we see who is swimming naked." This will happen again; it's Bitcoin!

Bitcoin - Inverse Head & Shoulders on 4h (Neckline broken)Looking forward to a new ATH shortly IF the neckline holds.
BITSTAMP:BTCUSD
BINANCE:BTCUSD
COINBASE:BTCUSD
CRYPTOCAP:TOTAL
CRYPTOCAP:OTHERS
BINANCE:ETHUSD
COINBASE:ETHUSD
BINANCE:SOLUSD
OANDA:XAUUSD
FX_IDC:XAUUSD

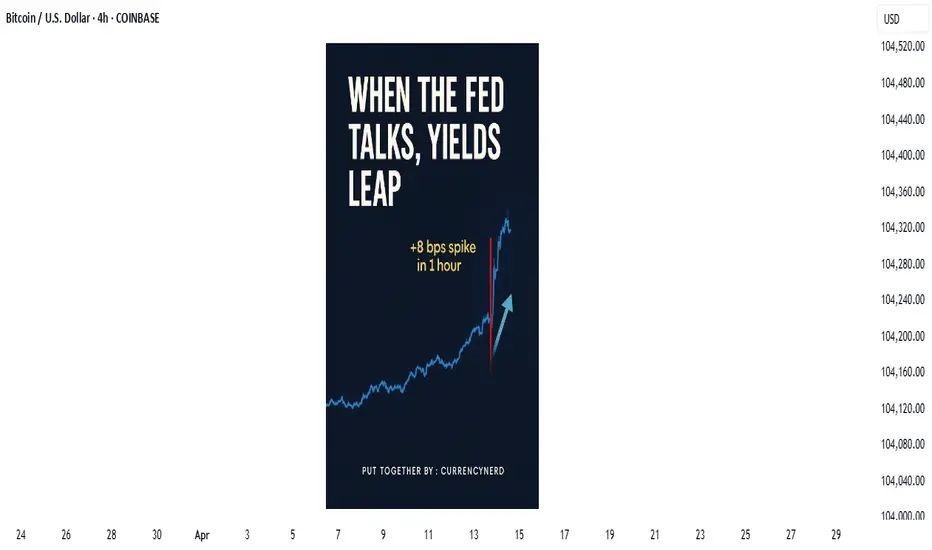
when Jerome says spike, the markets asks how low/high"Watch what they do, but also how they say it."
In the high-stakes world of central banking, few things move markets like the subtle wording of a Fed statement, But beyond the headlines and soundbites, one market absorbs this information faster—and with greater clarity—than almost any other: the bond market.
💬 What Is "Fed Speak"?
"Fed speak" refers to the nuanced and often deliberately vague language used by U.S. Federal Reserve officials when communicating policy expectations. It includes:
FOMC statements
Dot plot projections
Press conferences
Individual speeches from Fed officials
nerdy tip: the Fed aims to influence expectations without committing to specific outcomes, maintaining flexibility while steering market psychology.
📈 The Bond Market as a Decoder
The bond market, particularly the U.S. Treasury market, is where real-time interpretation of Fed policy plays out. Here's how it typically reacts:
1. Short-Term Yields (2Y, 3M) = Fed Expectation Barometer
These are the most sensitive to near-term interest rate expectations. If the Fed sounds hawkish (more rate hikes), short-term yields jump. If dovish (hinting cuts), they fall. At the May 7, 2025 FOMC meeting, the 2-year Treasury yield (US02Y) experienced a modest but clear reaction:
Just before the release, yields were hovering around 3.79%.
In the first hour following the 2:00 PM ET (20:00 UTC+2) statement, the yield ticked up by approximately +8 basis points, temporarily reaching about 3.87%.
Later that day, it eased back to around 3.79%, ending the day roughly unchanged—a sharp, immediate spike followed by a reversion.
2. Long-Term Yields (10Y, 30Y) = Growth + Inflation Expectations
Longer-dated yields reflect how the market sees the economy unfolding over time. After a Fed speech:
Rising long-term yields = stronger growth/inflation expected
Falling yields = fears of recession, disinflation, or policy over-tightening
3. The Yield Curve = Market's Policy Verdict
One of the best tools to read the bond market's verdict is the yield curve—specifically, the spread between 10Y and 2Y yields.
Steepening curve → Market thinks growth is picking up (Fed may be behind the curve)
Flattening or Inversion → Market believes the Fed is too aggressive, risking a slowdown or recession
📉 Example: After Jerome Powell’s hawkish Jackson Hole speech in 2022, the 2Y-10Y spread inverted deeply—markets were pricing in recession risks despite a strong Fed tone.
🧠 Why Traders Must Watch Bonds After Fed Speak
🪙 FX Traders:
Higher yields = stronger USD (carry trade advantage)
Falling yields = weaker USD (lower return for holding)
📈 Equity Traders:
Rising yields = pressure on tech/growth stocks (higher discount rates)
Falling yields = relief rally in risk assets
📊 Macro Traders:
The MOVE Index (bond volatility) often spikes around FOMC events
Forward guidance shifts = big rotation opportunities (e.g., bonds > gold > dollar)
(BONUS NERDY TIP) 🔍 How to Analyze Fed Speak Through Bonds
✅ Step 1: Watch the 2Y Yield
First responder to new rate expectations.
✅ Step 2: Check the Fed Funds Futures
Compare market pricing pre- and post-statement.
✅ Step 3: Look at Yield Curve Movement
Steepening or inversion? That’s the market’s macro take.
✅ Step 4: Track TLT or 10Y Yield on Your Chart
Bond ETFs or Treasury yields reveal sentiment instantly.
🧭 Final Nerdy Thought : Bonds React First, Talk Later
When the Fed speaks, don't just read the words. Read the yields. The bond market is often the first to interpret what the Fed really means—and the first to price in what comes next.
So next FOMC meeting, instead of watching only Powell’s facial expressions or CNBC pundits, open a chart of the 2Y and 10Y. That’s where the smart money’s listening.
put together by : @currencynerd as Pako Phutietsile
courtesy of : @TradingView
think I nailed the Gartley,on 1HR, there is more potential onsorry for all those who shorted to 99k. Harmonics never fail

Bitcoin (BTC): Buyers Back | Expecting To Re-Test The ATHBitcoin is showing good buyside dominance, which could lead the price to a new ATH. Last week Friday we formed a nice liquidity grab to lower zones, where after the weekend we are now seeing that buyside volume (where on smaller timeframes we formed proper BOS).
We are expecting to see a strong week.
Swallow Academy
