107.6-107.8 and 109-110KMorning folks,
So, position taking stage is done, now let's take a look at targets. In general we have a sequence of a few targets, starting from 107.6-107.8, 109-110, 113 and 116K. But in current situation I would watch for only first two.
Daily overbought is around 114, so 116K target seems too far. 113K is possible, but with rather extended downside action last week, it seems as very optimistic. That's why, more or less base case seems around 109-110K, while the easiest target is 107.6-107.8K.
So, once the first target will be reached - think about partial profit booking, if you want to continue trading. Say, take off 30-40% and move stops to the breakeven on the rest.
BITCOIN trade ideas

CHECK BTCUSD SIGNAL READ CAPTAINbtcusd sell now ✅
entry point (106600) (106550)
TAKE PROFIT 1: (106000)
TAKE PROFIT 2: (105100)
LAST TARGET (104500)
STOP LOSS (107400)

BTC “Golden Cross” Looms, but Geopolitics Could Delay ItBitcoin’s “Golden Cross” Looms, but Geopolitical Shocks Could Delay the Breakout
Deep dive into price action, derivatives, on-chain data, and the tug-of-war between Middle-East risk and crypto bull-run momentum
________________________________________
Table of Contents
1. Executive Summary
2. Scene-Setter: BTC at $105 K in a World on Edge
3. Technical Spark: What a Golden Cross Really Means
4. Price Action: From $103 K Dip to $106.8 K Hurdle
5. Options Market: A Sudden Lurch Toward Puts
6. Macro Overhang: Why Israel–Iran Turmoil Matters to Bitcoin
7. On-Chain Pulse: 656 % Cycle Gain, Yet Supply Is Tighter Than 2021
8. Mining Fundamentals: Difficulty Eases, Margins Improve
9. Corporate Treasuries: The Quiet, Sticky Bid
10. Targets & Scenarios: $97 K Downside vs. $229 K Upside
11. Strategy Playbook for Traders & Investors
12. Conclusion: Delayed, Not Derailed
13. Disclaimers
________________________________________
1. Executive Summary
• Bitcoin (BTC) is trading in a tight $103 K–$108 K band, unable to confirm a breakout as Middle-East tensions push investors into hedging mode.
• A Golden Cross—the 50-day SMA crossing above the 200-day—could flash within 10 trading sessions, historically adding +37 % median upside over the subsequent 90 days.
• Options flow has flipped decisively toward puts, with the 25-delta skew hitting –10 %, its most bearish since the FTX collapse, signaling short-term anxiety even as long-term bets remain bullish.
• On-chain metrics (exchange balances at six-year lows, HODLer supply at all-time highs) reveal structural demand; Glassnode notes a 656 % cycle advance despite a trillion-dollar market cap.
• Analysts’ upside targets range from $140 K (Q3) to $270 K (October) and even $229 K based on the Golden Cross fractal. Yet a clean break of $104 K support opens room to $97 K first.
________________________________________
2. Scene-Setter: BTC at $105 K in a World on Edge
Bitcoin entered 2025 with a blistering rally—spot ETFs hoovered nearly 200 K coins in four months, miners sold aggressively into strength, and macro tailwinds (Fed easing, USD weakness) fueled risk appetite. Then two macro curveballs hit:
1. Sticky U.S. core inflation revived “higher-for-longer” rate fears.
2. Israel–Iran hostilities spooked global markets, sending Brent crude to $76 and sparking a dash for USD liquidity.
BTC, once heralded as “digital gold,” behaved like a high-beta tech stock: it slipped 7 % in 48 hours, tagging $103,200 before bargain hunters stepped in. As of this writing, price sits near $105,800—right on the 100-hour SMA. Whether we escape the range depends on which force proves stronger: geopolitical dread or the long-term structural bid.
________________________________________
3. Technical Spark: What a Golden Cross Really Means
A Golden Cross occurs when the 50-day simple moving average (SMA-50) crosses above the 200-day (SMA-200). In Bitcoin’s 14-year history, we have logged nine such events:
Year Days to Cross 90-Day Return 180-Day Return
2013 51 +88 % +202 %
2015 73 +34 % +67 %
2019 46 +193 % +262 %
2020 38 +77 % +112 %
2023 59 +29 % +48 %
Median 90-day gain: +37 %
Median drawdown post-cross: –12 %
We are ~$700 shy of triggering the cross (SMA-50 at $97.9 K, SMA-200 at $98.1 K and rising). Assuming volatility stays muted, the lines converge within two weeks, potentially firing a widely watched buy signal. But remember: the cross is lagging; smart traders anticipate, not react.
________________________________________
4. Price Action: From $103 K Dip to $106.8 K Hurdle
Key intraday levels (Kraken feed):
• Support 1: $104,000 – prior weekly low + bullish order-block
• Support 2: $101,200 – 0.786 Fib retrace of the Feb–Mar impulse
• Bear Pivot: $97,000 – 200-day EMA + high-confluence volume node
• Resistance 1: $106,800 – last week’s swing high; three failed probes
• Resistance 2: $108,500 – May monthly open
• Bull Pivot: $113,000 – neckline of the March distribution range
Monday’s bounce broke a declining trend-line from $110 K, printing a higher low—constructive, yet bulls require a daily close >$106.8 K to invalidate the short-term bearish structure.
________________________________________
5. Options Market: A Sudden Lurch Toward Puts
Deribit data (largest BTC options venue):
• Put/Call Ratio: 0.62 last Friday → 0.91 today
• 25-Delta Skew (1-month): –10 %, lowest since Nov-2022
• Max-Pain for April 26 expiry: $104 K (huge open interest)
Translation: traders rushed to buy protective puts as Iran war headlines crossed. Market-makers, short those puts, delta-hedged by shorting spot or perpetual futures, adding downward pressure—classic gamma feedback loop.
Yet term structure remains contango; June and September IVs price higher topside. Institutions appear to sell near-dated panic, accumulate long-dated calls—a bullish medium-term stance.
________________________________________
6. Macro Overhang: Why Israel–Iran Turmoil Matters to Bitcoin
1. Risk-Off Correlation: Despite “digital gold” narratives, BTC’s 30-day correlation with the Nasdaq-100 sits at 0.64; equities slide → crypto follows.
2. USD Liquidity Drain: War premium lifts oil, stoking inflation and forcing the Fed to delay cuts; higher real yields pressure non-yielding assets.
3. Regulatory Optics: Heightened national-security chatter emboldens lawmakers keen to scrutinize crypto, a perceived sanctions-evasion channel.
4. Regional Flows: The Middle-East hosts some of the largest sovereign-wealth pools; risk aversion could pause their crypto allocations.
5.
Hence, every missile headline becomes a volatility catalyst. Still, flash-risk events fade quickly if energy supply stays intact, offering windows for BTC to re-assert its secular trend.
________________________________________
7. On-Chain Pulse: 656 % Cycle Gain, Yet Supply Is Tighter Than 2021
Glassnode frames Bitcoin’s ongoing bull as “one of the most explosive relative to market cap gravity.” Highlights:
• Cycle Return: 656 % from the $14 K November-2022 bottom—impressive given the asset is now >$2 T in free-float value, dwarfing 2017’s sub-$100 B base.
• Exchange Balances: Just 2.02 M BTC on centralized venues—13-year low.
• Realized Price (short-term holders): $92,500—suggests marginal buyers remain well in profit.
• Entity-Adjusted Dormancy Flow: At 275 K BTC/day vs. 2021’s 550 K—implying HODLers are less willing to spend.
Put simply: even after a seven-fold rally, supply scarcity persists.
________________________________________
8. Mining Fundamentals: Difficulty Eases, Margins Improve
The April 20 adjustment saw difficulty dip 1.2 %, the first contraction since January. Why it matters:
• Post-Halving Breathing Room: Block subsidy fell to 1.5625 BTC; a difficulty rollback cushions miner profit margins, lowering forced selling risk.
• Hashrate Plateau: Network hashrate hovers at 640 EH/s, only 3 % off the ATH—miners remain confident.
• Transaction Fees: Average fee per block = 0.37 BTC, still elevated by historical standards thanks to BRC-20 activity.
Miners thus appear cash-flow stable, reducing downside pressure on spot markets compared to previous post-halving eras.
________________________________________
9. Corporate Treasuries: The Quiet, Sticky Bid
Since MicroStrategy cracked the dam, 68 public companies now hold BTC on balance sheets, totaling 412,000 coins (~$43 B). Recent newcomers:
Company Purchase Date BTC Added Avg Cost
SemiconX Feb-2025 2,500 $94,800
Nordic Logistics Mar-2025 800 $98,200
Atlantech Energy Apr-2025 1,200 $101,500
Traits of corporate treasuries:
• Long-Dated Liabilities: Align with Bitcoin’s four-year halving cadence.
• Low Turnover: None of the 68 have sold core holdings despite 80 % drawdowns in 2022.
• Regulatory Transparency: SEC filings broadcast purchases, inviting copycat demand.
This sticky bid stabilizes spot markets during macro squalls.
________________________________________
10. Targets & Scenarios: $97 K Downside vs. $229 K Upside
Bearish Path (30 % probability)
• Trigger: Israel–Iran broadens, Fed signals no cuts in 2025.
• Price Action: Break $104 K, bulls capitulate at $97 K (200-day).
• Depth: Could wick to $88–90 K (0.618 retrace) if macro gloom persists.
Base Case (50 % probability)
• Trigger: Skirmishes contained; oil cools, Fed cuts twice by December.
• Price Action: Golden Cross confirms, BTC grinds to $128 K by September.
• Highs: $140 K tap as ETF inflows resume.
Bullish Path (20 % probability)
• Trigger: Middle-East cease-fire + ETF FOMO round two + dovish Fed pivot.
• Fractals: Prior Golden-Cross extensions averaged +120 % at extreme.
• Price Action: $150 K by summer, $229 K (Fib 2.618 from 2022 low) by year-end.
• Blow-Off: $270 K October spike before the next cyclical bear begins.
________________________________________
11. Strategy Playbook for Traders & Investors
Horizon Bias Instruments Risk Management
Intraday (0–48 h) Range scalp $104–$107 K Perp futures (5× max), options gamma scalping Hard stop $103 K; position <1 % equity
Swing (2–8 wks) Buy pullbacks ahead of Golden Cross Spot, dated futures roll, 1-month $110 K calls Stop $97 K daily close; size 5–10 %
Position (3–6 mo) Accumulate for $140–150 K target Spot, June/Sept call spreads ($120/150) Hedge via 25 % put collar
Long-Term (1–4 yr) Maintain core stash; ignore noise Cold storage, DCA Re-balance only when price doubles
Optional hedge: Long Gold / Short BTC ratio spread as a geopolitical shock absorber; ratio 1.3 currently, mean-reverts to 1.1 post-crises.
________________________________________
12. Conclusion: Delayed, Not Derailed
Bitcoin stands at a crossroads: a textbook Golden Cross beckons, ETF inflows smolder, miners relax, and corporate treasuries drip-feed demand. Yet war headlines and a cautious options market act as sandbags on the balloon. History says macro shocks slow, not stop secular bull cycles. Unless Middle-East conflict strangles global liquidity or the Fed slams the brakes far harder than priced, BTC’s higher-time-frame structure remains bullish. Expect turbulence, embrace risk controls—but don’t mistake a weather delay for a busted engine.
________________________________________
13. Disclaimers
This article is for educational purposes only and does not constitute financial advice. Cryptocurrency investing involves substantial risk; never invest more than you can afford to lose.

Bullish bounce?The Bitcoin (BTC/USD) is falling towards the pivot and could bounce to the 1st resistance.
Pivot: 101,082.81
1st Support: 94,030.59
1st Resistance: 110,969.18
Risk Warning:
Trading Forex and CFDs carries a high level of risk to your capital and you should only trade with money you can afford to lose. Trading Forex and CFDs may not be suitable for all investors, so please ensure that you fully understand the risks involved and seek independent advice if necessary.
Disclaimer:
The above opinions given constitute general market commentary, and do not constitute the opinion or advice of IC Markets or any form of personal or investment advice.
Any opinions, news, research, analyses, prices, other information, or links to third-party sites contained on this website are provided on an "as-is" basis, are intended only to be informative, is not an advice nor a recommendation, nor research, or a record of our trading prices, or an offer of, or solicitation for a transaction in any financial instrument and thus should not be treated as such. The information provided does not involve any specific investment objectives, financial situation and needs of any specific person who may receive it. Please be aware, that past performance is not a reliable indicator of future performance and/or results. Past Performance or Forward-looking scenarios based upon the reasonable beliefs of the third-party provider are not a guarantee of future performance. Actual results may differ materially from those anticipated in forward-looking or past performance statements. IC Markets makes no representation or warranty and assumes no liability as to the accuracy or completeness of the information provided, nor any loss arising from any investment based on a recommendation, forecast or any information supplied by any third-party.

BTCUSD Enter point 106200 target 105200 stop loss 107000New trade setup for BTCUSD:
- Entry: 106,200
- Target: 105,200
- Stop Loss (SL): 107,000
You're going short on BTCUSD. What's driving your bearish sentiment? Market trends, technical indicators, or something else?


BTC/USD BUYS Expecting buying pressure around this area to form a 3rd possible HH to the 2nd but LH to the 1st high. Retracement filled my areas and had decent buying pressure. Current SL is set to BE due to not being able to view this trade play out fully. Nice bear channel Bull BO to retracement buys for an attempt to HH.
6/15/2025Come Tap into the mind of SnipeGoat, as he gives you a magnificent Full Top-Down Analysis, breaking down the market in its simplest form.
_SnipeGoat_
_TheeCandleReadingGURU_
#PriceAction #MarketStructure #TechnicalAnalysis #Bearish #Bullish #Bitcoin #Crypto #BTCUSD #Forex #NakedChartReader #ZEROindicators #PreciseLevels #ProperTiming #PerfectDirection #ScalpingTrader #IntradayTrader #DayTrader #SwingTrader #PositionalTrader #HighLevelTrader #MambaMentality #GodMode #UltraInstinct #TheeBibleStrategy

BTCUSD NEW OUTLOOK BEARISH SIDE M30 ANNALSIS ACCORDING 16/6/2025Sell 106200 106500
take profit 105700
take profit 105200
take profit 104500
sl 107000

Bitcoin Update June 15th 2025📊 Summary: Bitcoin leaning slightly bearish short term, but trendline still intact
...
🟢 Bullish Signals
Price still above the orange trendline support (bullish structure intact).
Money Flow Index (green) is still in the positive zone.
Green dot was printed recently (momentum reversal signal).
Still above the $100K psychological level, and strong support at ~$100,023.
🔴 Bearish Signal
Price rejected hard from resistance (~$110,616–$112,000 zone).
Lower high pattern forming.
Stoch RSI is curling down after peaking — early signal of momentum loss.
Market is struggling to reclaim $105,745, a key level.
...
🔄 Key Levels to Watch:
🔼 Resistance $105,745 – $110,616 Reclaiming = bullish continuation
🟧 Support $100,023 Break = bearish shift
🟨 Next Support $93,037 Below here = deeper correction possible
...
📉 Verdict:
Short-term: Bearish bias (momentum cooling, resistance holding)
Mid-term: Neutral/Bullish (structure still intact as long as $100K holds)
.....
📌 Setup Type: Support Bounce or Breakdown Play
Timeframe: Daily (swing trade setup)
Risk Profile: Medium
Indicators Used: Price structure, support/resistance, trendline, momentum oscillators
...
🟢 Bullish Scenario – Long Setup
🔹 Entry:
$100,200–$101,000 (trendline retest and major support zone)
🔹 Stop-Loss:
Below $98,000
(Invalidates the higher-low structure and breaks trendline)
🔹 Targets:
1. $105,745 – reclaim level (TP1)
2. $109,118 – Fib extension (TP2)
3. $112,000 – recent high resistance (TP3)
🔹 Risk/Reward Estimate:
RR ~3:1 (depending on exact entry/exit)
...
🔻 Bearish Scenario – Short Setup
🔹 Entry:
Break and retest below $100,000
(Look for a candle close under + rejection on retest)
🔹 Stop-Loss:
Above $101,200
🔹 Targets:
1. $93,037 – strong horizontal support (TP1)
2. $89,750 – deeper wick target (TP2)
🔹 Risk/Reward Estimate:
RR ~2.5:1
...
🧠 Bonus Tip – Use Alerts:
🔔 Set alerts at:
$100,200 (to watch for bounce setup)
$98,000 (for breakdown)
$105,750 (resistance reclaim confirmation)
Note:
Retail Sales - Tuesday
Unemployment Claims - Wednesday
FOMC Rate Decision- Wednesday
US Markets Closed - Thursday
...
Much love and appreciation,
– chevs710

BTCBTC is in a consolidation, we need this to protect 100K level, if it drops 100K then further downside will follow otherwise its good to go up.
Disclosure: We are part of Trade Nation's Influencer program and receive a monthly fee for using their TradingView charts in our analysis.

Trade almost at targetAt this point trade can be partially close or hold with a protective stop order.

BTC update!!Good day traders, here is another update on BTC and I have adjusted my narrative but my overall bias is still remaining bearish…

Bitcoin Consolidation: Easy, Walk Away.Bitcoin consolidation in progress. The easiest thing to do in these situations is avoid taking any trades until a new trend is established. Even smaller time frames will be harder to trade unless you are employing mean reversion strategies. At some point the market will choose which way it wants to go but trying to guess in advance is a coin flip. The broader trend is bullish but the 110K and 113K area is a tough resistance. If price struggles to break this area over the next few weeks, then a broader retrace may be more likely.
In this situation it pays to wait for specific levels to take any action at all. What type of action you take will depend on your risk tolerance and time frame. In my opinion, the higher probability scenarios will be a test of the 102K area supports, followed by reversal patterns. Even if they don't follow through to new highs, at least there will be some attempt to maintain the support since Bitcoin is still generally strong.
IF Bitcoin breaks the support (anything is possible) that will confirm the broader corrective scenario which can see price testing 95K at minimum. There is no way to know the certainty of this scenario, it is all about how price action unfolds and confirms.
This time of year is typical of lower volume, lower momentum and less follow through. Often it is better to just sit it out and wait until the season shows clear signs of improvement. Seasonal volume does not typically get back to consistently high momentum levels until November. This does not mean there will be no opportunities at all, it just means if there is going to be a time to purposely be more selective, the next couple of months would be that time.
Thank you for considering my analysis and perspective.

Bitcoin at Risk of Major Pullback! Key Support Levels to Watch BTCUSD is showing signs of weakness after rejecting the strong supply zone near $110K. Price has started forming lower highs and currently sits around $104,739, with bearish momentum gradually building. 👀
🔻 If the selling pressure continues, we could see price testing the next key support at $94,444 – a previously strong breakout level.
🚨 A break below $94K could open the way for a deeper correction toward the $76,318 demand zone, which aligns with a prior consolidation base and high-volume node. This level also overlaps with a visible range support and the March-April demand block (orange zone), making it a critical area for bulls to defend.
🔍 Technical Overview:
Resistance zone: $109,000 – $110,000 (rejection confirmed)
Key supports:
$94,444 → retest likely
$76,318 → major demand zone + potential long entry
Structure: Lower high forming, bearish signals increasing
Indicators: Potential bearish divergence forming (RSI not shown but implied)
🧠 What to Watch:
Watch for volume spike and candle pattern confirmation on the $94K level.
A clean break below $94K with retest could offer swing short setups.
Bulls will need to reclaim $110K to regain momentum.
💬 What’s your take? Are we heading for $76K or will bulls defend $94K? Comment below!
#BTC #Bitcoin #BTCUSD #Crypto #BitcoinAnalysis #TechnicalAnalysis #PriceAction #SupplyAndDemand #SupportResistance #Bearish #CryptoTrading #SwingTrade #TradingView

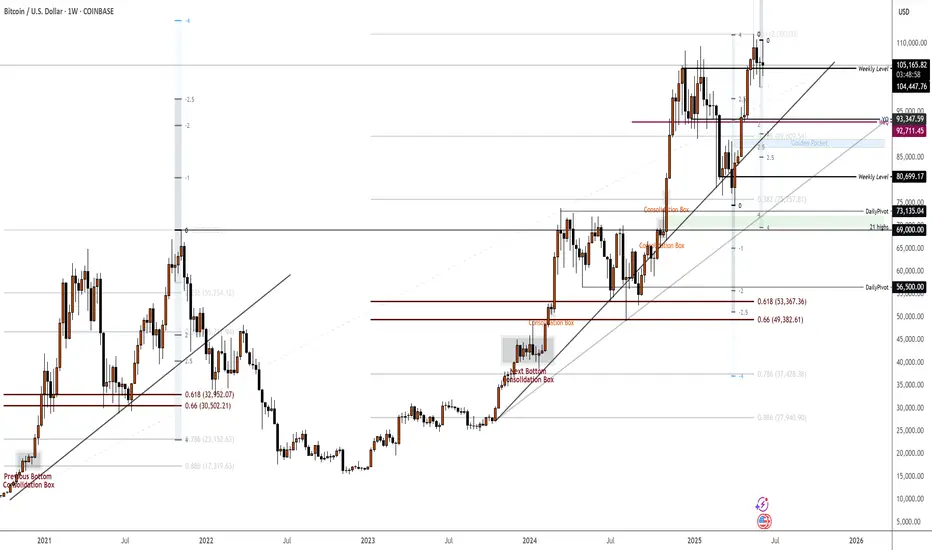
Interesting times aheadThis charts depicts recent but also old price action.
Waiting to see weekly close, and also the next week reaction of news.
Keep in mind that this is not financial advice!
BTCUSDBUYING btc now
sl 105324
tp 106164
1% risk on each trade
follow an like thanks
im also looking to mentor free or make friends thanks
lets talk i like gold. btc forex. stocks
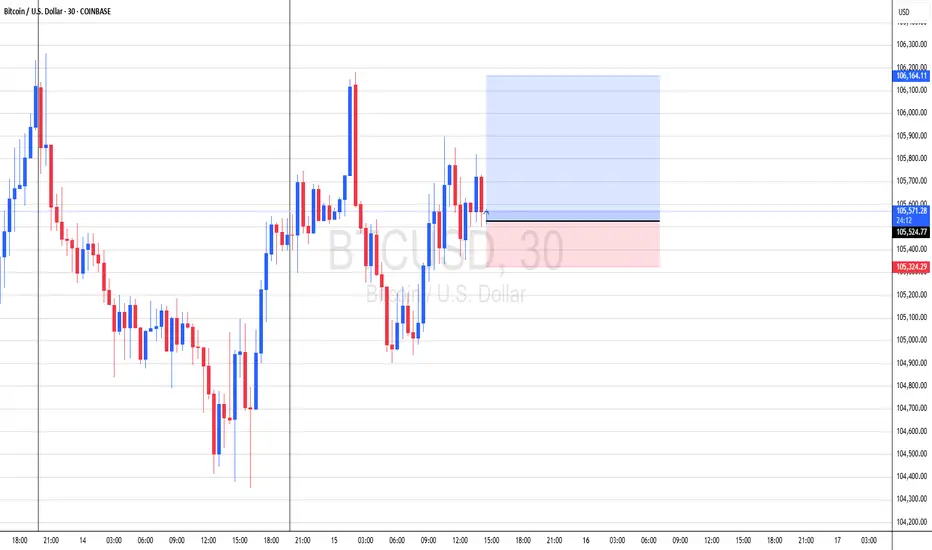
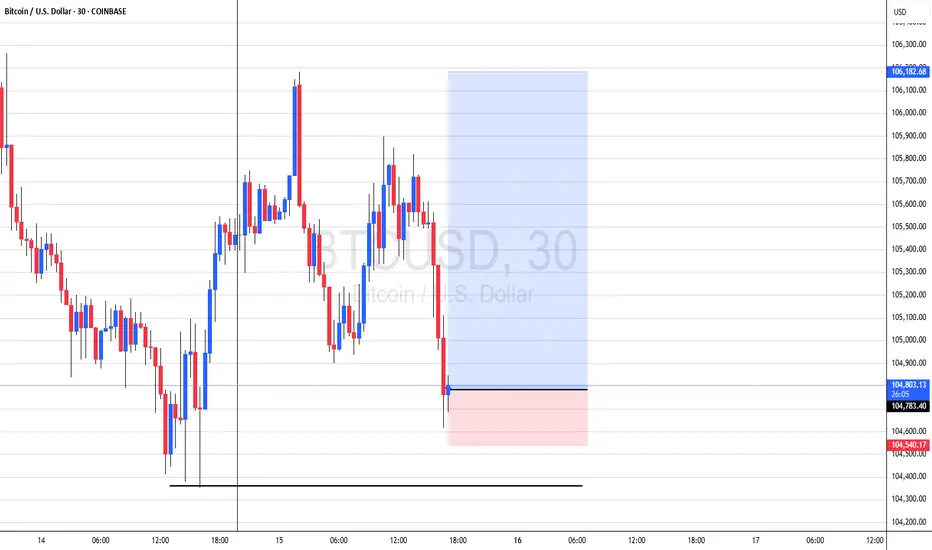
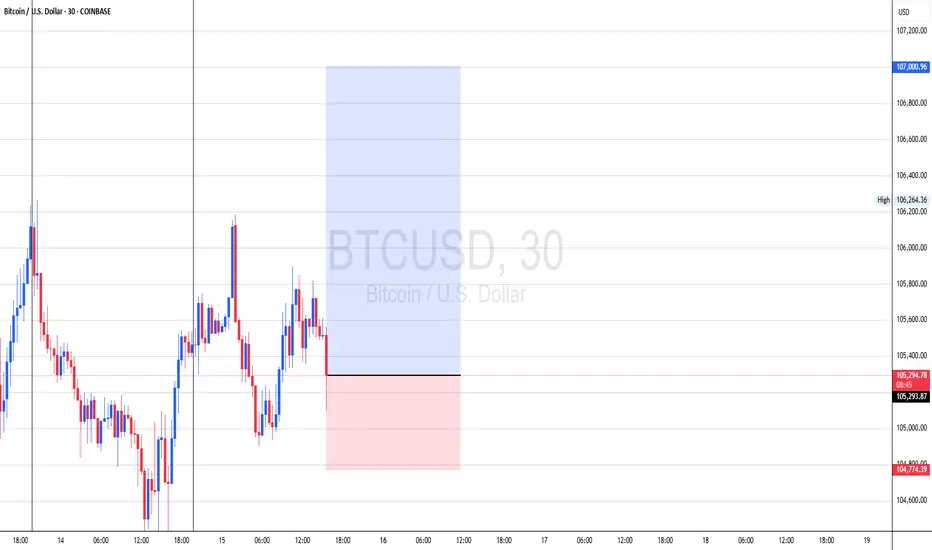
BTC/USD – Liquidity Sweep at Highs Signals Potential ReversalBTC/USD – 30-Minute Time Frame Analysis
On the 30-minute chart, BTC/USD has recently executed a liquidity sweep above the recent highs, triggering stop-losses on the sell side. This stop-hunt behavior often indicates exhaustion of bearish momentum and the potential for a reversal.
Given this development, a short opportunity is anticipated from the current region around 105600, with a clear invalidation level above the recent highs.
Entry 105600
Stop-Loss 106312
Target 104002
This setup is based on price action and liquidity dynamics, suggesting short-term bearish pressure following the stop-run.
Outlook: Bearish below 106312, targeting 104002 as the next key level of interest.

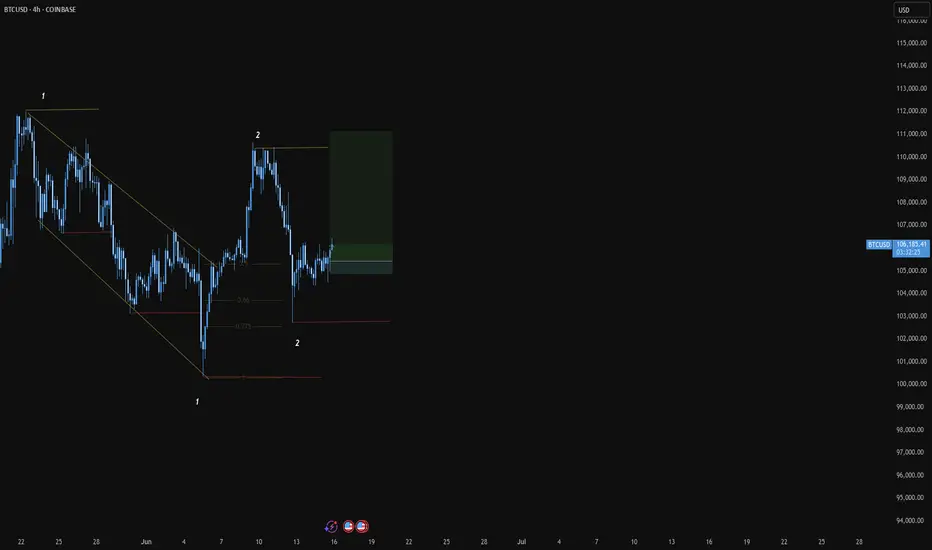
BTC July/August Top3 Drives Pattern (Mar 2024, Jan 2025)
Last Drive in July/August but leaning towards July
June 19th - 22nd for potential impulse
June 27th/28th for a local top into Early July Bottom | if Price is Bearish into these dates then Local Bottom
July 17th to 24th for Summer Top
Aug 3rd to 11th for a potential Local Bottom
Expected Top is 120k and up (Can be seen on Fibs) | 135k would be ideal


#202524 - priceactiontds - weekly update - bitcoinGood Day and I hope you are well.
comment: Last week I printed another potential two-legged correction where the C would print a new ath. Bulls were to weak to even retest 112k and 110k was all they got. Now I do think there are many more reasons that this will be the mother of all doubles tops than any arguments for the bulls exist, how they could print a new ath. Structure is decent and market has spent many days at the top trying to continuing the trend. Confirmation is a daily close below 100k.
current market cycle: Broad bull channel on the weekly tf. Market is about to re-test the ath and will likely transition into a trading range afterwards or we are already in one.
key levels: 100k - 115k
bull case: Bulls are still hopeful, that’s why we are still above 110k but the next touch could break it and I doubt many will hold long or scale into new ones there. Best bulls can get right now is to go sideways for longer and stay above 100k. I mean… Staying above 100k is as bullish as it get’s if you be honest.
Invalidation is a daily close below 100k
bear case: Can we also get a new bear trend from 110k? We would need 4-5 consecutive daily bear closes for that. Right now bears are only getting 4 but prices is not moving much during those 4 and the bars are overlapping too much. Bulls are still hopeful. Bears need to do more if they want lower prices again. As of now bulls are favored to continue inside the given range.
Invalidation is above 113k
short term: Bearish with stop 113k. Will scale into shorts and take some profits around 100k until we see a big breakout below.
medium-long term - Update from 2025-06-08:
medium-long term - Update from 2025-06-08: “Need to see a clear sign that bulls can not push it beyond 112k and once we turn again from closer to the ath, I will comment on bear targets for the next months.”
This was from last week and market provided this clear sign with the amazing double top but only a daily close below 100k is confirmation. First target below 100k is 97k the breakout retest and after that is the 50% retracement around 93000.
