6/15/2025Come Tap into the mind of SnipeGoat, as he gives you a magnificent Full Top-Down Analysis, breaking down the market in its simplest form.
_SnipeGoat_
_TheeCandleReadingGURU_
#PriceAction #MarketStructure #TechnicalAnalysis #Bearish #Bullish #Bitcoin #Crypto #BTCUSD #Forex #NakedChartReader #ZEROindicators #PreciseLevels #ProperTiming #PerfectDirection #ScalpingTrader #IntradayTrader #DayTrader #SwingTrader #PositionalTrader #HighLevelTrader #MambaMentality #GodMode #UltraInstinct #TheeBibleStrategy
BITCOIN trade ideas

BTCUSD NEW OUTLOOK BEARISH SIDE M30 ANNALSIS ACCORDING 16/6/2025Sell 106200 106500
take profit 105700
take profit 105200
take profit 104500
sl 107000

Bitcoin Update June 15th 2025📊 Summary: Bitcoin leaning slightly bearish short term, but trendline still intact
...
🟢 Bullish Signals
Price still above the orange trendline support (bullish structure intact).
Money Flow Index (green) is still in the positive zone.
Green dot was printed recently (momentum reversal signal).
Still above the $100K psychological level, and strong support at ~$100,023.
🔴 Bearish Signal
Price rejected hard from resistance (~$110,616–$112,000 zone).
Lower high pattern forming.
Stoch RSI is curling down after peaking — early signal of momentum loss.
Market is struggling to reclaim $105,745, a key level.
...
🔄 Key Levels to Watch:
🔼 Resistance $105,745 – $110,616 Reclaiming = bullish continuation
🟧 Support $100,023 Break = bearish shift
🟨 Next Support $93,037 Below here = deeper correction possible
...
📉 Verdict:
Short-term: Bearish bias (momentum cooling, resistance holding)
Mid-term: Neutral/Bullish (structure still intact as long as $100K holds)
.....
📌 Setup Type: Support Bounce or Breakdown Play
Timeframe: Daily (swing trade setup)
Risk Profile: Medium
Indicators Used: Price structure, support/resistance, trendline, momentum oscillators
...
🟢 Bullish Scenario – Long Setup
🔹 Entry:
$100,200–$101,000 (trendline retest and major support zone)
🔹 Stop-Loss:
Below $98,000
(Invalidates the higher-low structure and breaks trendline)
🔹 Targets:
1. $105,745 – reclaim level (TP1)
2. $109,118 – Fib extension (TP2)
3. $112,000 – recent high resistance (TP3)
🔹 Risk/Reward Estimate:
RR ~3:1 (depending on exact entry/exit)
...
🔻 Bearish Scenario – Short Setup
🔹 Entry:
Break and retest below $100,000
(Look for a candle close under + rejection on retest)
🔹 Stop-Loss:
Above $101,200
🔹 Targets:
1. $93,037 – strong horizontal support (TP1)
2. $89,750 – deeper wick target (TP2)
🔹 Risk/Reward Estimate:
RR ~2.5:1
...
🧠 Bonus Tip – Use Alerts:
🔔 Set alerts at:
$100,200 (to watch for bounce setup)
$98,000 (for breakdown)
$105,750 (resistance reclaim confirmation)
Note:
Retail Sales - Tuesday
Unemployment Claims - Wednesday
FOMC Rate Decision- Wednesday
US Markets Closed - Thursday
...
Much love and appreciation,
– chevs710

BTCBTC is in a consolidation, we need this to protect 100K level, if it drops 100K then further downside will follow otherwise its good to go up.
Disclosure: We are part of Trade Nation's Influencer program and receive a monthly fee for using their TradingView charts in our analysis.

Trade almost at targetAt this point trade can be partially close or hold with a protective stop order.

BTC update!!Good day traders, here is another update on BTC and I have adjusted my narrative but my overall bias is still remaining bearish…

Bitcoin Consolidation: Easy, Walk Away.Bitcoin consolidation in progress. The easiest thing to do in these situations is avoid taking any trades until a new trend is established. Even smaller time frames will be harder to trade unless you are employing mean reversion strategies. At some point the market will choose which way it wants to go but trying to guess in advance is a coin flip. The broader trend is bullish but the 110K and 113K area is a tough resistance. If price struggles to break this area over the next few weeks, then a broader retrace may be more likely.
In this situation it pays to wait for specific levels to take any action at all. What type of action you take will depend on your risk tolerance and time frame. In my opinion, the higher probability scenarios will be a test of the 102K area supports, followed by reversal patterns. Even if they don't follow through to new highs, at least there will be some attempt to maintain the support since Bitcoin is still generally strong.
IF Bitcoin breaks the support (anything is possible) that will confirm the broader corrective scenario which can see price testing 95K at minimum. There is no way to know the certainty of this scenario, it is all about how price action unfolds and confirms.
This time of year is typical of lower volume, lower momentum and less follow through. Often it is better to just sit it out and wait until the season shows clear signs of improvement. Seasonal volume does not typically get back to consistently high momentum levels until November. This does not mean there will be no opportunities at all, it just means if there is going to be a time to purposely be more selective, the next couple of months would be that time.
Thank you for considering my analysis and perspective.

Bitcoin at Risk of Major Pullback! Key Support Levels to Watch BTCUSD is showing signs of weakness after rejecting the strong supply zone near $110K. Price has started forming lower highs and currently sits around $104,739, with bearish momentum gradually building. 👀
🔻 If the selling pressure continues, we could see price testing the next key support at $94,444 – a previously strong breakout level.
🚨 A break below $94K could open the way for a deeper correction toward the $76,318 demand zone, which aligns with a prior consolidation base and high-volume node. This level also overlaps with a visible range support and the March-April demand block (orange zone), making it a critical area for bulls to defend.
🔍 Technical Overview:
Resistance zone: $109,000 – $110,000 (rejection confirmed)
Key supports:
$94,444 → retest likely
$76,318 → major demand zone + potential long entry
Structure: Lower high forming, bearish signals increasing
Indicators: Potential bearish divergence forming (RSI not shown but implied)
🧠 What to Watch:
Watch for volume spike and candle pattern confirmation on the $94K level.
A clean break below $94K with retest could offer swing short setups.
Bulls will need to reclaim $110K to regain momentum.
💬 What’s your take? Are we heading for $76K or will bulls defend $94K? Comment below!
#BTC #Bitcoin #BTCUSD #Crypto #BitcoinAnalysis #TechnicalAnalysis #PriceAction #SupplyAndDemand #SupportResistance #Bearish #CryptoTrading #SwingTrade #TradingView

Interesting times aheadThis charts depicts recent but also old price action.
Waiting to see weekly close, and also the next week reaction of news.
Keep in mind that this is not financial advice!
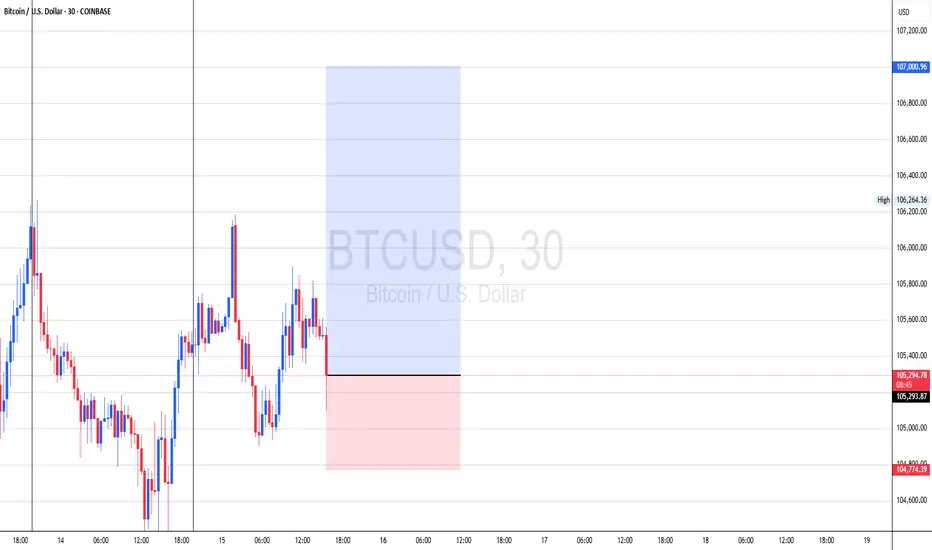
BTCUSDBUYING btc now
sl 105324
tp 106164
1% risk on each trade
follow an like thanks
im also looking to mentor free or make friends thanks
lets talk i like gold. btc forex. stocks
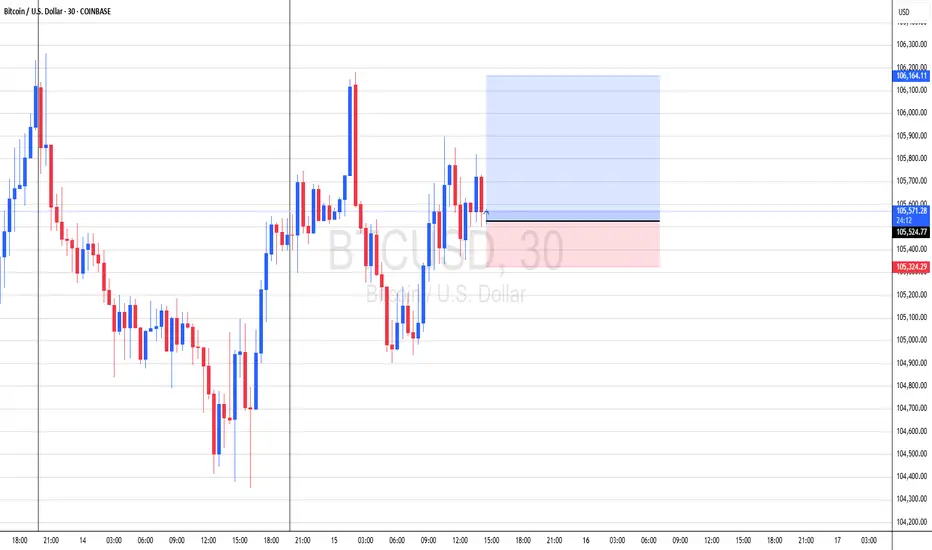
BTC/USD – Liquidity Sweep at Highs Signals Potential ReversalBTC/USD – 30-Minute Time Frame Analysis
On the 30-minute chart, BTC/USD has recently executed a liquidity sweep above the recent highs, triggering stop-losses on the sell side. This stop-hunt behavior often indicates exhaustion of bearish momentum and the potential for a reversal.
Given this development, a short opportunity is anticipated from the current region around 105600, with a clear invalidation level above the recent highs.
Entry 105600
Stop-Loss 106312
Target 104002
This setup is based on price action and liquidity dynamics, suggesting short-term bearish pressure following the stop-run.
Outlook: Bearish below 106312, targeting 104002 as the next key level of interest.

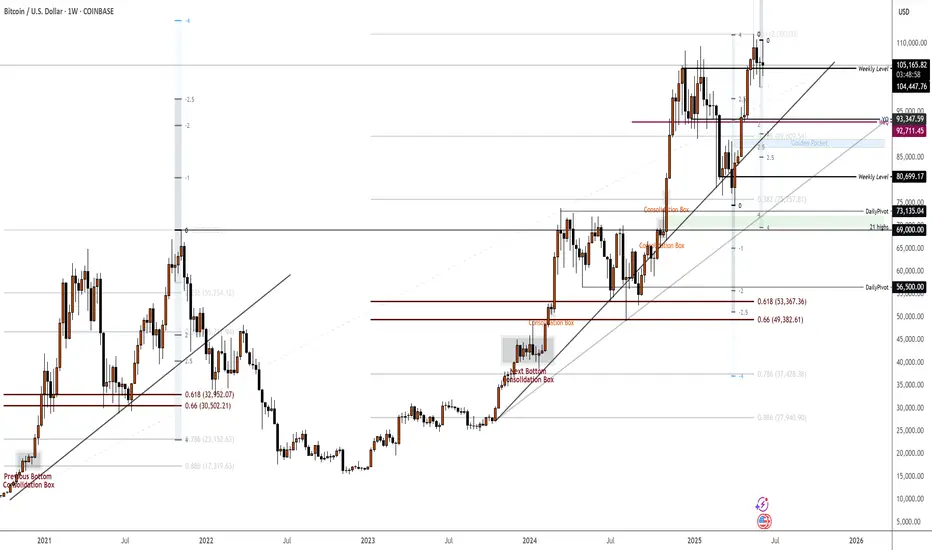
BTC July/August Top3 Drives Pattern (Mar 2024, Jan 2025)
Last Drive in July/August but leaning towards July
June 19th - 22nd for potential impulse
June 27th/28th for a local top into Early July Bottom | if Price is Bearish into these dates then Local Bottom
July 17th to 24th for Summer Top
Aug 3rd to 11th for a potential Local Bottom
Expected Top is 120k and up (Can be seen on Fibs) | 135k would be ideal


#202524 - priceactiontds - weekly update - bitcoinGood Day and I hope you are well.
comment: Last week I printed another potential two-legged correction where the C would print a new ath. Bulls were to weak to even retest 112k and 110k was all they got. Now I do think there are many more reasons that this will be the mother of all doubles tops than any arguments for the bulls exist, how they could print a new ath. Structure is decent and market has spent many days at the top trying to continuing the trend. Confirmation is a daily close below 100k.
current market cycle: Broad bull channel on the weekly tf. Market is about to re-test the ath and will likely transition into a trading range afterwards or we are already in one.
key levels: 100k - 115k
bull case: Bulls are still hopeful, that’s why we are still above 110k but the next touch could break it and I doubt many will hold long or scale into new ones there. Best bulls can get right now is to go sideways for longer and stay above 100k. I mean… Staying above 100k is as bullish as it get’s if you be honest.
Invalidation is a daily close below 100k
bear case: Can we also get a new bear trend from 110k? We would need 4-5 consecutive daily bear closes for that. Right now bears are only getting 4 but prices is not moving much during those 4 and the bars are overlapping too much. Bulls are still hopeful. Bears need to do more if they want lower prices again. As of now bulls are favored to continue inside the given range.
Invalidation is above 113k
short term: Bearish with stop 113k. Will scale into shorts and take some profits around 100k until we see a big breakout below.
medium-long term - Update from 2025-06-08:
medium-long term - Update from 2025-06-08: “Need to see a clear sign that bulls can not push it beyond 112k and once we turn again from closer to the ath, I will comment on bear targets for the next months.”
This was from last week and market provided this clear sign with the amazing double top but only a daily close below 100k is confirmation. First target below 100k is 97k the breakout retest and after that is the 50% retracement around 93000.

BTCUSD📈 Bitcoin (BTCUSD) Market Update
Current Price: $105,000.00
Outlook: Strongly Bullish
Bitcoin is currently trading at $105,000 and showing continued bullish momentum. Price action indicates strong demand at current levels, with technical structure suggesting potential for an explosive move upward.
Key Insight:
Buy pressure remains dominant, with no immediate signs of reversal. BTC is holding above key support zones and appears poised for a continuation rally.
📊 Trade Idea:
Bias: Long (Buy)
Entry Zone: Market Price (~$105,000)
Short-Term Targets:
🎯 Target 1: $110,000
🎯 Target 2: $120,000
🎯 Target 3: $130,000
Note: Monitor for consolidation above $105,000 as a base for further upside. Risk management remains essential—adjust stop-loss levels as per your strategy.

B/$A little trading from my kitchen
If you are interested, just say so and you will enjoy a taste of the kitchen of a winning trader

BTCUSD NEW WEEK OUTLOOKS. M30 POSSIBLE TREENDS MARKET BEARISH SISell 106000 106300
take profit 105500
take profit 105000
take profit 105000
stop los 107000

Middle East Tensions Drive Capital Shift: BTC May Test 100K SupCurrently, we can clearly see that BTC is in a downward trend 🔻. Due to the tense situation in the Middle East 😰, a large amount of capital has flowed into gold and crude oil markets. BTCUSD is likely to continue its downward movement on Monday ⬇️. Let's focus on the support level at 100,000. If it breaks below 100,000, it may continue to decline ⚠️.
⚡️⚡️⚡️ BTCUSD ⚡️⚡️⚡️
🚀 Sell@ 106500 - 105500
🚀 TP 102000 - 101000
Accurate signals are updated every day 📈 If you encounter any problems during trading, these signals can serve as your reliable guide 🧭 Feel free to refer to them! I sincerely hope they'll be of great help to you 🌟 👇

BITCOIN TOPPED. ELLIOT WAVE LONG Long term outlook of Bitcoin using EWT. I personally think Bitcoin has topped and the btc.d charts support it as well as the actual chart shown here. We’re beggining the massive correction as it did way back and I kept the ratios the same so after wave C next year or whenever, we can all buy btc at around 30k and ride the next waves up.

BTCUSD TRADING ROADMAP 16 - 22 JUNI 2025💹 BTCUSD TRADING ROADMAP – STRATEGY OUTLOOK 💹
BTCUSD is currently trading below Magnet Area (spH4) 106035.00 – 106931.00, and is showing potential for a retest toward Magnet Area (dmH4) 103579.00 – 102849.00.
As long as price holds above Magnet Area (dmD) 102098.00 – 97411.00, the market may resume bullish momentum toward the next Magnet Area (spH4) 110067.00 – 110412.00.
However, if price breaks below Magnet Area (dmH4) 103579.00 – 102849.00, a deeper drop may occur toward the next Magnet Area (dmH4) 100793.00 – 99880.00.
📌 Key Scenarios:
🔄 Retest zone: 103579 – 102849 (dmH4)
📈 Upside continuation: valid above 102098 – 97411 (dmD), target 110067 – 110412
📉 Bearish breakdown: below 102849 could trigger drop to 100793 – 99880
⚠️ DISCLAIMER:
This content is for educational purposes only and is not financial advice. Cryptocurrency trading carries a high level of risk. Always conduct your own analysis and apply proper risk management before entering any trade.

BTC Trading in a Range.Support & Resistance Levels:
R1: ~106,300
R2: ~109,000
R3: ~111,600
S1: ~102,800
S2: ~100,000
Bearish RSI Divergence
Price made higher highs earlier (around June 10-11).
RSI made lower highs, indicating bearish divergence.
Price Action
BTC bounced back from below S1 (~102,800) and is now hovering around R1 (~106,300).
If it breaks and sustains above R1, we could see a move toward R2 (109k).
However, failure at R1 can lead to a pullback to S1 or S2 levels.
Strategy Suggestions:
📌 If Bullish:
Wait for a clean breakout above R1 (~106,300) with volume.
Potential targets: R2 (109k) and R3 (111.6k).
📌 If Bearish:
If price fails to hold R1 and rejects, consider short opportunities.
Targets would be: S1 (102.8k) and S2 (100k).
Keep an eye on RSI — if it forms another divergence or crosses down the MA, bearish bias increases.
⚠️ Risk Factors:
BTC is still within a consolidation range between R1 and S1.
No clear breakout yet; be cautious with position sizing.
Watch for macroeconomic news/events, as they can spike volatility.

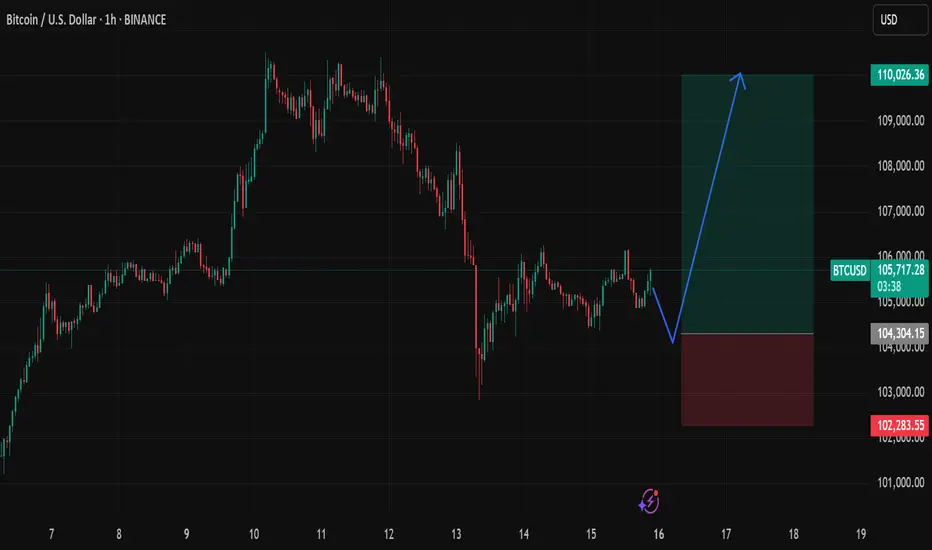
Waiting for a short-term BTC buy — easy setup, clean trade.No need for words — just follow the arrow and check the risk/reward.
I'm starting a signal room soon, but for now, it's all free. Watch and decide for yourself.