BTCUSD 1H levels updated 6/14/25I observe a market structure shift to the downside. Will it continue to the PDH?
BITCOIN trade ideas

Bitcoin in 15 mints time frameCurrently, it's in the consolidation zone
Once it breaks the zone, we can watch the next support/ resistance level

BTC/USD Potential Rebound from Key Support Towards 106,268Bitcoin is currently testing the 104,895 support level after a sharp decline from the upper resistance at 108,468. The price action suggests potential stabilization above this key support zone. If the 104,895 level holds, we may see a bullish move targeting the resistance at 106,268, which aligns with previous price rejection zones.
This area could act as the first profit target for intraday traders. A successful break above 106,268 could open the path for a retest of the 108,468 resistance level.
However, if the price fails to hold above 104,895, the next critical support lies at 103,153, where we previously saw strong bullish momentum. This would be the invalidation zone for the long setup.

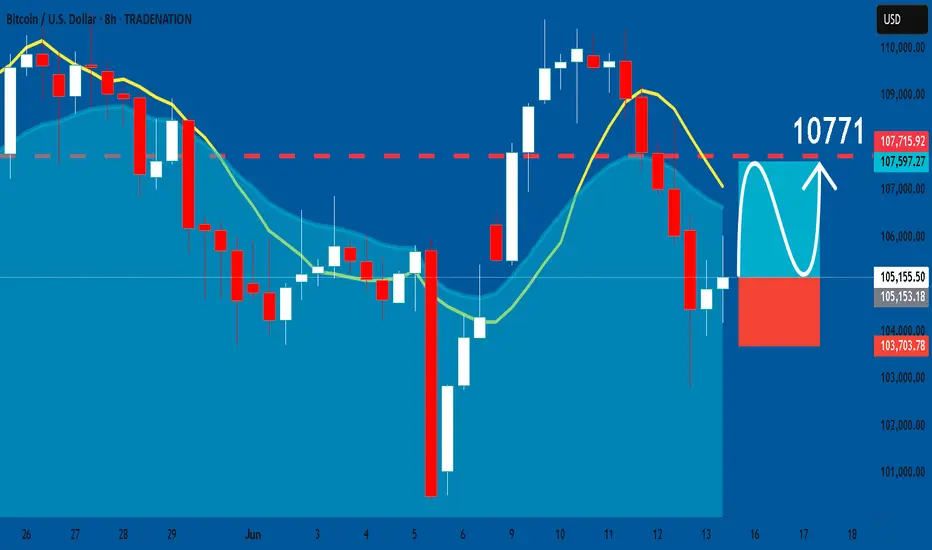
BTCUSD: Long Trading Opportunity
BTCUSD
- Classic bullish formation
- Our team expects growth
SUGGESTED TRADE:
Swing Trade
Buy BTCUSD
Entry Level - 10515
Sl - 10370
Tp - 10771
Our Risk - 1%
Start protection of your profits from lower levels
Disclosure: I am part of Trade Nation's Influencer program and receive a monthly fee for using their TradingView charts in my analysis.
❤️ Please, support our work with like & comment! ❤️
BTCUSD LONG✅ Analysis: BTCUSD has successfully broken its last 15m high (Break of Structure), signaling a potential shift in momentum. I’m looking at the pullback of this break to enter a long position and ride the upward move. Entry is at the demand zone. It might mitigate the fvg and return immediately.
✅ Target: Next key resistance or liquidity area above.
✅ Stop Loss: Just below the last low to minimize risk.

BTC will botom now(sorry I wrote this took quite a long time so the price has moved first)
Summary:
The recent drop in Bitcoin is primarily due to geopolitical tensions specifically the conflict between Israel and Iran. This is interpreted as a short-term market shock rather than a fundamental breakdown. Structurally, the bias remains bullish with expectations of a near-term rebound.
Why is BTC dropping?
The sell-off is driven by global risk aversion due to the geopolitical escalation. Investors are temporarily fleeing into cash and defensive assets like gold. However, this behavior is emotional and not based on a fundamental shift in Bitcoin’s outlook.
Bullish Thesis:
* Bitcoin’s recent decline is not structurally bearish; it's a reaction to short-term uncertainty
* Historically, Bitcoin has shown strength and recovery following global shocks
* The current correction may provide a setup for a relief rally before any further downside movement
* Even if a deeper correction is ahead, the price is likely to move upward first to sweep liquidity or test resistance
Technical View:
* The current price level is a key area from a price action perspective
* BTC is showing signs of rejection at this key support, indicating potential buyer interest
* This level has acted as a significant pivot in previous swings, making it technically important for short-term direction
* If this rejection holds, it may serve as the base for a short-term recovery leg
Correlation Insight – BTC vs. Gold:
* Bitcoin has been showing a moderate positive correlation with gold, particularly during periods of heightened geopolitical risk
* Currently, gold is approaching its major resistance or all-time high level
* If gold reaches this zone, it may trigger profit-taking or sell pressure, prompting a rotation of capital out of gold into BTC
* This potential rotation strengthens the case for a bullish move in Bitcoin, especially if BTC stabilizes around current support
Expectations:
* Near-term bounce or consolidation, followed by a potential breakout toward key resistance levels
* A shift in capital from traditional hedges like gold to crypto could act as a tailwind
* As volatility from the conflict settles, Bitcoin could regain its role as a risk-on asymmetric bet
Conclusion:
The pullback appears to be a temporary, sentiment-driven move rather than a trend reversal. BTC remains fundamentally strong, and the potential reversal in gold adds confluence to a bullish Bitcoin thesis. With price currently showing rejection at a key technical support level, this may be a strategic accumulation zone for mid- to long-term investors.

Bitcoin(BTC/USD) Daily Chart Analysis For Week of June 13, 2025Technical Analysis and Outlook:
Throughout the past week, Bitcoin has exhibited considerable volatility. After reaching a peak at the first Mean Resistance level of 109500, the cryptocurrency experienced a significant decline. Nevertheless, on Friday, Bitcoin demonstrated a notable recovery, ascending to a newly established resistance now designated as the new Mean Resistance level marked at 110300.
At this juncture, Bitcoin is retracing downward as it retests the initial Mean Support level of 104000 while aiming to target the Mean Support at 101500 and the ultimate Inner Coin Dip at 96500. It is essential to recognize the potential for an upward rally from the Mean Support levels of $ 104,000 and/or $ 101,500, which could culminate in a retest of the Mean Resistance level of $ 110,300.

BTCUSD Hey everyone,
Taking a closer look at the BTCUSD chart, I've plotted some interesting price levels that could act as significant support and resistance in the coming weeks. This analysis aligns with what appears to be a trend-based Fibonacci time analysis, and I've also marked some crucial dates where we might see major market changes.
Based on our observations, we're seeing a range of important price action. For instance, notice the cluster of highs around the 112,048 to 113,343 area. These levels, particularly those marked with an asterisk such as 112,167, 112,503, and 113,006, have previously shown strong upward movements, suggesting they could serve as notable resistance if price attempts to push higher.
Conversely, on the downside, the levels from 111,952 down to 110,665, with points like 111,833, 111,499, and 110,832 highlighted, have historically seen bounces or significant slowing of downward momentum. These could very well act as crucial support areas, preventing further declines.
As we move forward, it will be crucial to observe how price interacts with these levels, especially around the following dates where we might see major market shifts:
July 4th, 2025
July 11th, 2025
July 26th, 2025
August 9th, 2025
August 16th, 2025
September 9th, 2025
The higher resistance points reaching up to 118,793 and lower support extending to 105,407 define a broader range we'll be watching closely.
Keep an eye on these zones for potential reversals or breakthroughs, particularly around the dates mentioned, which could signal the next significant move for Bitcoin. As always, manage your risk accordingly.
What are your thoughts on these levels and potential turning points? Share in the comments below!
Want to Level Up?
Join Shunya Trade’s Mentoring Program to master these strategies and sharpen your technical analysis skills.
Your Feedback Matters!
Let me know how this analysis works for you—your insights will shape future reports!
Let’s navigate the markets together—wisely and proactively.
Trade safely!
⚠️ Disclaimer: This post is educational content and does not constitute investment advice, financial advice, or trading recommendations. The views expressed here are based on technical analysis and are shared solely for informational purposes. The stock market is subject to risks, including capital loss, and readers should exercise due diligence before investing. We do not take responsibility for decisions made based on this content. Consult a certified financial advisor for personalized guidance.
Price High Price Low
112048 111952
112084 111916
*112167 *111833
*112335 *111666
*112503 *111499
*112670 *111332
*112838 *111165
*113006 *110998
*113174 *110832
*113343 *110665
114017 110001
*114693 *109339
115372 108678
116052 108020
116734 107364
*117419 *106709
118105 106057
118793 105407

Possible breakdown to 100kGood day!
I noticed this inverted CnH. Could this be a sign to 100k?
#NFA
#TYOR

BRIEFING Week #24 : is Stagflation Coming next ?Here's your weekly update ! Brought to you each weekend with years of track-record history..
Don't forget to hit the like/follow button if you feel like this post deserves it ;)
That's the best way to support me and help pushing this content to other users.
Kindly,
Phil

$BTC Bounced from $103K – Hedge Short Still Active
Bitcoin was supposed to break out, but fear of war changed the plan. Instead of pumping, BTC dropped to retest support around $102,700 — and bounced strongly.
🔸 Key Support Zone: $100K – $99K
This area is holding well for now. But if BTC loses $99K, we could see a deeper drop.
🔸 Short from $108,500 is still open
We’re using it as a hedge in case the market crashes. If the price drops more, we’ll take profit on the short. If BTC goes back up to $108K+, the short will be closed on entry. That’s the best-case scenario.
🔸 What’s Next?
Everything depends on global news. If war fears grow, BTC may drop fast. If things calm down, we could see a strong recovery.
✅ We’re in a strong position — low risk, high reward. No panic. We’re ready for both outcomes.

Weak Pullback, Bears in Control | Will the $100K Zone Hold? BTCUSD – Weak Pullback, Bears in Control | Will the $100K Zone Hold?
🌍 Macro & Fundamental Outlook
Bitcoin continues to face downside pressure after failing to hold above the key $108K resistance. Several macro factors are influencing sentiment:
📉 US bond yields are rising again, as markets expect the Fed to delay rate cuts. This adds pressure on risk assets like BTC.
🪙 Bitcoin Spot ETF inflows remain positive, but are currently not strong enough to counter short-term selling pressure.
💵 The DXY (US Dollar Index) is recovering, as investors flee to USD amid geopolitical volatility in the Middle East.
📊 Institutional liquidity is thinning across exchanges, adding to intraday volatility.
📉 Technical Analysis – H1 Chart
🔹 Trend Structure:
BTC is now firmly in a short-term downtrend, trading below the descending trendline and all key moving averages (EMA 34, 89, 200).
Rejection from every pullback suggests that sellers are still in control.
🔹 Key Price Zones:
Bearish FVG Resistance: 106,096 – 107,004
First Support Zone: 102,821
Major Support Zone: 101,539 → 100,419
A clean break below 100K could open the door to 98,000 and below
🔹 Momentum:
RSI is neutral, hovering around the mid-40s without strong divergence signals.
Selling volume is increasing but not yet explosive — indicating the market may be awaiting a macro catalyst.
🧠 Market Sentiment
Traders are currently in “wait-and-see” mode, eyeing the next round of macroeconomic data and potential Fed commentary.
Short-term profit-taking is dominant after last week’s sharp rally.
Overall sentiment: Bearish short-term – Neutral mid-term – Bullish long-term
🎯 Trade Setup Ideas
🔻 SELL if price retests FVG and gets rejected
Entry: 106,000 – 107,000
Stop-Loss: 107,500
Targets: 102,821 → 101,539 → 100,419
🔹 BUY if price reacts strongly from 100,419 – 101,500
Entry: 100,500 – 100,800
Stop-Loss: 99,800
Targets: 102,800 → 104,400 → 106,000
Preference is given to selling the rally in the short term. Buying should only be considered on confirmed reversal signals at key support.
✅ Conclusion
BTCUSD is currently in a corrective phase, with bears maintaining control. The key level to watch is the $100,419 support zone, which may determine whether Bitcoin maintains its medium-term bullish structure or breaks further. Discipline and confirmation are crucial in this volatile environment.
📌 Strategy Focus: Look to sell rallies toward resistance; buy only on confirmed bounce from strong support zones.

BTC/USD – Bearish Continuation from Rising Channel BTC/USD – Bearish Continuation from Rising Channel 🚨🧱
This chart indicates a bearish market structure with the following key technical features:
🔍 Chart Analysis:
Change of Character (CHoCH) 🔄
A shift from bullish to bearish was confirmed by a strong breakdown after the CHoCH marked at the top.
This breakdown invalidated previous bullish structure.
Bearish Flag Formation 📉📐
After the impulsive drop, price formed a bearish flag (rising channel), suggesting a potential continuation move to the downside.
Resistance Rejection 🚫
Price is currently testing and rejecting the 105,800–106,500 resistance zone, previously a support turned resistance.
The rejection from this level adds further bearish confluence.
Downside Projection ⬇️📍
If the pattern plays out, the projected move shows a potential drop toward the major support zone at 100,000–101,000.
📌 Key Levels:
Resistance Zones:
105,800–106,500 🧱
109,500–111,000 🧱
Support Zone:
100,000–101,000 💚
🧠 Conclusion:
The chart suggests that BTC/USD is in a bearish continuation phase, with strong rejection from key resistance and a confirmed breakdown from a bearish flag. Traders should watch for confirmation of continuation below 104,500 to target the 100k support level. Risk management is crucial near volatile zones.

BTC/USD: Weekend Strategy AnalysisBitcoin is currently fluctuating around $105,500, with volatility mainly driven by Middle East tensions.
After Israel's airstrikes on Iran, market panic spread, causing Bitcoin to drop below $103,000 yesterday. Over 250,000 leveraged investors worldwide were liquidated within 24 hours, totaling $1.16 billion in liquidations—predominantly long positions.
In the short term, geopolitical conflicts have triggered capital flight from high-risk assets. Traditional safe havens like gold and crude oil have surged, while Bitcoin has been sold off. Uncertainties over whether the Middle East situation will escalate or involve the U.S. are suppressing prices.
Long-term, institutions had forecast Bitcoin could reach $200,000 by the end of 2025 based on factors like the halving effect. Some listed companies and institutions maintain strategic positions. If the situation eases, prices may rebound.
BTC/USD
sell@106500-105500
tp:104000~103000
SL:107500
I am committed to sharing trading signals every day. Among them, real-time signals will be flexibly pushed according to market dynamics. All the signals sent out last week accurately matched the market trends, helping numerous traders achieve substantial profits. Regardless of your previous investment performance, I believe that with the support of my professional strategies and timely signals, I will surely be able to assist you in breaking through investment bottlenecks and achieving new breakthroughs in the trading field.

CHECK BTCUSD SIGNAL READ CAPTAINbtcusd sell now ✅
entry point (105.250) (105.150)
TAKE PROFIT 1: (104.750)
TAKE PROFIT 2: (104.200)
LAST TARGET (103.700)
STOP LOSS (105.800)

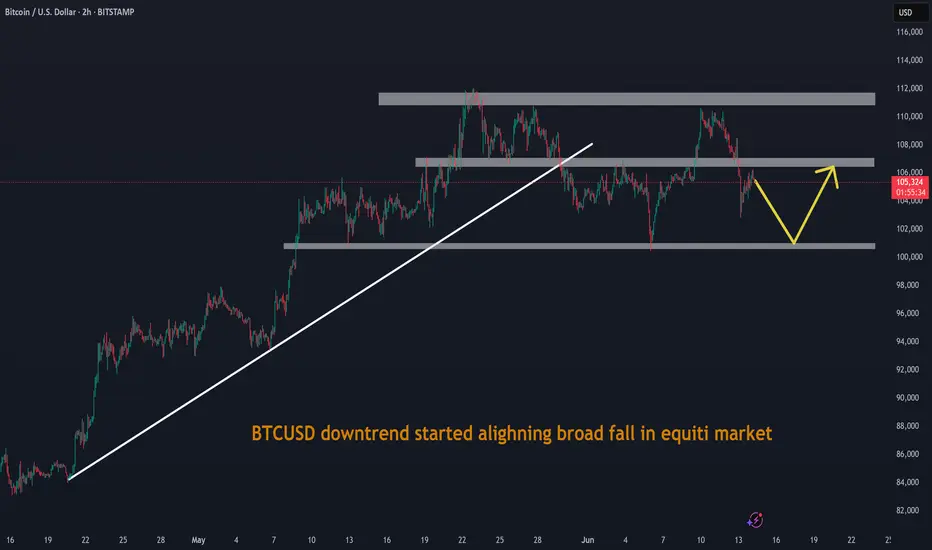
BTCUSD downtrend started alighning broad fall in equiti marketBTCUSD downtrend started alighning broad fall in equiti market
BTC: Is the other shoe going to drop?The move up from June 5th low has been in 3 waves. The current global economic situations have rattled the overall markets this week. Even though BTC is holding the 102k support so far, things are getting much weaker as time passes. If the 102 K support breaks, then we will most likely see a flush down to 95k-90k area. Personally, I will be cautious buyer there. Even a stroll down to 85k won't be super bearish long term. Anything below that might spell bad news. Starting small and assessing the situation will be key. I don't put stop loss on BTC. But, if price keeps getting lower highs, then, breaking 80k will be my signal to get out on the next spike and reassess the situation.


Unfinished downside liquidity Price will have to clear out the downside liquidity and continue to the upside to about $110k

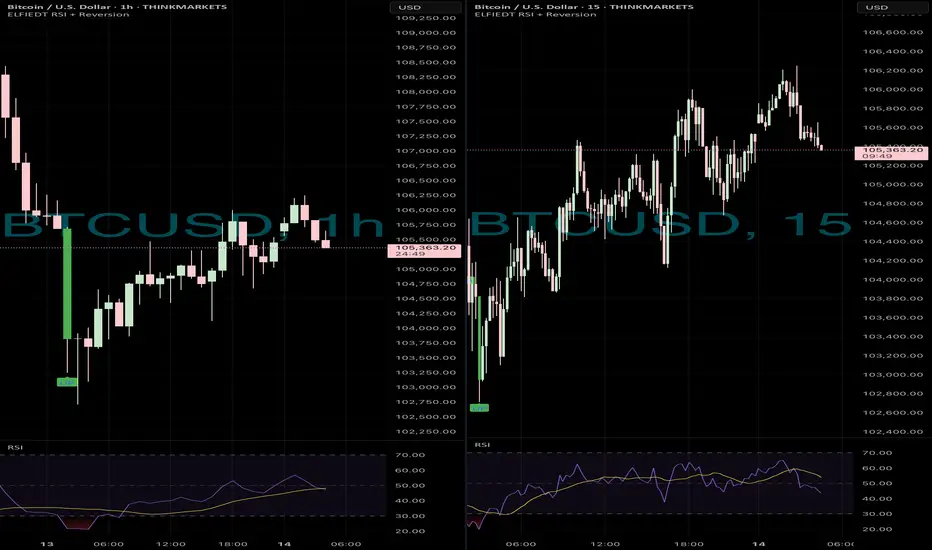
BTCUSD - LONGS📉 BTCUSD Reversion Setup – After the Drop
This dual-timeframe view of BTCUSD shows how the ELFIEDT RSI + Reversion Strategy identified an excellent buy opportunity following a sharp selloff — with signals printing on both the 1H and 15min charts, offering strong confluence for a recovery play.
⸻
🟢 Here’s What Happened:
1. High-Volatility Drop Into Oversold Levels
BTC saw an aggressive downward move, likely driven by news or a liquidation event. Price pushed deep below the lower statistical deviation bands, entering a classic mean reversion zone.
2. 1H Timeframe – Strong “UP” Signal
The 1-hour chart printed a clean “UP” signal right after the bottom formed. This confirmed that the move had extended far beyond normal volatility and that RSI was signaling exhaustion.
3. 15min Timeframe – Supporting Signal with Early RSI Recovery
Shortly before the 1H signal, the 15min chart had already printed an “UP” signal of its own — with RSI sharply recovering from deeply oversold conditions. This served as an early entry signal, with the higher timeframe confirming the broader move.
4. Sharp Bounce Followed
After the signals aligned, BTCUSD quickly rallied over $2,000 off the lows, offering a clean and profitable reversion move.
⸻
✅ How to Use This Type of Setup:
• Watch for aggressive price drops or spikes that push outside statistical volatility bands.
• Look for an “UP” or “DOWN” signal on the lower timeframe (15min) for early entry opportunities.
• Then look for confirmation on the higher timeframe (1H) to strengthen your confidence in the trade.
• RSI recovery across both timeframes adds a momentum-based edge to the mean reversion logic.
⸻
🎯 Why This Worked:
This trade worked because multiple signals lined up at once:
• Deep price extension
• Oversold RSI
• Volume-driven spike
• Multi-timeframe signal agreement
This confluence increases the probability of success and helps avoid false entries during volatility.
Range Bound Before BreakoutDaily: Nice hold on the reversal candle @50 EMA, 103k Support and strong FVG.
Nice volume to support this move when the drop was somewhat due to the attacks involving Israel and Iran.
-We are seeing a slightly lower high and a rejection from that 110 lvl. But as I said on the weekly, w/o a catalyst I think we’ll continue to bounce within the 100-110 range for a bit longer.

BTCLet's wait and see what happens. Most likely, the price will bounce back from the above levels. From whatever level, if the candlestick leaves a shadow without breaking with the body, you can enter the sell from here.

Favorite Fibonacci ChannelI posted about the Fibonacci Channel I regularly use to set my stop loss, mean reversal TP, and breakout TP. It's typically 0.5 for a mean reversion, and the breakout is typically confirmed with a strong move past the 1.27 or -0.27 threshold, with 1.88 as the expected move and Euler's e and Pi as the followed profit targets. The vice versa is true for negative Tp below the zero line. I trade it as low as the 1-minute time frame to as high as weekly, as it works very well, especially when it's preparing a squeeze.
