BITCOIN BIASWe saw price broke a resistance structure followed by an inducement. Currently anticipating a reacting back to either breaker block or order block for a potential entry to go LONG.
BITCOIN trade ideas

BTCUSD LongAfter this correction I´m exspecting one more bullish more for a new alltime high. I placed a buy order with a SL below the 200EMA

$BTC Rejected at Key Resistance – Global War Concerns Pressure P
Bitcoin failed to break above the $110K resistance, facing sharp rejection for the third time. Rising global war tensions have triggered risk-off sentiment across markets, and Bitcoin is now showing signs of a deeper pullback.
🔸 Key Support Zone at 99K – 100K:
This zone is the last strong support holding the bullish structure. A break below it could trigger a larger correction. Eyes on this zone for possible bounce or breakdown.
🔸 Upside Target: 110k+ (Invalidated)
Unless BTC reclaims $110K with strong momentum, upside targets are currently paused.
🔸 Risk Level at 99K:
A daily close below $99K would confirm bearish momentum and open room toward $90K next.
🔸 Outlooks:
Stay cautious due to macro instability (global war risk).
🔹 If price bounces near $99K → short-term long trades possible.
🔹 If it breaks below $99K → prepare for continuation to $90K.
Avoid heavy exposure until the trend clears.

BTC short. Retrace before continuation play.BTC is oversold and we have a 4hr red dot with lower high. Im taking a short here to 107k area then wait if we crash or continue to go higher.

Where I am wrong and where I am rightThis channel is not providing individualized trading or investment advice, nor is it a banking service, brokerage service, trading service, investment service or money management service

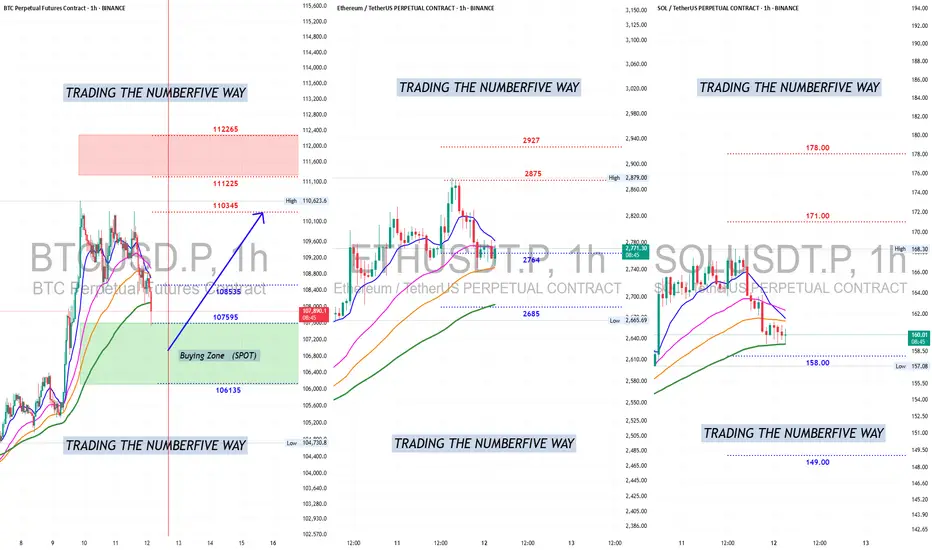
BITCOIN About To Retake UPtrendWell....well...well Bitcoin is doing a beautiful job and is getting to the AREA and TIME where it will turn round to retake its UP trend direction and head towards the ATHs.
107500 to 106000 is the buying zone for SOPT to position and be ready for its next move .
Bears still have a few hrs left mark by the vertical red line (if not sooner) where they will start losing steam and bulls will start taking over.
Place your bets ladies and gentlemen , grab your popcorns and enjoy the ride.
I offer no apology for understanding how it ends.Price and volume are the only honest signals in a system built on distraction. Everything else—news, sentiment, narratives—is lagging and often deceptive. The masses react to what has already happened. By the time they feel certainty, the opportunity is gone.
You buy when the market feels empty, when there's no applause, when doubt is thick. You sell when confidence is universal—because that’s when risk is highest. Most people move with the crowd. But the edge is in reading what the crowd hasn’t noticed yet.
Volume reveals intent before price confirms it. It's the pressure building before the break. But even then, timing is rarely comfortable. The right move often feels wrong in the moment.
If it feels safe, you're probably late. If it feels foolish, you’re probably early and that’s exactly where advantage lives.

BTCUSD CONSOLIDATING AT SUPPORT LEVEL $108192After BTCUSD Made ATH 112320 last month with correction to 101567 then push back to 110326 we can see the price finding 110245 as a major Resistance level a pullback to 108567 shows a strong ranging between 108200 to 110245, with current price trading at 108532,if the support hold strong we can see the price wrestling to 110455

BTC LONG ANOTHER ONE another one !
btc long frm daily bisi wait confirmation ( 1h BISI OR 4H )
TARGET ath

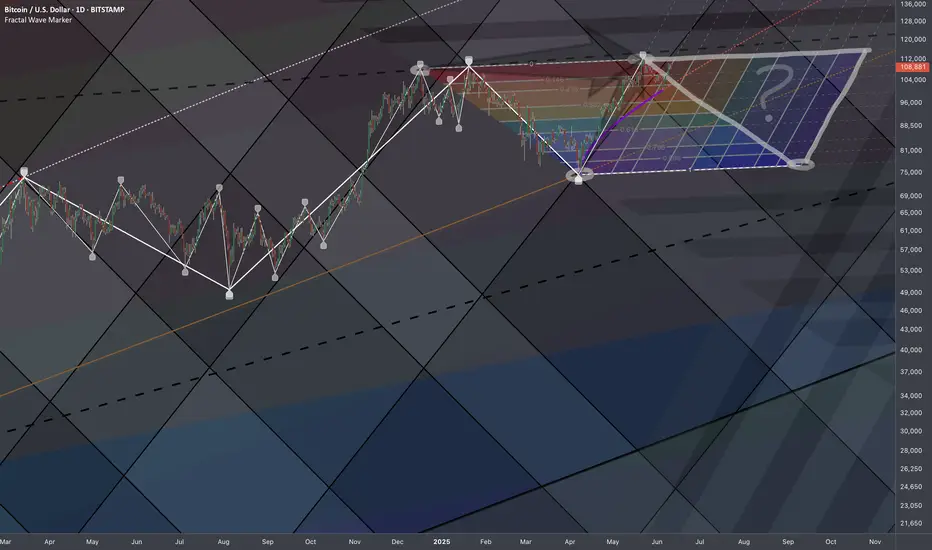
Bitcoin: Temporal ST FibsSo we have consecutive 2 rejections after registering Lower High on bigger scale..
Research Notes
Hypothetically, if it's about to fall based on similar flow of market reactions forming on top then this would be the closest fractal for bearish scenario.
Should be perceived as squeezed version of historic pattern. Not to scale on price axis solely, as increase in volatility can accelerate replication rate at places. The value is in temporal aspect like frequency of reversals.
To be sure I'd add a curve that describes current growth on smaller scale, and which could later on indicate a turning point.
Crossing under would confirm a scenario of bearish continuation.
Experiment
If we connect highs and map it to the local bottom, would the dimensions of original wave carry any structural significance?
Original Fib Channels (price oriented)
Temporal Fibs Sharing common coordinate to define them.
Yet to evaluate this approach for structural buildup. Fibs Channel lines are extended upwards in order to capture the reactions at any scenario.
BTC/USD Analysis – 4H Interval (Sample Workflow)BTC/USD Analysis – 4H Interval (Sample Workflow)
Note: I do not have access to the exact 4H chart from your screenshot, so I will perform the analysis based on the current market situation and typical price zones and setups that are worth following (you can apply them to your chart in TradingView).
📊1. Support and resistance zones
Resistance: 110,000 USD
(the last local peak and the place where a strong supply reaction was visible)
Support: 105,000 USD
(the place of the highest volumes and previous bounces, supported by POC levels from your screenshot)
Next support: 103,000 USD
(important level resulting from previous consolidations)
🔍2. Trend & Price Action
Direction: In the short term, the uptrend dominates (a series of higher lows and highs), but a stronger supply wick has appeared - a local pullback is possible.
Observe: Possible correction to the nearest support zones, rebound from POC/VAL/VAH levels.
Price channels: You can draw a rectangle (channel) between 107,000 and 110,000 as the current volatility range.
📌3. Indicators
Stochastic Oscillator: Close to the overbought zone (above 75) - a signal of a possible short-term pullback.
CHOP (Choppiness Index): Low - suggests that the market has just moved from consolidation to a trend (another strong movement after the correction may develop).
📊4. Candlestick structures
Last H4 candle: Long upper shadow (a possible signal of demand exhaustion).
Watch:
Reversal patterns (e.g. pinbar, engulfing) on support/resistance zones.
🧠5. Scenarios and levels to watch
Bull scenario
Breakout of resistance 110,000 USD → possible quick move to 112,000–114,000 USD.
Condition: Increased volume and closing of 4H candle above resistance.
Bearish scenario
Bounce from 110,000 USD and drop to 107,000 or 105,000 USD.
If 105,000 USD is broken, possible retest of 103,000 USD.

False bull flag breakout Looking for a lower retest 105k. Target 103k.. also see a hidden bear flag on the flow.

BTCUSD: 4H Golden Cross kickstarting $119,000 rally.Bitcoin remains bullish on its 1D technical outlook (RSI = 58.982, MACD = 1643.700, ADX = 1643.700) despite today's high volatility. This volatility displays similar attributes to the Accumulation Phases that were formed since the April 7th bottom. If it follows the symmetry of the first two bullish waves around the first Accumulation Phase, expect a +10% rise from the Phase's bottom. Assuming today is the bottom, the next target of this pattern is 119,000.
## If you like our free content follow our profile to get more daily ideas. ##
## Comments and likes are greatly appreciated. ##

The BTC chart you must see!!!End of July I am suspecting is BTC's break out to approx $150K. Do you agree or disagree?

BTC TARGETS 125K AND 150K BTC should trade up to 125k and 150k but also may run to 175k-200k as well before correcting.

Bitcoins Path?The is how I'm looking to play CRYPTOCAP:BTC over the coming years.
It is my belief that we completed Wave 1 of the SuperCycle and Wave 2 has just begun

NEW ATH Quick flush down to 100K done, tbh was thinking it could drop to 90K but then again price action is king and I've got to go with the flow.
Not a confirmed breakout to all-time highs yet but will happen.
continuation of uptrend 🔒.
BITSTAMP:BTCUSD

₿ Bitcoin: Further Upside ExpectedBitcoin (BTC) pulled back slightly in yesterday’s session but remains on track to continue its corrective rally within green wave B. In line with our primary scenario, this advance is expected to reach the blue Target Zone between $117,553 and $130,891. Afterward, we anticipate the onset of wave C, which should initiate a substantial decline—driving the price down into the lower blue zone between $62,395 and $51,323. This is also where we expect orange wave a to conclude. From there, wave b should provide a temporary rebound before wave c resumes the broader downtrend, ultimately completing blue wave (ii). That said, there’s still a 30% probability that blue wave alt.(i) has not yet topped. In this alternative scenario, BTC would extend higher, potentially breaking above resistance at $130,891 before the corrective phase resumes. The daily chart illustrates the entire five-wave blue sequence and shows our expected low for wave (ii) within the blue zone between $37,623 and $26,082.
📈 Over 190 precise analyses, clear entry points, and defined Target Zones - that's what we do.

$BTC (Bitcoin) update - June 11, 2025In this video I go into our ABC correction theory for a W2 pull back on BTC. I also take a quick look at CRYPTOCAP:ETH , CRYPTOCAP:XRP and CRYPTOCAP:ADA just to see where the rest of the market is at.
- ABC correction theory is still at play, but I wouldn't recommend shorting as a possible accumulation could be happening.
- Levels to watch: 110.8k, 108.5k, 106.8k, 104.9k.

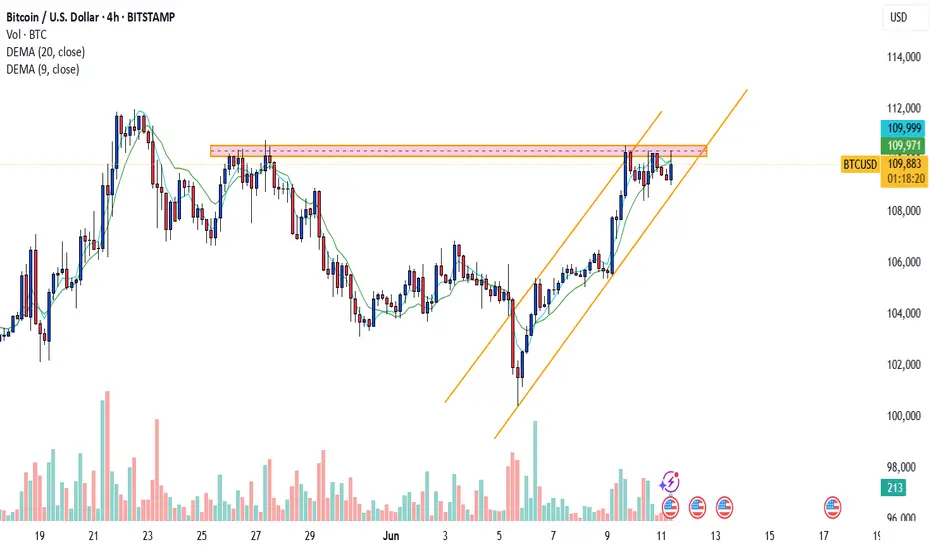
BTC/USD ANALYSISBitcoin is currently facing rejection from a key horizontal supply zone while trading within an ascending channel. The 20 MA is aligning with the channel’s support trendline, providing a strong support base.
A breakout above the supply zone would confirm bullish continuation. However, a breakdown below the channel support could lead to further downside - monitor the price action closely.
4 Analyses with 100% sensitivityBTCUSD - LTCUSD - ETHUSD - XRPUSD
I suggest that if you want to see the strongest price support in these 4 currencies, check out the analysis I posted for these currencies in the past months.

Bitcoin update - 120k soonFollowing my LINK chart, I stated that link tends to lead large Bitcoin pumps. We just noted a huge addition of liquidity to Bitcoin, which has flowed to Eth. Altcoins will follow in a few weeks. Bitcoin will probably be over 120k by end of month. I believe we see a local top around 140k.
BBWP has a lot of room
Stochastic can remain high for a long time for such a volatile asset class

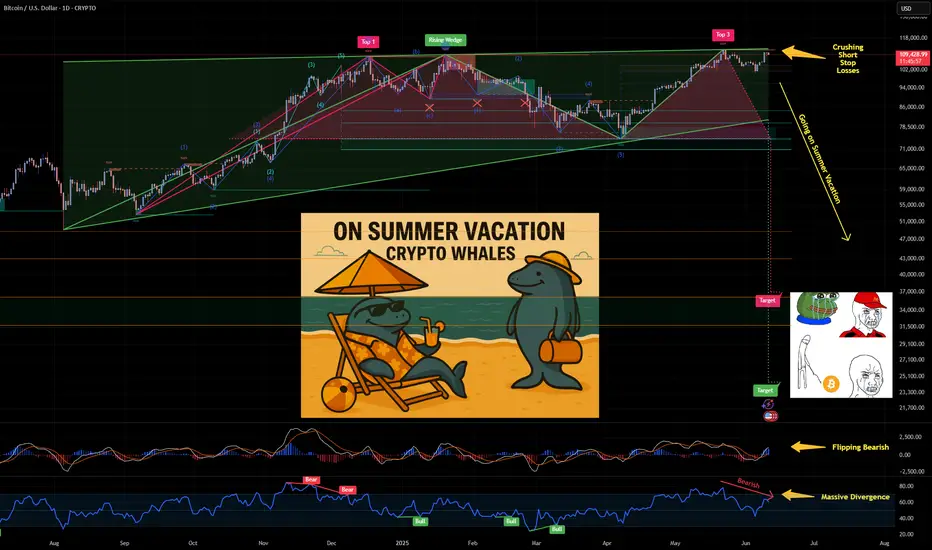
Bitcoin Whales Going On Summer Vacation🚨 Wake Up, Crypto World! 🚨
🔹 Bernstein calls $200K 🔹 CNBC eyes $130K 🔹 BlackRock boasts IBIT is the fastest-growing ETF 🔹 Saylor claims $1M BTC 🔹 Thiel-backed crypto exchange Bullish - has confidentially filed for a US IPO …
Does this sound like "Institutions secretly acquiring Bitcoin"?
NO. This sounds like a desperate call for exit liquidity.
The real accumulation already happened, behind closed doors, away from the headlines. Now they need buyers. Retail FOMO is their exit strategy.
Don't be fooled enjoy the Summer Vacation. 🌴
#Bitcoin #Crypto #ExitLiquidity #MarketCycles #TakeProfits
CRYPTO:BTCUSD INDEX:BTCUSD TVC:GOLD TVC:SILVER NASDAQ:COIN NASDAQ:MSTR