Bitcoin Short: Wave CAfter a 6-days move up after we have hit our target in the previous analysis, I think Bitcoin has completed what I think to be the Wave B and is already on the Wave C run down.
Over in this video, I expressed my personal viewpoint that Bitcoin is not a hedge against the dollar and that it is actually a risk-on/off product more similar to the equities markets like the S&P500. I recommend that anyone who is interested to perform a study on the correlation and beta Bitcoin.
I suggested that the reason why it more closely related to the equity markets is due to it's deep integration within the financial sector (e.g. ETFs, structured products from banks).
Given that I think that the equity markets are primed to crash soon, I think that Bitcoin will follow suit.
Good luck!
BITCOIN trade ideas

BITCOIN wave 5 north losing steam!NewsBTC
Fading Spot Volumes And Muted Futures Sentiment Threaten To Send Bitcoin Below $99,000 Again

Bitcoin is bullish now & many Traders don't see it !!!I currently expect the price to correct slightly, as indicated on the chart, and then pump by about 6% from the PRZ . This signal is reinforced by strong positive divergence and a wedge pattern. In summary, the PRZ is a solid entry point, derived from the confluence of touchlines and pivots. However, if the price ignores this zone and falls below it, my analysis will be invalidated.
Best regards CobraVanguard.💚

btcusd bitcoin entering bear market that will last 1 year to 20kBearish divergence on rsi and mcad indication of bear market that usually last year.
Bottom is approximately 20k were also unfilled CME gap still exists.

Bitcoin sell short bigFirst, we are waiting for confirmation of the twin ceiling. After the support of 72,000 is broken, we will move towards 39,000.

Bull-Flag within a Bull Flag means Exponential gains coming ???As of Friday, June 27, 2025, at 9:41:55 PM PDT, here's an analysis of Bitcoin:
Current Price & Performance:
Last Price: Approximately $107,280.10 (as of June 27, 2025)
Recent Performance: Bitcoin has been showing resilience above the $105,000 mark and has consolidated in a range between $100,000 and $110,000 recently, after hitting an unprecedented price of around $111,814 last month.
Bull Flag in a Bull Flag Pattern (Nested Bull Flags)
A "bull flag" is a bullish continuation pattern characterized by:
Flagpole: A sharp, strong upward price move.
Flag: A period of consolidation or slight retracement that forms a rectangular or parallelogram shape, typically with lower trading volume.
Breakout: A resumption of the uptrend with a strong move out of the flag, ideally on increased volume.
A "bull flag in a bull flag" (or nested bull flag) implies that a smaller bull flag is forming within a larger, ongoing bull flag pattern. This suggests a powerful, sustained uptrend where even the pauses for consolidation are themselves exhibiting bullish continuation characteristics.
Identifying this for Bitcoin:
To identify this pattern in Bitcoin, we would look for the following on a daily or higher timeframe chart:
1. The "Larger" Bull Flag:
Flagpole (Large): Bitcoin's overall parabolic run from its post-bear market lows to its recent all-time highs (e.g., $111,814). This multi-month or multi-year rally constitutes the significant "flagpole."
Flag (Large): The current consolidation phase Bitcoin is undergoing after reaching those all-time highs. This "flag" would be characterized by a broad trading range (e.g., between $100,000 and $110,000, or a wider range after its initial peak). This large flag would be a period of consolidation following the massive flagpole.
2. The "Smaller" Bull Flag (Nested within the larger one):
Flagpole (Small): Within this larger consolidation "flag," Bitcoin might experience shorter, sharper upward impulses. For example, if Bitcoin has a sudden 10% surge from $100,000 to $110,000 within the larger flag. This specific surge acts as the "flagpole" for the smaller flag.
Flag (Small): Following this smaller surge, Bitcoin then enters a mini-consolidation phase (a few days to a week or two), forming a tighter "flag" pattern within the broader trading range. This would be a slight downward or sideways channel on lower volume.
Breakout (Small): A breakout from this smaller flag would see Bitcoin push higher within the larger consolidation range, perhaps targeting the upper boundary of the larger flag (e.g., aiming for $110,000 or new highs).
Current Bitcoin State and the Pattern:
Based on recent market commentary and price action:
Overall Context: Bitcoin is in a long-term bull market, having recovered significantly from previous lows and testing all-time highs. This broad trend provides the context for large "flagpoles."
Larger Flag: Bitcoin's current consolidation around the $100,000-$110,000 zone, after its surge to $111,814, clearly fits the description of a large "flag" forming after a substantial "flagpole." This is a critical consolidation phase for the overall bull run.
Smaller Flag (Potentially Forming): Recent news mentions that Bitcoin surged over 10% since last Sunday (early June 2025) and has been consolidating between $100,000 and $110,000 for over three days. This description fits the start of a nested bull flag:
The 10% surge could be the smaller flagpole.
The consolidation for over three days within the $106,390 - $108,384 range after that surge could be the smaller flag formation.
If this smaller flag resolves to the upside, it would push Bitcoin towards the upper boundary of the larger flag ($110,000 to $112,000) or beyond.
Significance of a Nested Bull Flag:
Strong Underlying Momentum: The presence of a smaller bull flag within a larger one suggests exceptionally strong buying pressure and conviction among bulls. Even during periods of overall consolidation, traders are quick to accumulate on dips, leading to these smaller continuation patterns.
Layered Confirmation: It provides multiple layers of bullish signals. A breakout from the smaller flag reinforces the bullish bias within the larger flag, increasing the probability of an eventual breakout from the larger pattern.
Entry Opportunities: For traders, the smaller flags offer shorter-term entry opportunities within a larger trend, allowing them to capitalize on mini-surges as the broader consolidation unfolds.
Caution:
Confirmation is Key: Like all chart patterns, bull flags require confirmation. For the smaller flag, watch for a decisive breakout above its upper trendline on increasing volume. For the larger flag, the ultimate confirmation would be a sustained break above its all-time high resistance (around $112,000) on significant volume.
Volatility: Bitcoin is known for its volatility, and even continuation patterns can have false breakouts or deeper retracements than anticipated.
Volume: Volume confirmation is crucial. The "flag" portion should ideally show decreasing volume, while the "breakout" should be accompanied by a surge in volume.
In summary, Bitcoin appears to be currently in a large consolidation phase which could be interpreted as a significant "bull flag." Within this larger "flag," recent price action suggests the potential formation of a smaller, nested bull flag, where a recent mini-surge (small flagpole) is followed by a short consolidation (small flag). This indicates strong underlying bullish sentiment, with market participants potentially looking for a push towards the upper boundaries of the broader consolidation range.
This analysis is based on technical patterns and current market information. It is not financial advice. Always perform your own due diligence and consult with a financial professional before making investment decisions, especially in highly volatile assets like cryptocurrencies.

BTC to new ATH, wanna bet?The only objection I have on this trade is 100400 level. If price comes there, I will buy more but for now, I think it will push up from here.
Entry is below 101800 if stoploss is still holding...
TP1 @ 112k
TP2 @ 120k
Enjoy
Follow me as my trades are mainly market orders, so you will see the trades on time and enter on time.
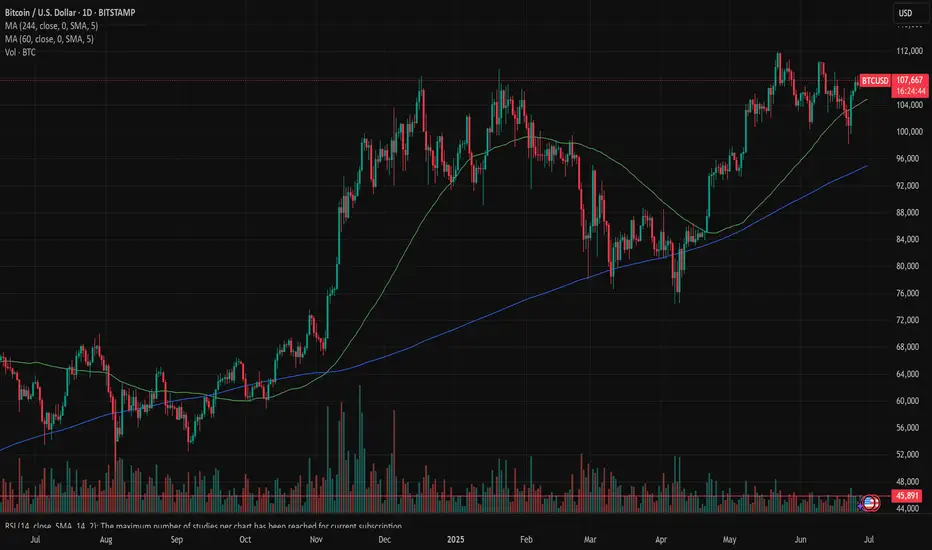
BTCUSD: $150,000 on a repetitive pattern.Bitcoin is neutral on its 1D technical outlook (RSI = 54.823, MACD = 486.400, ADX = 23.402) possibly going through the last consolidation before the next breakout to a new ATH. The whole 2023-2025 Bull Cycle has been on a repetitive pattern, bottoming on the HL Zone and peaking on the HH trendline, while forming clear wave structures. According to this, the next HH should be around 150,000 (TP).
## If you like our free content follow our profile to get more daily ideas. ##
## Comments and likes are greatly appreciated. ##

Bitcoin can correct to support line of channel and start to growHello traders, I want share with you my opinion about Bitcoin. The price was moving inside a strong upward channel, where it managed to break through the support level and then the resistance level, eventually reaching the seller zone. After that, BTC started to turn around and declined, once again breaking through the 109000 resistance level, this time from above. That movement also marked an exit from the upward channel. Following that, the price made a correction move down to the support level — the same zone that previously acted as a breakout area. From there, BTC showed strength again with a bullish impulse upward, returning to the Seller Zone. However, that rally was short-lived. The market started to decline again, this time forming a downward channel. Now the price is approaching the support line of this channel, which coincides with the support level around 100500 and the buyer zone between 99500 and 100500. I think BTC can decline a bit further to test this support line, and then rebound from this area, starting a new upward move toward the channel resistance line. That’s why I’ve set my TP at 106000 points, just below the resistance line. Given the structure and past reactions from these zones, I remain bullish and expect further growth after this local pullback. Please share this idea with your friends and click Boost 🚀
Disclaimer: As part of ThinkMarkets’ Influencer Program, I am sponsored to share and publish their charts in my analysis.

BTC/USD Consolidation Breakout Setup Chart Overview:
The BTC/USD chart shows a strong bullish impulse followed by a consolidation phase just below a key resistance level, suggesting a potential bullish continuation.
🔹 Key Technical Zones:
📍 Support Zone:
105,368 – 106,481 USD
This area acted as a strong demand zone where price reversed aggressively.
📍 Resistance Level:
107,439 – 107,840 USD
Price is currently consolidating just below this resistance, indicating a buildup for a breakout.
🎯 Target Zone:
110,683 – 111,394 USD
A clean breakout above resistance could push price into this target area.
🔹 Technical Signals:
✅ Bullish Flag Formation:
After a strong impulse move, BTC is forming a sideways range, indicating bullish accumulation.
⬆️ Breakout Potential:
A confirmed breakout and retest above 107,840 could validate a move toward the 111K region.
⚠️ Invalidation Point:
A drop below 106,481 would invalidate the bullish bias and may trigger a deeper pullback.
📌 Conclusion:
As long as BTC holds above the 106,481 support and breaks above the 107,840 resistance, bullish momentum is expected to continue toward the 111K zone. Traders should watch for a breakout confirmation and manage risk accordingly. 💹

Updated Chart and Levels. Peace firstVideo:
🕊️💛 Bitcoin Love and Peace! Let's go 🚀🧘♂️
Hello Traders,
The world may be tense, but Bitcoin is offering a beacon of calm and opportunity. 🌍💡 We've established strong support at 106,153 and 105,962, and with peace settling in geopolitically and a softer tone from the Fed, the market is primed for movement.
📊 What I see:
Support is holding beautifully
Short-term breakout structure building up
Immediate resistance at 109,801
Bigger test zones at 113,800 and 114,598
Altcoins? They're sitting in the backseat. BTC dominance is around 65%, confirming that Bitcoin is the leader right now. If you're hunting momentum, this is where your focus should be.
As I always say—never long disaster, never short peace. And right now, with the War of 12 Days behind us, Bitcoin reflects hope and progress.
So let’s trade smart, stay grounded, and always remember—hate makes you part of the problem, love makes you part of the solution. Let’s build a world where even enemies become friends. 💞
One Love,
The FXPROFESSOR 💙
Disclosure: I am happy to be part of the Trade Nation's Influencer program and receive a monthly fee for using their TradingView charts in my analysis. Awesome broker, where the trader really comes first! 🌟🤝📈
BTCUSD SELLSMajor H4 zone has been broken and retest is being made. Possible for price to continue further down to next support zone around 96,000

This is a deception or maybe a technique !!!I think this head and shoulders pattern is trying to deceive us and is fake. I expect the price to drop to the support line and then rise to $109k. WAIT FOR IT....
Give me some energy !!
The Crypto Market Game: How to Win Against Fear and Manipulation
Did you really think profiting from the current bull run (a comprehensive upward market) would be easy? Don't be naive. Do you think they’ll let you buy low, hold, and sell high without any struggle? If it were that simple, everyone would be rich. But the truth is: 90% of you will lose. Why? Because the crypto market is not designed for everyone to win.
They will shake you. They will make you doubt everything. They will create panic, causing you to sell at the worst possible moment. Do you know what happens next? The best players in this game buy when there’s fear, not sell—because your panic gives them cheap assets.
This is how the game works: strong hands feed off weak hands. They exaggerate every dip, every correction, every sell-off. They make it look like the end of the world so you abandon everything. And when the market rises again, you’re left sitting there asking, “What just happened?”
This is not an accident. It’s a system. The market rewards patience and punishes weak emotions. The big players already know your thoughts. They know exactly when and how to stir fear, forcing you to give up. When you panic, they profit. They don’t just play the market—they play you. That’s why most people never succeed: they fall into the same traps over and over again.
People don’t realize that dips, FUD (fear, uncertainty, doubt), and panic are all part of the plan. But the winners? They block out the noise. They know that fear is temporary, but smart decisions last forever.
We’ve seen this play out hundreds of times. They pump the market after you sell. They take your assets, hold them, and sell them back to you at the top—leaving you with nothing, wondering how it happened.
Don’t play their game. Play your own.

I don't know why ???Bitcoin is now at a point where it cannot be ignored! In my view, the bullish wave has started after the corrective wave ended. This wave could continue until it breaks the ascending triangle, then with a slight correction, push the price upward again. The current period and the coming days could be crucial in determining the market's trend.
Best regards CobraVanguard.💚

Wait for something more reliableMorning folks,
Since our last update action was anemic. Nothing has changed seriously. BTC was able to show just minor upside action. Based on current performance, I do not want to take long position right here and prefer to wait for something more reliable. Because BTC action stands rather different from the one that we expected to see.
For example it might be H&S pattern on 1H chart. Thus, an area around 103K seems the one that we will keep an eye on.

110K, maybe 112K at the bestMorning folks,
So, previous setup is done perfect, and BTC even reached 108K area. Now we think that upside potential is limited, at least in short-term. Price is coming to resistance area around 110K and previous top. Some intraday targets point on 112K area as well, but I wouldn't count now on something more extended.
The point is US Dollar stands at record monthly Oversold. So, its weakness in short term is limited as well. Besides, we're coming to very bumpy period of tariffs negotiations from 9th of July, debt ceil discussion and BBB voting, as early as tomorrow...
So for now, uncertainty and risk overcome the upside potential on BTC.

BTC LONG TP:108,000 24-06-2025Big green candle loading… 🚀
I’m looking to long between 105,300 and 105,800, targeting 107,800 – 108,300.
Clean setup with a 3.5 RR average, running on the 1-hour timeframe, expected to play out within 6 to 12 hours.
Technical context: The structure is primed — everything points to a big green candle coming. The setup is locked and ready.
If the move doesn’t happen within the estimated time, the trade becomes invalid.
We don’t use indicators, we’re not out here drawing lines or cute little shapes — I just give you a clean trade.

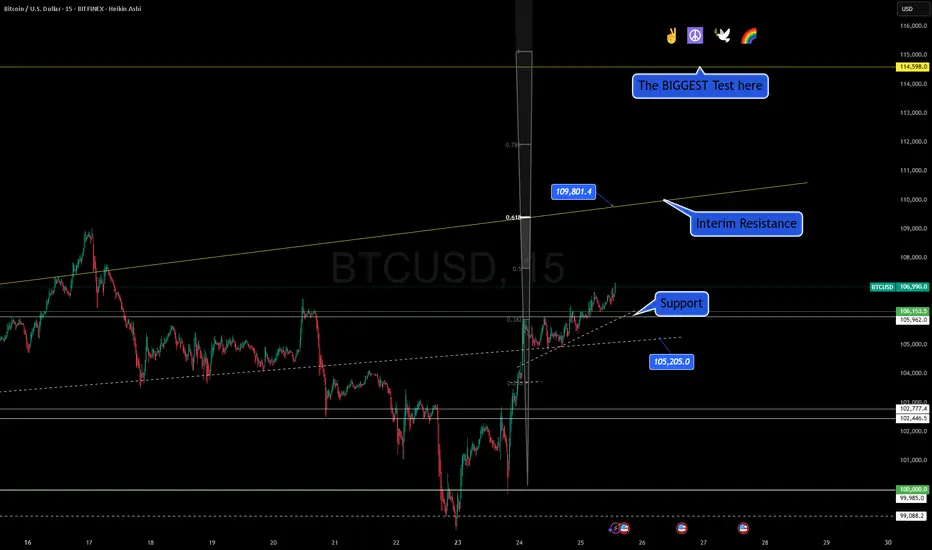
Bitcoin Love and Peace! Let's go🚀📈 Bitcoin Rally Gains Steam with Strong Support in Place 💪🧠
Hello Traders,
After a period of geopolitical tension and heavy volatility, the charts are finally giving us a breath of calm. 🕊️ BTC/USD on the 15-minute chart has formed a solid base of support between 106,153 and 105,962. This area has now held up well and is acting as a launchpad for potential upside continuation.
🔍 Technically speaking, we’re observing:
Price holding above the 0.5 Fib retracement
A short-term breakout structure forming higher highs
Key interim resistance at 109,801
Long-term resistance to watch at 113,800 and the crucial macro test at 114,598
With Bitcoin dominance sitting at 65%, it's clear: this is Bitcoin’s moment. Altcoins are lagging, and BTC is leading the charge.
⚖️ The broader narrative is also shifting. The Fed's dovish tone adds to market stability, and in times of peace, Bitcoin thrives. But the key level to monitor remains 109K. A breakout above that sets us up for a major move.
Let's keep an eye on this structure. A failure to hold the 105K zone would shift the outlook, but for now, all systems are GO 🚦.
🕊️ Remember, in both trading and life—hate divides, love unites. Choose to be part of the solution.
One Love,
The FXPROFESSOR 💙
Disclosure: I am happy to be part of the Trade Nation's Influencer program and receive a monthly fee for using their TradingView charts in my analysis. Awesome broker, where the trader really comes first! 🌟🤝📈

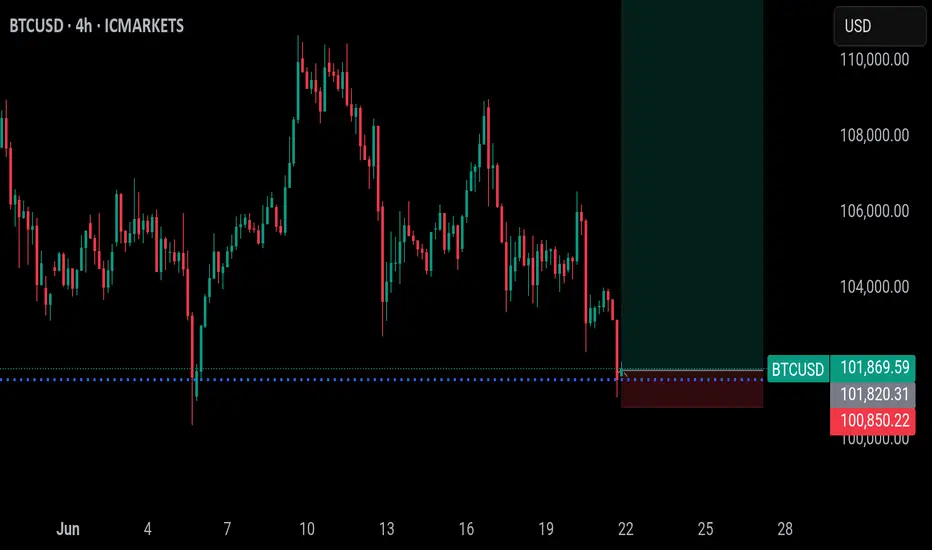
Bullish bounce?The Bitcoin (BTC/USD) is falling towards the pivot and could bounce to the pullback resistance.
Pivot: 103,943.66
1st Support: 101.141.44
1st Resistance: 108,761.68
Risk Warning:
Trading Forex and CFDs carries a high level of risk to your capital and you should only trade with money you can afford to lose. Trading Forex and CFDs may not be suitable for all investors, so please ensure that you fully understand the risks involved and seek independent advice if necessary.
Disclaimer:
The above opinions given constitute general market commentary, and do not constitute the opinion or advice of IC Markets or any form of personal or investment advice.
Any opinions, news, research, analyses, prices, other information, or links to third-party sites contained on this website are provided on an "as-is" basis, are intended only to be informative, is not an advice nor a recommendation, nor research, or a record of our trading prices, or an offer of, or solicitation for a transaction in any financial instrument and thus should not be treated as such. The information provided does not involve any specific investment objectives, financial situation and needs of any specific person who may receive it. Please be aware, that past performance is not a reliable indicator of future performance and/or results. Past Performance or Forward-looking scenarios based upon the reasonable beliefs of the third-party provider are not a guarantee of future performance. Actual results may differ materially from those anticipated in forward-looking or past performance statements. IC Markets makes no representation or warranty and assumes no liability as to the accuracy or completeness of the information provided, nor any loss arising from any investment based on a recommendation, forecast or any information supplied by any third-party.

symmetrical triangle in progressBitcoin has been consolidating at this level for several weeks, easing some of the pressure in order to push above 120K. As of today, we have a clear formation—a large symmetrical triangle—which confirms the continuation of the upward trend and rules out any possibility of returning to lower levels.

BTC LONG TP:108,600 26-06-2025Looks like a classic fakeout before a big move 💥
Entry between 105,800 – 106,450, targeting 108,400 – 108,900, with an average 3.5 RR.
🕐 Timeframe: 1H
⏳ Duration: Fast move
Context: Expecting a quick manipulation before an expansion toward 108,500 – 109,500. The only problem? The stop. Manage it based on your own strategy — this one’s spicy.
If the move doesn’t happen within the expected time, the setup is invalid.
We don’t use indicators, we’re not out here drawing lines or cute little shapes — I just give you a clean trade.

waiting for BTC to reach to demand area#BTC we will buy @107350 with the SL of 106800 for target 109000 and above

Bitcoin: a decision week Previous week brought some relief among market participants, when it was announced that the U.S. Administration and China completed the deal regarding trade tariffs. Details of this deal have not been publicly disclosed, however, the markets reacted positively to it. The U.S. equity market gained significantly, while the crypto market managed to hold higher grounds. BTC started the week with a break of $105K toward the upside, testing the resistance at $108K. The majority of trades occurred between $106K and $107K.
The RSI continued to move above the 50 level, indicating that the market is still not ready to seek the oversold market side. The indicator is ending the week at the 56, bringing some probability for the overbought market side in the coming period. The MA50 continues to diverge from MA200, without an indication that the cross might come anytime soon.
Charts are showing that the BTC is currently on the cross road. There are equal probabilities that the coin might be traded toward both sides in the week ahead. On one hand, trades from the last week showed enough buying orders, which were holding the coin at the higher grounds, continuously seeking the break of the $108K level. However, if this market strength does not manage to support the BTC in the week ahead, then the reversal will be inevitable. In this case, the $105K will be the first stop.