BITCOIN trade ideas
BTC buy now !!!So if you pay attention to the btc chart you can see that the price has formed a Ascending FLAG or wedge which means it is expected to price move as equal as the measured price movement.( AB=CD )
NOTE: wait for break of the FLAG .
Give me some energy !!
✨We spend hours finding potential opportunities and writing useful ideas, we would be happy if you support us.
Best regards CobraVanguard.💚
_ _ _ _ __ _ _ _ _ _ _ _ _ _ _ _ _ _ _ _ _ _ _ _ _ _ _ _ _ _ _ _
✅Thank you, and for more ideas, hit ❤️Like❤️ and 🌟Follow🌟!
⚠️Things can change...
The markets are always changing and even with all these signals, the market changes tend to be strong and fast!!

BTCUSD: Very aggressive rally to 130k has just started.Bitcoin turned bullish again on its 1D technical outlook (RSI = 61.233, MACD = 1503.700, ADX = 19.938) following yesterday's strong 1D candle, which is a result of the June 6th 1D MA50 rebound, and is even close to turning the day positive despite the correction early on. This rise is similar to the one that started after the April 7th rebound and eventually pearked just under the 2.382 Fibonacci extension. We remain bullish on Bitcoin, TP = 130,000.
## If you like our free content follow our profile to get more daily ideas. ##
## Comments and likes are greatly appreciated. ##

₿ Bitcoin: Push to the Upside! Bitcoin has made a significant push to the upside, which brought it closer to the upper blue Target Zone between $117,553 and $130,891, where we primarily expect the corrective rise of green wave B to conclude. We consider this price range an opportunity to take partial profits or to open short hedges for tactical protection of existing long positions — thus, we don't plan to sell all our Bitcoin holdings there. Potential short hedges could be secured with a stop 1% above the upper edge of the zone since there's a 30% chance that price could exceed this zone to develop a new high for blue wave alt.(i) before reversing later. Primarily, however, green wave C should commence in the upper blue zone and drive BTC down into the lower blue zone between $62,395 and $51,323—and thus to the low of orange wave a.
📈 Over 190 precise analyses, clear entry points, and defined Target Zones - that's what we do.

Bitcoin Rally is almost over! Btc has been performing as expected and now, I expect it to reach either till the upper channel, which is clearly a reversal pattern) or beyond it to the Fib 100 to complete the 5th wave. This is a high probability setup considering the market conditions.
So before the rally stops, is gonna make a new high.
Any feedback is appreciated! :)
BITSTAMP:BTCUSD

Bitcoin - Here we have the all time high!Bitcoin - CRYPTO:BTCUSD - is just getting started:
(click chart above to see the in depth analysis👆🏻)
It was really just a matter of time until we see a new all time high on Bitcoin. Consindering that over the past two months alone, Bitcoin rose another +50%, this was a clear indication that bulls are taking over. But this all time high is clearly not the end of the bullrun.
Levels to watch: $300.000
Keep your long term vision!
Philip (BasicTrading)

Japan’s Metaplanet to Invest $5.4 Billion in Bitcoin: A Bold StrAmid growing global interest in cryptocurrencies, Japanese investment firm Metaplanet has announced plans to invest $5.4 billion in Bitcoin. This strategic move places the company alongside the largest corporate Bitcoin holders and reflects Japan’s evolving financial stance, where digital assets are beginning to play a more prominent role.
According to Metaplanet, the firm intends to acquire approximately 210,000 BTC by 2027, representing nearly 1% of Bitcoin’s total supply, which is capped at 21 million coins. This initiative is aimed at hedging against inflation and the depreciation of the yen, while also strengthening the company’s position in global financial markets.
Unlike traditional funds, Metaplanet is committed to a long-term holding strategy (hodling) rather than speculative trading. This signals growing confidence in Bitcoin as a store of value comparable to gold. The company also anticipates increasing institutional demand and the potential recognition of Bitcoin as a reserve asset by central banks.
This move is also seen as a step toward legitimizing Bitcoin across Asia. Analysts suggest that other Japanese and South Korean companies may soon follow Metaplanet’s lead.
The $5.4 billion Bitcoin investment is more than a financial move—it’s a statement about the future. Metaplanet is showing that digital assets are becoming an integral part of modern macroeconomic strategy.

BTC target months ago has been on point, "NEW" TargetsSo far our CRYPTOCAP:BTC 109 - 111k target has been MONEY!
Bitcoin hasn't been able to close above it all!!!
Showing Negative divergence on RSI & $ Flow on WEEKLY charts.
"New" CRYPTOCAP:BTC prediction?
Will stand by what we said previously. IMO there's good possibility we could see BTC going to the 170k area, extreme = 226K.
Monthly RSI doesn't peak until it hits 90's BUT there's Negative Divergence forming.
$ FLOW slowly diverging as well.
VOLUME DYING on SPOT. Not so bad on Futures.

Analysis of the Current BTCUSD Trend and Trading RecommendationsFrom a technical perspective, the bearish trend in BTC is temporarily dominant. On the four-hour chart, the price has trended downward with consecutive negative candles after being pressured, clearly indicating a bearish trend. Although small lower shadows suggest that bulls and bears are still locked in a tug-of-war, the RSI indicator is near the overbought zone at 70, and while the MACD remains positive, its momentum continues to weaken—both signals imply insufficient upward momentum and lingering adjustment pressure.
On the hourly chart, BTC has entered a consolidation phase with alternating positive and negative candles after a unilateral downward move. Currently, the Bollinger Bands are narrowing and moving sideways, indicating that future volatility may be limited. The price is now hovering near the upper band of the range, facing technical resistance.
In terms of the afternoon trading strategy, given the bearish dominance and fading upward momentum, the focus should remain on shorting at highs. Aggressive traders can lightly position for short-term rebounds but must use small positions and set strict stop-losses; prudent traders should wait patiently for higher levels to initiate short positions.
BTCUSD
sell@109800-110300
tp:108500-107500
Investment itself is not the source of risk; it is only when investment behavior escapes rational control that risks lie in wait. In the trading process, always bear in mind that restraining impulsiveness is the primary criterion for success. I share trading signals daily, and all signals have been accurate without error for a full month. Regardless of your past profits or losses, with my assistance, you have the hope to achieve a breakthrough in your investment.

BTCUSD: weekly overview for trading!Hello Traders, I'm mostly an investor for this instrument.
for this week we are struggling hard in middle of a long-term channel and also the effect of halving cycles could move the instrument more and more down.
But I'm waiting for good news form USD weakness. I'm still more bullish for Bitcoin.
****************
The indicated levels are determined based on the most reaction points and the assumption of approximately equal distance between the zones.
Some of these points can also be confirmed by the mathematical intervals of Murray.
You can enter with/without confirmation. IF you want to take confirmation you can use LTF analysis, Spike move confirmation, Trend Strength confirmation and ETC.
SL could be placed below the zone or regarding the LTF swings.
TP is the next zone or the nearest moving S&R, which are median and borders of the drawn channels.
*******************************************************************
Role of different zones:
GREEN: Just long trades allowed on them.
RED: Just Short trades allowed on them.
BLUE: both long and short trades allowed on them.
WHITE: No trades allowed on them! just use them as TP points

Bitcoin priming itself for a cup of upside to 146,942!MAJOR Cup and Handle is forming on the one and only Bitcoin.
TOp institutions are paying 100s of millions of dollars into the crypto with the idea that it's going to rocket to $200,000.
But baby steps, because the chart is definitely showing upside to come. First it will have to break through the brim level first before we even get a STRONG buy.
Price> 20 and 200MA
Target 146,942
Disclosure: I am part of Trade Nation's Influencer program and receive a monthly fee for using their TradingView charts in my analysis.

Full Cycle BTC Trendline Mid-2023 to Bull 2025Trendline stretching from mid-2023 lows through the entire bull structure into 2025.
Unbroken since inception
Touched 3+ times
Currently being retested from above
BTC is retesting the primary uptrend
Price dipped below it in April → false breakdown
May-June recovery has reclaimed it
Now sitting right at the trendline, testing it as resistance-turned-support
This is the ultimate decision zone
A daily or weekly close above $110K confirms the trend resumed
Rejection here → opens the door for retrace to $98K–$100K

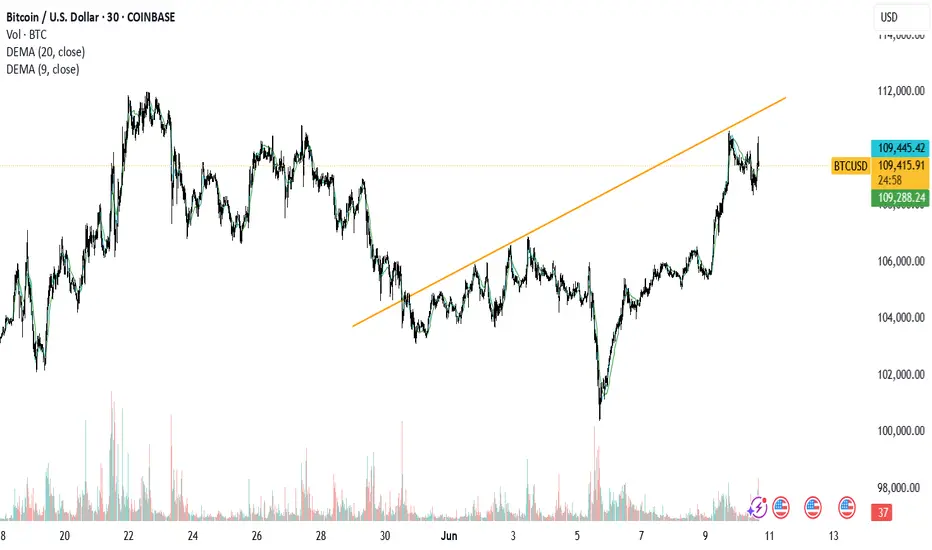
Bitcoin Daily Price ChartThis is a chart of Bitcoin daily pricing on Coinbase.
Showing the major trendline. Support level and resistance level.
Momentum indicators are positive.
For informational purposes only.

$Btc Rejected at $110K – Will $106K Hold or Is $95K Next? #BTC/USD is showing signs of another lower high after facing strong rejection near the $110,000 resistance zone. The price is currently testing the $106,000 support area, a level that may serve as a crucial retest zone. If buyers step in here, we could see a bullish rebound and potential push toward a new high.
However, if $106K fails to hold, the next support zones to watch are $100K and $95K. A breakdown below $106K opens the door for a deeper correction, possibly targeting $95,000 – a key demand area from previous structure.
Supporting this bearish pressure, the RSI is dropping from the overbought zone, signaling increasing selling momentum. Historically, such RSI movements have coincided with local tops and short-term pullbacks.
🔍 Key Levels:
Resistance: $110,000
Support 1: $106,000 (retest zone)
Support 2: $100,000 (psychological level)
Support 3: $95,000 (major structure support)
📊 Outlook: Watch price action closely at $106K. A strong bounce could reignite bullish momentum. A break below this level may confirm the start of a deeper retracement.

BTC INTRADAY Bullish breakout supported at 103850Trend Overview:
Bitcoin (BTC/USD) remains in a bullish trend, characterised by higher highs and higher lows. The recent intraday price action is forming a continuation consolidation pattern, suggesting a potential pause before a renewed move higher.
Key Technical Levels:
Support: 103,330 (primary pivot), followed by 100,680 and 97,700
Resistance: 113,040 (initial), then 115,510 and 117,510
Technical Outlook:
A pullback to the 103,850 level, which aligns with the previous consolidation zone, could act as a platform for renewed buying interest. A confirmed bounce from this support may trigger a continuation toward the next resistance levels at 112,360, 113,740, and ultimately 116,400.
Conversely, a daily close below 103,850 would suggest weakening bullish momentum. This scenario would shift the bias to bearish in the short term, potentially targeting 102,340 and 100,890 as downside levels.
Conclusion:
BTC/USD maintains a bullish structure while trading above the 103,850 support. A bounce from this level would validate the consolidation as a continuation pattern, with upside potential toward the 112,360 area. A breakdown below 103,850, however, would invalidate this view and suggest deeper corrective risk.
This communication is for informational purposes only and should not be viewed as any form of recommendation as to a particular course of action or as investment advice. It is not intended as an offer or solicitation for the purchase or sale of any financial instrument or as an official confirmation of any transaction. Opinions, estimates and assumptions expressed herein are made as of the date of this communication and are subject to change without notice. This communication has been prepared based upon information, including market prices, data and other information, believed to be reliable; however, Trade Nation does not warrant its completeness or accuracy. All market prices and market data contained in or attached to this communication are indicative and subject to change without notice.

SPY/QQQ Plan Your Trade For 6-10 : POP PatternToday's POP pattern suggests a potential big price move will take place. Given the overnight activity on the ES (rallying higher then rolling over), I suggest today's price move may attempt to retest these overnight highs, then repeat the breakdown phase into the close.
The markets continue to try to melt upward. This trend will continue until the markets decide to break downward.
After the deep low created by the tariff news, the markets continue to try to rally to new highs. It is very likely that Q2 earnings data may push the SPY to new ATH levels before we see any big rotation in price.
The markets have a tendency to move just above recent highs, then stall and revert downward as a pullback. This move may be no different.
The continued stalling of price trying to move higher recently suggests the markets are running into moderate resistance and I believe traders are actively pulling capital away from this rally.
The trend is still BULLISH. Stay cautious of this upward move as a breakdown could happen at any time.
Gold and Silver are moving into an impressive rally phase. Silver and Platinum have moved considerably higher over the past 10+ days. I believe Gold is lagging and will make a big move higher over the next 5 to 10+ days.
Silver is targeting $41-44+. Gold should target $3400 to $3500+ near the same time.
Bitcoin made a huge rally yesterday - reaching my 110,500 upper resistance level. Now, we see if Bitcoin has the momentum to carry higher or if it will fail and rollover into a downtrend.
It seems we are right as a MAKE or BREAK level in the markets. I'm still a believer of MELT UP until it fails.
I continue to watch for technical failure - but I've not seen it happen yet.
Get some.
#trading #research #investing #tradingalgos #tradingsignals #cycles #fibonacci #elliotwave #modelingsystems #stocks #bitcoin #btcusd #cryptos #spy #gold #nq #investing #trading #spytrading #spymarket #tradingmarket #stockmarket #silver

BTCUSD Descending channel breakout strong bullish BITSTAMP:BTCUSD Breakout Alert!
4H Timeframe Technical Analysis by Livia 😜
Bitcoin has officially broken out of its descending channel with strong bullish momentum! 📈
Entry Level: $105,500 ✅
📌 Technical Targets:
🎯 1st Target: $106,800
🎯 2nd Target: $108,700
🎯 3rd Target: $110,300
Momentum looks solid—watch for retests and continuation patterns for additional entries. Always manage risk. 🛡️
👇 Like, Follow, and Comment your thoughts!
💬 Join us for real-time updates, setups & insights!
#Bitcoin #BTCUSD #CryptoTrading #BreakoutAlert #TechnicalAnalysis #LiviaTrades

BITCOIN BULLS ARE GAINING STRENGTH|LONG
BITCOIN SIGNAL
Trade Direction: long
Entry Level: 103,835.09
Target Level: 109,309.96
Stop Loss: 100,185.18
RISK PROFILE
Risk level: medium
Suggested risk: 1%
Timeframe: 9h
Disclosure: I am part of Trade Nation's Influencer program and receive a monthly fee for using their TradingView charts in my analysis.
✅LIKE AND COMMENT MY IDEAS✅

BTC Short. Its time to correctionStrong Sell Limits sitting at our entry level!
SELL LIMIT / SWING TRADE
ENTRY: 106106.3
SL: 109676.8
TP: 93409.1
Bearish trend is active and this would be the time for correction and even maybe for 91350 gap close .
Join our free DC group for more and faster news about market. Forex,Crypto,Stocks - Fifteenmin crypto group. Dm me if you enjoy this idea.

Weekly trading plan for BitcoinAt the moment we see a very positive growth, after a rapid fall. The price has already got a reaction from the resistance zone formed on the chart and is now in a local correction. We can expect an ATH update, but the local correction may last a few days. Also noted an important level and in case of its breakdown there are more chances for a decline
Write a comment with your coins & hit the like button and I will make an analysis for you
The author's opinion may differ from yours,
Consider your risks.
Wish you successful trades ! mura

BTC'S ALL TIME HIGH IS CLOSENice move. Yesterday had a massive daily candle, moving from ~105K to ~110K. The volume was less than impressive, which should always give us a bit of pause, but still a nice upside pop through a key level of resistance.
The all time high is in site - we need to see it break on volume convincingly.

BTC, ETH and SOL UPDATEWhat a nice move and a beautiful controlled pullback, bulls doing a great job.
Alright ladies and gentlemen lets get ready for the 2nd stage of this leg UP.
Once this little pullback is done ( probably by late Tuesday Pac Time) price should
start moving UP again to get rid off those shorts above 111000 and continue its journey
to break the ATH .We will follow the move until bears are ready to take over so Stay tuned.

BTCUSD: Buy AlertCurren halving cycle top will be reached in August/September. Expecting crazy buying till then and maybe another bubble price of 280000-300000 till we fall back till 60000 next year. Leverage on MSTR or Metaplanet
