MASSIVE NEW BREAKOUT - LiveMassive New Breakout in Bitcoin at Dual Resistance
Post with emojis:
🚨💥 Massive New Breakout in Bitcoin at Dual Resistance 📈🔥
Okay, time to revisit the BTC chart because we’ve just arrived at a crucial intersection that could define the next major move!
In our previous update, we anticipated a dip — and it played out perfectly. Using Fibonacci support, we entered long right at the sweet spot, just before a strong upward move that tested resistance levels.
And now... it’s official — BTC has just broken through that massive dual resistance! 🚀
This breakout pushes us back into the ascending channel, which had previously flipped to resistance. Two major technical levels — white and yellow zones — just got cleared in one explosive move.
What's next?
🔹 Monitor for a possible retest of the breakout zone
🔹 Eyes on the 113 key resistance — that’s the next likely magnet for price
🔹 For those already in longs (like me), it’s smart to take partial profits and trail stops 🧠💼
This is a textbook breakout structure, and we’ll need to watch volume and structure confirmation closely.
One Love,
The FXPROFESSOR 💙
Disclosure: I am happy to be part of the Trade Nation's Influencer program and receive a monthly fee for using their TradingView charts in my analysis. Awesome broker, where the trader really comes first! 🌟🤝📈
BITCOIN trade ideas

Massive New Breakout in Bitcoin at Dual Resistance- LiveMassive New Breakout in Bitcoin at Dual Resistance
Post with emojis:
🚨💥 Massive New Breakout in Bitcoin at Dual Resistance 📈🔥
Okay, time to revisit the BTC chart because we’ve just arrived at a crucial intersection that could define the next major move!
In our previous update, we anticipated a dip — and it played out perfectly. Using Fibonacci support, we entered long right at the sweet spot, just before a strong upward move that tested resistance levels.
And now... it’s official — BTC has just broken through that massive dual resistance! 🚀
This breakout pushes us back into the ascending channel, which had previously flipped to resistance. Two major technical levels — white and yellow zones — just got cleared in one explosive move.
What's next?
🔹 Monitor for a possible retest of the breakout zone
🔹 Eyes on the 113 key resistance — that’s the next likely magnet for price
🔹 For those already in longs (like me), it’s smart to take partial profits and trail stops 🧠💼
This is a textbook breakout structure, and we’ll need to watch volume and structure confirmation closely.
One Love,
The FXPROFESSOR 💙
Disclosure: I am happy to be part of the Trade Nation's Influencer program and receive a monthly fee for using their TradingView charts in my analysis. Awesome broker, where the trader really comes first! 🌟🤝📈

BTC SHORT IDEAProvided the market sentiment remains the same we can continue to temporarily ride the bearish trend. Any insights would be welcome as I am a new trader.

BTC/USD: Today's Strategic AnalysisBTC has continued the analyzed upward trend. After testing the resistance area above 110,000, it began to decline. A small-scale decline is expected during the day, and short-term traders can try shorting.
BTC/USD
Sell@110000-111000
tp:108000-107000
I am committed to sharing trading signals every day. Among them, real-time signals will be flexibly pushed according to market dynamics. All the signals sent out last week accurately matched the market trends, helping numerous traders achieve substantial profits. Regardless of your previous investment performance, I believe that with the support of my professional strategies and timely signals, I will surely be able to assist you in breaking through investment bottlenecks and achieving new breakthroughs in the trading field.

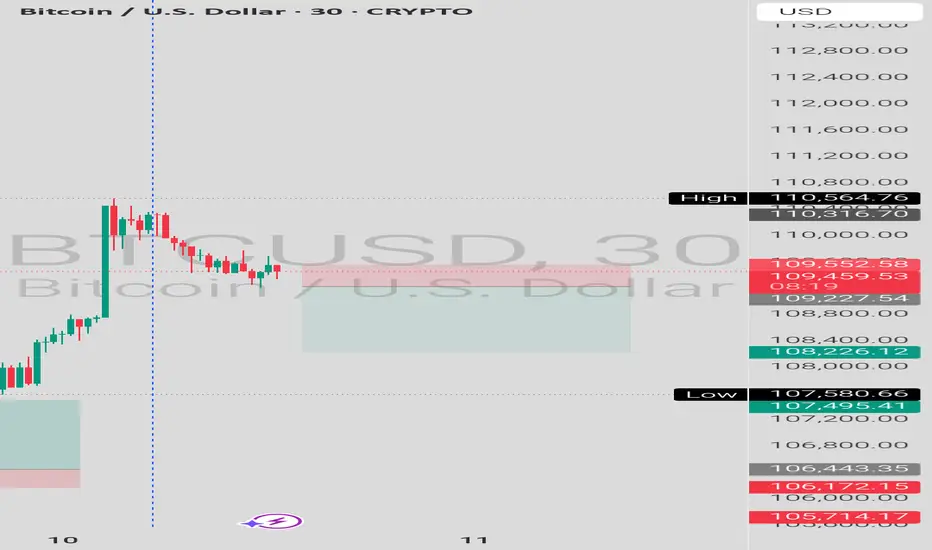
BTC Rejected Hard from Supply Zone – Major Downside Levels AheadBitcoin has just shown a clear rejection from the high-volume supply zone at ~$109,200, marked by strong sell pressure and a visible drop in momentum. 📊
💡 Key Observations:
Supply Zone: $108,900–$109,400 (Price stalled and reversed from this area)
Support Levels to Watch:
🔵 $105,416 – Mid-range level, possible short-term support
🔵 $101,481 – Major demand zone from previous consolidation
Demand Zone Highlight: Around $101,000–$100,000 – high probability bounce area with historical buying interest
📉 Bias: Bearish short-term unless price reclaims $109,500 with volume.
🚨 Trade Idea (Not financial advice):
Sell below $108,800
TP1: $105,400
TP2: $101,500
SL: Above $109,500
🔄 Volume dropping, sellers in control, and a clean range is forming. Watch for a break below $105k for confirmation of the downside move.
⚡️Note the lightning icon at the bottom – this could signal a potential high-impact move or liquidity sweep coming soon.
---
📍 Chart: BTC/USD 15M | Supply & Demand Zones 🔧 Tools: LuxAlgo S&D, Volume Profile
#Bitcoin #BTC #CryptoTrading #SupplyAndDemand #LuxAlgo #PriceAction #BTCAnalysis #BTCUSD #DayTrading #CryptoTA #TechnicalAnalysis #Scalping #Bearish #ShortBTC

CHECK BTCUSD SIGNAL READ CAPTION(btcusd) sell zone
( trade satup )
entry point (109275) to (109085) 📊
first tp (108525)📊
2nd target (107850) 📊
last target (107000) 📊
stop loss (109725)❌

BTCUSD – continuing to buy as breakout confirms bullish setupBTCUSD is forming a classic “cup and handle” pattern, now breaking above key resistance. Price is holding within an upward channel, and if momentum stays strong, the next target could reach 160,000 and beyond.
It might seem hard to believe, but the structure points to continued bullish momentum. I’m not missing this opportunity and continue to build long positions as this breakout develops.

Hellena | BITCOIN (4H): LONG to resistance area of 115,000.I see that price has shown a violent rise in a five-wave move and I have redrawn the waves a bit to make it clear where to expect a correction. I think we are currently seeing a correction in wave “4” (104,000).
But most importantly, I expect an update of the high. Therefore, I believe that the level of 115,000 will be reached and it may be a wave “5”, after which we can expect a deeper correction.
Manage your capital correctly and competently! Only enter trades based on reliable patterns!

BTCUSDBTCUSD
According to current high outlook
Expectation good amount of profit booking at the high levels.
Follow the chart for points. For upcoming down side movements in short term.
For educational purposes
Follow for more update.
Stay tuned.
And comment your chat I'm always ready to reply you.
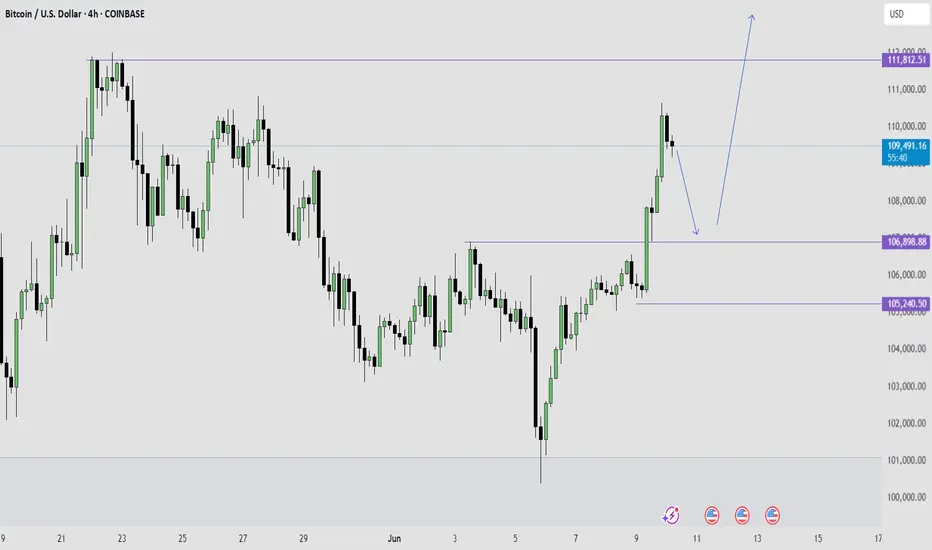
Bitcoin is Super Bullish Right Now - Here is my BTC trade planSince Bitcoin is super bullish on monthly and weekly time frame, my focus is to trade trend continuation pull backs on the 4HR time frame.
For this particular trade, I want to see a pull back to a key level of either imbalance or the old high serving as new support for price.
I will be taking a bullish trend continuation setup on that 4HR pull back.
Target:
I expect to see Bitcoin break that all time high of 111k level and go as high as 150k per one.
BTCUSD Technical Analysis (MMC) – Resistance or Target Zone🔍 Overview
Bitcoin has executed a strong bullish recovery over the past few sessions, breaking out of a well-structured bullish channel and testing a significant resistance zone. The move exhibits traits often identified in MMC strategies, including liquidity grabs, engineered price action, and trap-based breakouts.
This chart analysis combines curve support structures, channel dynamics, and resistance reactions—all crucial components of technical strategy layered with smart money behavioral cues from MMC.
🔹 Price Action Breakdown
📈 1. Blue Ray – Liquidity Shift Signal
The bullish impulse was initiated from what is labeled the "Blue Ray" zone—a deep liquidity pocket often used by smart money to trap sellers.
This area marks a liquidity sweep after a steep selloff, creating the perfect environment for institutional buy orders to fill before driving price upward.
📉 2. Channel Formation & Breakout
A clean ascending bullish channel formed during the rally, showing a methodical stair-step price climb.
This consolidation phase provided multiple reentry opportunities before a sharp breakout, which signals a transition from accumulation to expansion, often seen in MMC mapping.
🧭 3. Curve Support – Parabolic Price Action
Price hugged a curve support line, often interpreted as a parabolic base.
This curve reflects increasing momentum—buyers are stepping in earlier at each dip, creating higher lows in a tightening arc.
This structure is also commonly seen in smart money accumulation zones as price is pushed upward while retail sentiment lags.
🚧 4. Resistance Zone – High Interest Reversal Region
BTCUSD is now inside a key resistance zone (~$109,800–$111,500), which has acted as both supply and previous swing highs.
MMC traders often identify these zones as trap areas, where price gets aggressively pushed up to fill institutional short orders.
This zone contains high sell-side liquidity, meaning there's a strong chance for a reversal or false breakout.
🔄 5. Projected Reversal Zone
A potential correction could bring price down to the next reversal zone (around $106,500–$107,500).
This zone is supported by:
The curve structure, which is still active.
Previous minor resistance turned support.
Institutional demand likely waiting to reload long positions.
📉 Possible Scenarios
✅ Bullish Continuation
If BTC can break and sustain above $111,500, especially with strong volume, it will likely push into new local highs.
In this case, curve support may be used for re-entry on pullbacks.
❌ Bearish Reversal Setup
A rejection from this resistance zone—especially with a long-wick candle, engulfing pattern, or divergence—could confirm a short-term top.
MMC-style reversals often occur quickly and aggressively, trapping late buyers.
⚙️ Trade Management Insights
Trade Setup Entry Area Target Stop-Loss Notes
Aggressive Short ~$110,800 ~$107,500 ~$111,800 Only on strong rejection pattern
Conservative Long ~$107,000 Retest $110,000+ Below $105,500 Only if curve support holds clean
Breakout Buy Above $111,800 Open upside Below $110,000 Wait for breakout + retest
🧠 MMC Observations
Price Engineering: The market moved through clean zones quickly—classic MMC manipulation to clear liquidity.
Trap Zones: The resistance zone may act as a bull trap where late retail buyers are absorbed.
Smart Money Flow: Institutional traders may now shift to distribution mode unless curve support holds firmly.
💬 Final Thoughts
Bitcoin is at a key decision point. Traders should remain flexible but vigilant. The presence of curve support combined with aggressive upward momentum suggests bullish strength, but the resistance zone and prior liquidity behavior warn of potential trap activity.
Monitor the reaction closely in the next 1–2 candles. A failed breakout could trigger a swift 2–3K retracement.
📌 Tip: Combine this analysis with on-chain volume or open interest data for better conviction.

BTC analysisBitcoin has once again tested the resistance area and was rejected from it. That was likely the weekend pump, and let's see if BTC can continue its upward movement today. We may witness some volatility in the market when the US market opens.

Bullish momentum to extend?The Bitcoin (BTC/USD) is falling towards pivot and could bounce to the 1st resistance.
Pivot: 108,446.67
1st Support: 106,491.59
1st Resistance: 111.566.95
Risk Warning:
Trading Forex and CFDs carries a high level of risk to your capital and you should only trade with money you can afford to lose. Trading Forex and CFDs may not be suitable for all investors, so please ensure that you fully understand the risks involved and seek independent advice if necessary.
Disclaimer:
The above opinions given constitute general market commentary, and do not constitute the opinion or advice of IC Markets or any form of personal or investment advice.
Any opinions, news, research, analyses, prices, other information, or links to third-party sites contained on this website are provided on an "as-is" basis, are intended only to be informative, is not an advice nor a recommendation, nor research, or a record of our trading prices, or an offer of, or solicitation for a transaction in any financial instrument and thus should not be treated as such. The information provided does not involve any specific investment objectives, financial situation and needs of any specific person who may receive it. Please be aware, that past performance is not a reliable indicator of future performance and/or results. Past Performance or Forward-looking scenarios based upon the reasonable beliefs of the third-party provider are not a guarantee of future performance. Actual results may differ materially from those anticipated in forward-looking or past performance statements. IC Markets makes no representation or warranty and assumes no liability as to the accuracy or completeness of the information provided, nor any loss arising from any investment based on a recommendation, forecast or any information supplied by any third-party.

CHECK BTCUSD SIGNALS READ CAPTAIN BTCUSD buy limit zone
TRADE
Entry point 108.022
Take profit Target 111.614
Stop loss 107.546
Follow money Menagment

Bitcoin (H4): Sell Now - June 08📉Technical Analysis :
- Trend is down, price re-test resistance zone
- After a strong pullback, I recommend you can re-sell here
🔑Note: Manage your cappital.
☑️Follow me to learn and trade successfull !

BTC Bull Run Top and Bottom 2025-26BTC Bull Run Top and Bottom 2025-26.
When to sell and when to by based on historical trend line and Weekly RSI divergence in a bull run.
