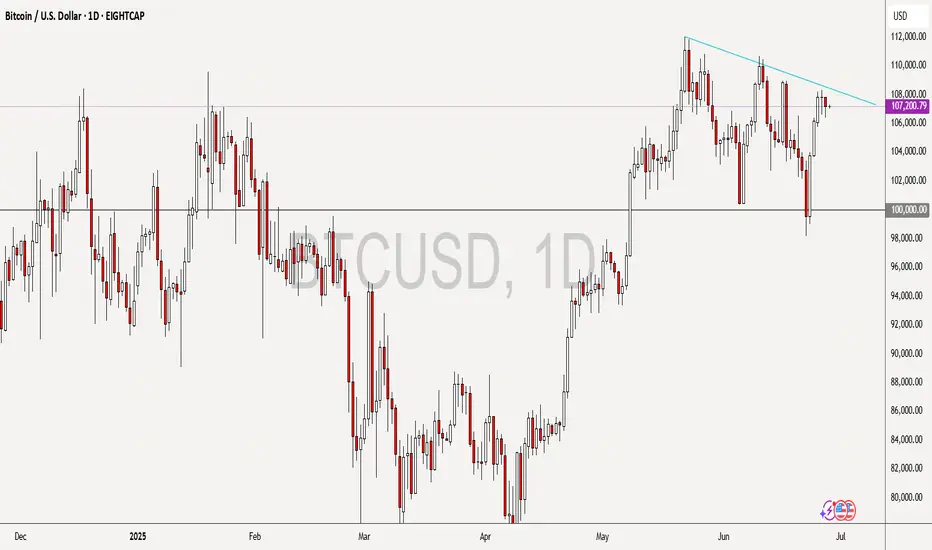
Bitcoin Looks StrongBitcoin continues to keep traders on their toes. After briefly sweeping the lows below \$100,000 earlier this week – an aggressive shakeout that likely liquidated overleveraged longs – it staged a sharp recovery. We’re now seeing price comfortably above the 50-day moving average, with back-to-back daily candles holding above the key \$105,787 level. That’s the type of reclaim bulls love to see.
What makes this move especially compelling is the volume profile. The bounce wasn’t some weak drift higher – it came on rising volume, suggesting real buyers stepped in to defend the lows. We’ve also seen consistent participation ever since – signaling that this might not just be a relief rally, but a potential shift in momentum.
Now the focus turns to resistance. The level to beat is \$112,000 – a zone that’s capped every major push this month. Break above that, and we’re no longer talking about recovering ground – we’re talking about new highs and possibly kicking off a much larger move. But before we get ahead of ourselves, this current consolidation near \$107K is healthy. If price can hang here for a bit, absorb selling pressure, and build a base – that’s often how the best breakouts form.
Of course, bulls don’t want to see \$105,787 lost again. That would make this whole move look like a failed breakout – and failed breakouts can get ugly fast. But for now, the technicals lean bullish. Bitcoin faked out the market, sucked in liquidity, and flipped key levels. Until proven otherwise, the bounce is valid – and the bulls have the momentum.
BITCOIN trade ideas

Bitcoin Is Looking For A Bullish ContinuationMorning all! Bitcoin has impulsive characteristics on 4h time frame, and we can clearly see five waves up that can send the price even higher after recent projected ABC correction. With the current impulsive recovery back above 106k area, it confirms that bulls are still here and we should be aware of further rally in July, especially if breaks above channel resistance line near 110k area. Seems like it's in wave (1) of a new five-wave bullish impulse, so after current wave (2) pullback, we can expect more gains within wave (3).

BITCOIN DUMP TO $87,000?!According to my ‘Elliott Wave Theory’ strategy, BTC has now competed its 5 Wave Impulse run OR is very close to completion!
Is it time for price to start correcting and dump down towards $87,000?
Let me know in the comments what you think.

Bitcoin’s not done dropping. Selling pressure’s still on!Welcome aboard ✌️
In order for Bitcoin to climb higher, we first need a deeper correction.
Right now, price is stuck inside a channel — and it’ll take stronger momentum to break out.
🔻 So for now, I’m expecting further downside. Stick with me and don’t miss this bearish wave!
BINANCE:BTCUSD OANDA:BTCUSD

Wait for your EDGE...
Discipline is what separates professionals from amateurs.
Stay patient. Wait for your edge. Let the probabilities work in your favor.
👉 “Agree with this? Hit Boost to spread the message.”
#TradingPsychology #Discipline #BTC #Bitcoin #Forex
#TradingMindset #AlBrooks #TradingDiscipline #PriceAction #ForexTrading #CryptoTrading #StockMarket #MJTrading #TradingQuotes #TraderLife #MindOverMarkets

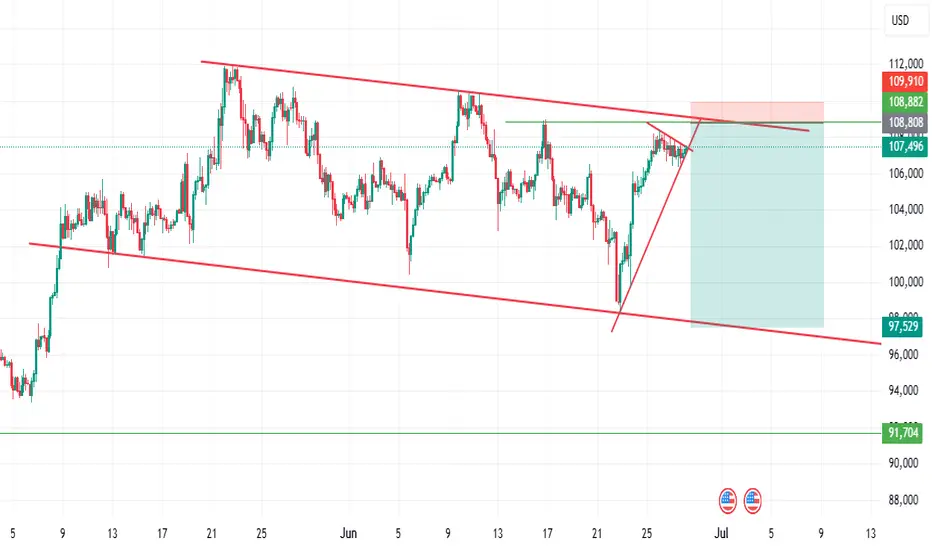
BTC/USD – Critical Reversal or Breakout?Bitcoin is currently trading around $107,500, pressing against the upper boundary of a rising wedge on the 1H and 4H charts. The structure remains fragile, with weakening momentum and conflicting signals between short and mid-term indicators.
📌 Scenario 1 – Bearish:
The current move likely completes wave (b) of an ABC correction.
Price has reached ~0.735 retracement at $108,358.
Breakdown of wedge support (~$104,600) could activate wave (c) toward $101K–$98K, or even the 1.618 extension to $86,000 (seen on daily).
📈 Scenario 2 – Bullish Alternate:
If BTC breaks and closes above $108,500, with volume, we may have invalidation of wave (b).
This opens the door for a wave (5) extension toward $113,000.
🔍 Key Indicators:
RSI on 1H is weakening, under 50.
OBV is flat – no accumulation spike.
QQE shows Buy signals but lacks follow-through.
Volume remains unconvincing for continuation.
🎯 Conclusion:
BTC is at a make-or-break level. A clean breakout and retest above $108.5K flips the structure bullish. Until then, wedge breakdown is the higher-probability play. Watch the $104.6K zone closely for direction confirmation.

BTCUSD is on a downtrendFrom the chart and from the technical analysis, we will see that btcusd is about to fall to 99000 or below. So, its time we enjoy btc as trader.
Reasons;
1] In 4 hr, we can see a third trendline is about to touch which is signal for sell.
2] Also, at the same point you can still see a horizontal resistance line, which is a signal for sell.
3] If the trendline below is broken, its also a signal to sell.
Always wait for a confirmation and trade responsibly. Thanks and don't forget to follow me for more good analysis.
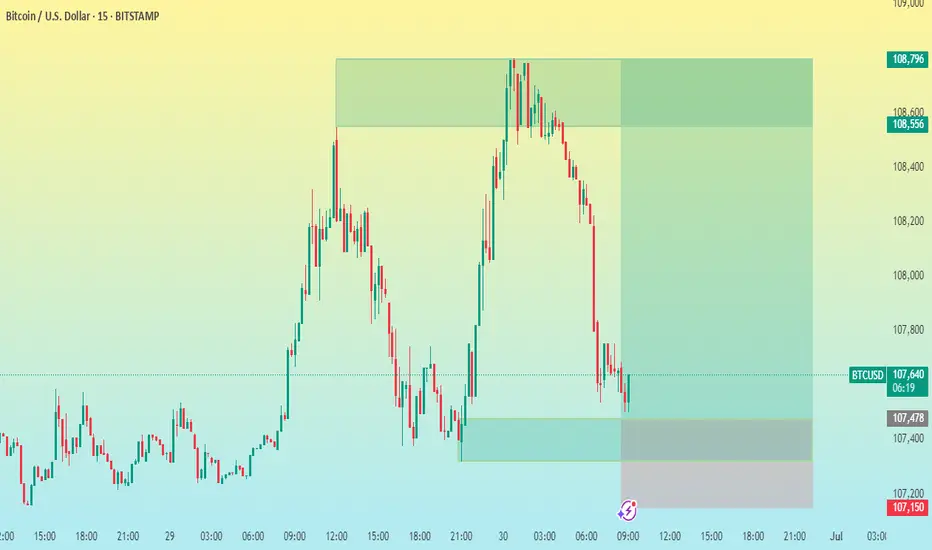
BTC/USD 15M CHART PATTERNHere's a summary of your BTCUSD 15-minute trade setup:
---
Trade Type: Buy
Entry Price: 107,500
Take Profit Levels:
1. TP1: 108,000
2. TP2: 108,300
3. TP3: 108,796
Stop Loss: 107,150
---
Risk-Reward Analysis:
Risk (SL): 107,500 - 107,150 = 350 points
Reward:
TP1: 500 points → ~1.43 R/R
TP2: 800 points → ~2.29 R/R
TP3: 1,296 points → ~3.70 R/R
---
Would you like me to turn this into a trading journal entry, script (e.g., for TradingView/MetaTrader), or analyze the probability based on recent price action?
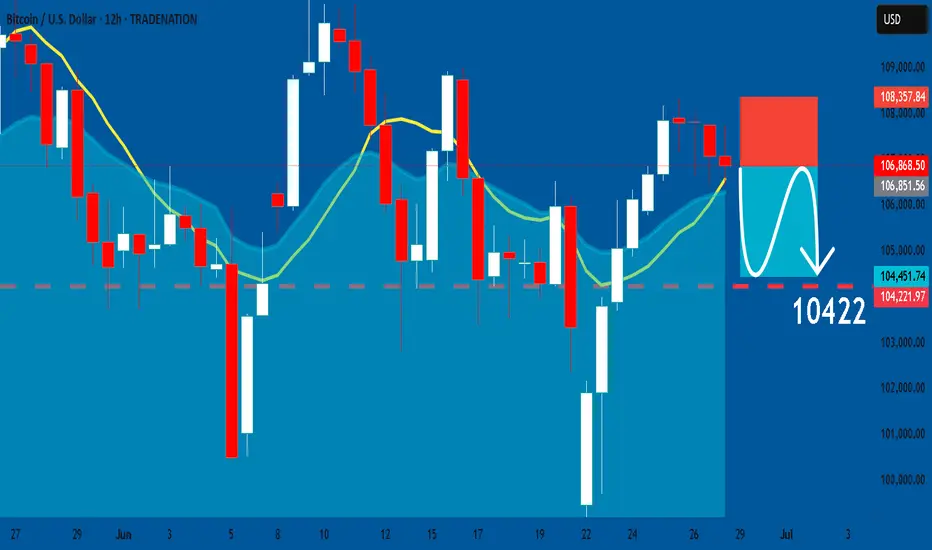
BTCUSD: Bearish Continuation & Short Signal
BTCUSD
- Classic bearish pattern
- Our team expects retracement
SUGGESTED TRADE:
Swing Trade
Sell BTCUSD
Entry - 10686
Stop - 10837
Take - 10422
Our Risk - 1%
Start protection of your profits from lower levels
Disclosure: I am part of Trade Nation's Influencer program and receive a monthly fee for using their TradingView charts in my analysis.
❤️ Please, support our work with like & comment! ❤️
BTC USDT 150,000$ TARGET . BULLISH FLAG AND POLE
Perfect bullish flag and pole pattern on the daily chart for BTC.
A successful breakout from the current channel will pump the price to the range of 145-150k $.

1 Year of Bitcoin Bull Run Remaining? In the chart above, we’re analyzing Bitcoin’s historical cycles to see if the current cycle follows a similar pattern.
Bear Run (1 Year): In each of the last three cycles, Bitcoin experienced a bear market lasting exactly 1 year from the all-time high (ATH). This phase saw a significant drop in price as the market corrected.
Bull Run from Bottom (1,064 Days): In the last two cycles, once the bottom was established, Bitcoin entered a consistent bull market that lasted approximately 1,064 days. During this period, the price gradually climbed, eventually reaching new highs.
Current Bitcoin Cycle:
So far, the current cycle appears to be following the same pattern as previous cycles. We’ve already experienced a 1-year bear market after reaching the previous all-time high (ATH).
Currently, we have completed 2 years of a bull run from the bottom, aligning with the 1,064-day bull run observed in past cycles. Based on this historical pattern, we may have 1 year of bull run remaining, which could potentially push Bitcoin to new highs by late 2025.
If this trend continues, it suggests a strong opportunity for growth over the next year, mirroring the end phase of past cycles.
BINANCE:BTCUSDT BITSTAMP:BTCUSD CRYPTOCAP:BTC
Regards
Hexa

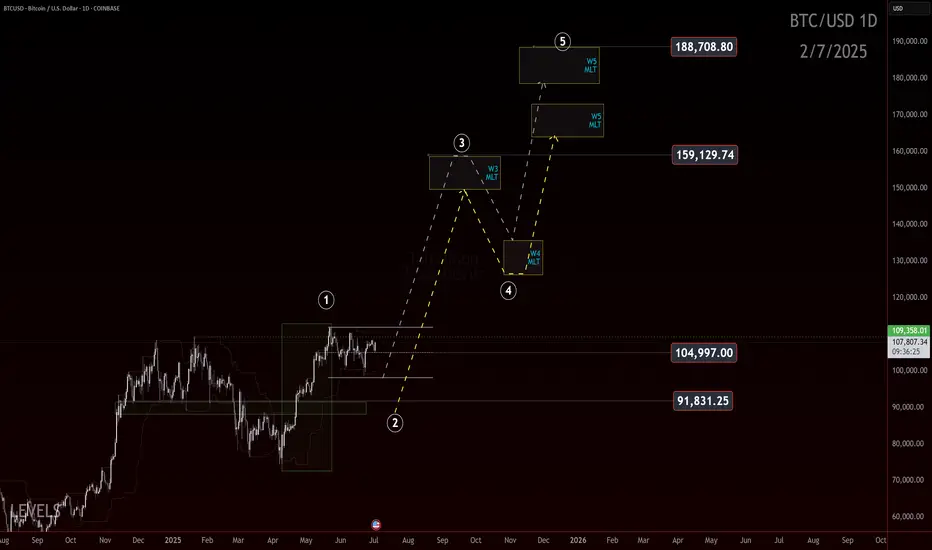
Bitcoin: 170k–180k?If you find this information inspiring/helpful, please consider a boost and follow! Any questions or comments, please leave a comment!
Bitcoin: 170k to 180k?
Let’s talk bias.
We’ve seen a powerful move off the 75k low, and it’s hitting some markers of a potential wave 1 impulse. If that structure holds and price doesn’t come back to wipe out the lows in a wave 2 retracement, then this is what we’d be looking at.
The idea? This is a conservative roadmap built off Elliott Wave Fibonacci projections and it targets the 170k to 180k zone.
Now, let’s be clear. This is a conservative projection. We’re not talking hopium fueled 250k moon targets here. We have no proof of that yet. We're anchoring the wave count and saying: if this is a 1, we’re due a 2, and then a 3 takes us to the upper levels.
But there’s a catch. Always is.
If price starts to fade back through the 91.8k area in a deep aggressive retrace, this roadmap gets less likely. Breaking the 75k pivot means the impulse structure failed or was misread, and we shift the count.
Until then, the 170k–180k level is a possible destination based on this roadmap.
Trade Safe!
Trade Clarity!
BTCUSD Bullish sideways consolidation supported at 101.780Trend Overview:
BTCUSD remains in a bullish trend, characterised by higher highs and higher lows. The recent intraday price action is forming a continuation consolidation pattern, suggesting a potential pause before a renewed move higher.
Key Technical Levels:
Support: 101,780 (primary pivot), followed by 100,380 and 98,184
Resistance: 109,170 (initial), then 111,600 and 114.140
Technical Outlook:
A pullback to the 101,780 level, which aligns with the previous consolidation zone, could act as a platform for renewed buying interest. A confirmed bounce from this support may trigger a continuation toward the next resistance levels at 109,170, 111,600, and ultimately 114,140.
Conversely, a daily close below 101,780 would suggest weakening bullish momentum. This scenario would shift the bias to bearish in the short term, potentially targeting 100.390 and 98,180 as downside levels.
Conclusion:
BTCUSD maintains a bullish structure while trading above the 101,780 support. A bounce from this level would validate the consolidation as a continuation pattern, with upside potential toward the 109,170 area. A breakdown below 101,780, however, would invalidate this view and suggest deeper corrective risk.
This communication is for informational purposes only and should not be viewed as any form of recommendation as to a particular course of action or as investment advice. It is not intended as an offer or solicitation for the purchase or sale of any financial instrument or as an official confirmation of any transaction. Opinions, estimates and assumptions expressed herein are made as of the date of this communication and are subject to change without notice. This communication has been prepared based upon information, including market prices, data and other information, believed to be reliable; however, Trade Nation does not warrant its completeness or accuracy. All market prices and market data contained in or attached to this communication are indicative and subject to change without notice.

Bitcoin Love and Peace! Let's go🚀📈 Bitcoin Rally Gains Steam with Strong Support in Place 💪🧠
Hello Traders,
After a period of geopolitical tension and heavy volatility, the charts are finally giving us a breath of calm. 🕊️ BTC/USD on the 15-minute chart has formed a solid base of support between 106,153 and 105,962. This area has now held up well and is acting as a launchpad for potential upside continuation.
🔍 Technically speaking, we’re observing:
Price holding above the 0.5 Fib retracement
A short-term breakout structure forming higher highs
Key interim resistance at 109,801
Long-term resistance to watch at 113,800 and the crucial macro test at 114,598
With Bitcoin dominance sitting at 65%, it's clear: this is Bitcoin’s moment. Altcoins are lagging, and BTC is leading the charge.
⚖️ The broader narrative is also shifting. The Fed's dovish tone adds to market stability, and in times of peace, Bitcoin thrives. But the key level to monitor remains 109K. A breakout above that sets us up for a major move.
Let's keep an eye on this structure. A failure to hold the 105K zone would shift the outlook, but for now, all systems are GO 🚦.
🕊️ Remember, in both trading and life—hate divides, love unites. Choose to be part of the solution.
One Love,
The FXPROFESSOR 💙
Disclosure: I am happy to be part of the Trade Nation's Influencer program and receive a monthly fee for using their TradingView charts in my analysis. Awesome broker, where the trader really comes first! 🌟🤝📈

BITCOIN Trump and the 1D EMA100 saved the day!Bitcoin (BTCUSD) rebounded yesterday on its 1D EMA100 (green trend-line) and along with Trump's truce announcement between Israel and Iran, it sent the market into a buying frenzy and back above the $105k mark.
Technically, the 1D EMA100 isn't something to be ignored as since the November 2022 market bottom, each Bullish Leg (Channel Up) that started had a contact (or near) with it that resulted into a considerable bullish extension.
The 1st Channel Up even breached below it, but after rebounding, it reached the 1.382 Fibonacci extension before the next correction. The 2nd Channel Up rebounded exactly on the 1D EMA100, and reached the 1.618 Fibonacci extension. The 3rd Channel Up almost hit the 1D EMA100 and then rebounded to the 2.0 Fibonacci extension.
It is obvious that the pattern follows a progression and each Fib extension peak is higher than on the previous Channel Up. As a result, it is not unlikely to see a High even above the 2.0 Fib ext ($168k) on the current (4th) Channel Up, however on the short-term we would still welcome the 1.382 Fib 'minimum' expectation, targeting $130000.
Do you think we should at least be expecting that? Feel free to let us know in the comments section below!
-------------------------------------------------------------------------------
** Please LIKE 👍, FOLLOW ✅, SHARE 🙌 and COMMENT ✍ if you enjoy this idea! Also share your ideas and charts in the comments section below! This is best way to keep it relevant, support us, keep the content here free and allow the idea to reach as many people as possible. **
-------------------------------------------------------------------------------
💸💸💸💸💸💸
👇 👇 👇 👇 👇 👇

BTC Shorts Into Q3 | Monthly + Half-Year Candle PressureWe’re entering a pivotal window on the Bitcoin chart, the monthly close, Q2 close, and 6-month candle all lining up. This kind of macro convergence rarely goes unnoticed by the market and often marks major structural shifts.
BTC has failed multiple times to break through key highs, and with momentum fading into this close, I’m leaning short heading into Q3. Even if price wants to trend higher later this year, I expect that move to begin from a deeper wick, not from the top of the current range.
I’m watching the 103K level closely. A break below it could trigger a swift drop toward 95K, possibly lower depending on how the new monthly opens and reacts. That would line up with the idea of a strong lower wick forming on the new 3M or 6M candle.
This isn't a long-term macro short, just a high R setup where structure, timing, and context are aligning. I believe this move starts today or very soon. The next few candles will speak volumes.


EMA SystemThe system of Moving Averages I started out using is the 9-21-50 SMA. I would use the Fast EMA as a trailing stop loss and only trade long when it's above the 50 SMA. The 21 SMA is often a zone where price can bounce back.
12-21 EMA—EMA of EMA can work as well. So can 50-200 SMA or EMA of EMA for telling the larger trend if you want to enter an Option, then trading against it can be fatal.

BTCUSD Analysis Today: Technical and On-Chain !In this video, I will share my BTCUSD analysis by providing my complete technical and on-chain insights, so you can watch it to improve your crypto trading skillset. The video is structured in 4 parts, first I will be performing my complete technical analysis, then I will be moving to the on-chain data analysis, then I will be moving to the liquidation maps analysis and lastly, I will be putting together these 3 different types of analysis.

Inverse head and shouldersInverse head and shoulders to break up, retest ath, retracement to neckline, then on to new ath

BTCUSD: Bulls Are Winning! Long!
My dear friends,
Today we will analyse BTCUSD together☺️
The price is near a wide key level
and the pair is approaching a significant decision level of 107,630.73 Therefore, a strong bullish reaction here could determine the next move up.We will watch for a confirmation candle, and then target the next key level of 108,207.06.Recommend Stop-loss is beyond the current level.
❤️Sending you lots of Love and Hugs❤️

Bitcoin long $600k- long Bitcoin targeting $10-12T market cap by 2028
- acceleration of companies accumulating Bitcoin + continuation of Saylor & Strategy's ongoing TWAP
- notable uptick in global concerns w/ having access to non-sovereign store of wealth not affected by government intervention + over-reliance on USD + US Debt
- Gold's current market cap: $23T. Bitcoin is incredibly more useful as a SOV that's transferable easily across nation states & easier to transact with between parties anywhere globally
- currently holding $100k support after selling off to ~$75k during tariff fears + austerity with DOGE + macro higher low from last year and held support from November election
- including improved crypto regulatory environment otw soon + general sentiment around crypto a lot more positive

Unusual situation - Will you short BTCUSD?Going short is not the first thought when talking about BTCUSD, yet the 3 recent lower highs together with an "evening star" pattern are saying exactly that.
Will you take this offer?
What do you think?
Comment below, share your thoughts and analysis!!