Bitcoin Faces Impending Drop to Mid-30,000sAs of July 02, 2025, Bitcoin’s price chart, crafted by "RoadToAMillionClub" on TradingView, paints a concerning picture. Currently hovering at $107,831, the cryptocurrency appears to be teetering at the edge of its upper channel, signaling potential trouble ahead. The recent 0.51% dip may be just the beginning of a more significant decline.
The long-term upward trend, marked by a supportive orange line since 2018, has been a beacon for bulls. However, the green trend line projecting a drop toward the mid-30,000s range, around $37,932, suggests a looming correction. This level, a historical support zone, could become the next battleground as selling pressure mounts.
Market indicators point to overextension, with the price hitting a 4-day and 14-day high of $107,831 before the recent pullback. The speculative fervor that drove Bitcoin to these heights seems to be waning, increasing the likelihood of a bearish turn. Investors should brace for volatility, as the cryptocurrency may struggle to maintain its current altitude, potentially sliding toward the mid-30,000s in the coming months.
BITCOIN trade ideas

July 1 Bitcoin Bybit chart analysis
Hello
This is Bitcoin Guide.
If you "follow"
You can receive real-time movement paths and comment notifications on major sections.
If my analysis was helpful,
Please click the booster button at the bottom.
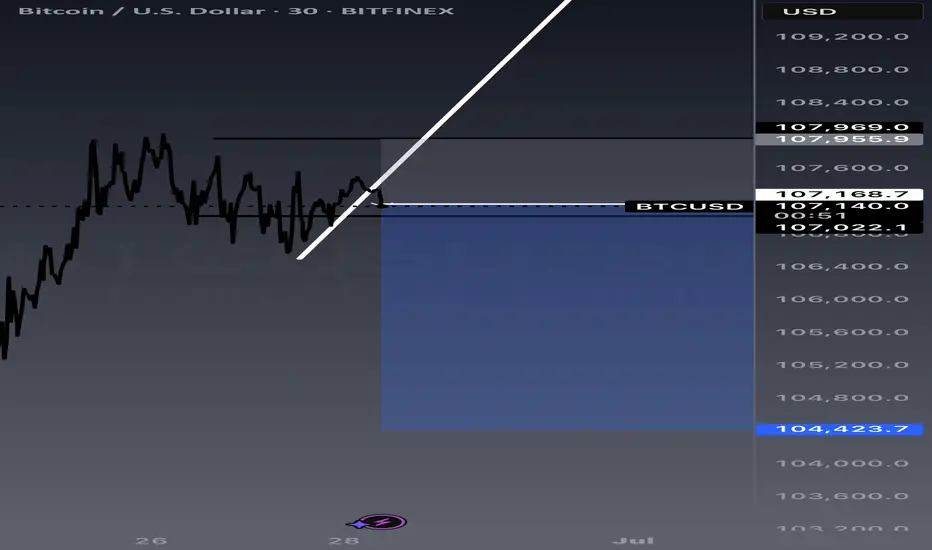
Here is the Bitcoin 30-minute chart.
Shortly later at 10:30 PM and 11:00 PM, there will be a NASDAQ index announcement.
On the left, with a purple finger,
I connected the long position entry point of $106,775.9, which I entered yesterday, to today's strategy.
Since the rebound was not strong yesterday,
the 12-hour chart -> daily chart MACD dead cross is currently under pressure.
Depending on the situation, it can drop strongly to the 3rd section at the bottom,
and since there may be some people who are maintaining long positions yesterday,
I will explain in detail the operating method such as the loss cut price,
so please check it carefully.
*When the blue finger moves,
Bidirectional neutral
Short->Long switching strategy
1. 107,300.3 dollars short position entry section / stop loss price when orange resistance line is broken
2. 106,222.2 dollars long position switching / stop loss price when section 2 is touched
3. Top section long position 1st target -> Good 2nd target
It is important until 9 o'clock when the 12-hour candle is created.
After 9 o'clock, the blue finger 106,222.2 dollars at the bottom
Becomes the main support line
If it comes down from the current position, section 2
The main support line is divided.
In terms of the pattern, it is section 6+12.
If section 2 is touched right away,
There is a high possibility of a strong drop today,
So you should be careful.
- Those who are maintaining a long position
If you touch the 2nd section before 9 PM without touching the short position entry point at the top
You should operate at a loss cut price.
I think it would be good to adjust it according to leverage.
If it falls after touching the 1st section at the top
It becomes a vertical decline condition.
From the bottom, from the 3rd
Maximum Bollinger Band daily chart support line section
Please note that it can be pushed up to 100,685.5 dollars.
I have never changed my perspective suddenly or irresponsibly after leaving an analysis article.
I did my best until the end today.
Please use my analysis article so far only for reference and use
I hope you operate safely with principle trading and loss cut prices.
Thank you.

Bitcoin ConsolidatesBitcoin is currently consolidating just below a clear descending trendline, showing a series of lower highs since its recent local top near $112,000. Price is hovering around $106,300, holding just above key horizontal support at ~$105,800. This level coincides with the 50-day moving average (blue), which is currently acting as dynamic support.
So far, Bitcoin has respected the ~$100,700 level as major support after the mid-June shakeout. As long as price remains above that zone and holds the 50 MA, the bullish structure remains intact despite the short-term lower highs. But the more price compresses beneath the descending resistance, the more likely we see a breakout (or breakdown) soon.
The 200-day moving average (red) is well below current price action, hovering near $95,000. That’s a long way down and would likely only be tested if broader market conditions deteriorate significantly.
Volume is tapering, suggesting traders are waiting for a decisive move. A break above the descending trendline and reclaim of $110,000+ would invalidate the current short-term downtrend and likely bring $112,000 and new highs into view. A loss of $105,800, on the other hand, puts $100,700 back in play – and below that, things could get ugly quickly.
For now, the trend is neutral within a broader uptrend. The bulls are holding the line – but just barely

BTCUSD parallel channel On the daily chart, BTCUDS is running in the parallel channel. The short-term market fell back after testing the upper resistance. At present, we can pay attention to the short-selling trading opportunities, and the downside target is around 98000. If the price breaks through the resistance near 108800, it will break the channel.

Multiple confirmations on BTC sellsWe see BTC losing momentum on 4hr time frame. HL was just broken creating a LL, then we see price forming multiple bearish candles at poi. CTL is broken confirming this idea for potential entry!
BTCUSD printing a bullish flag BTCUSD printing a bullish flag expected to make a all time high, entry with a buy stop above the last HH, RR .75: .75

BTCUSD Analysis Today: Technical and On-Chain !In this video, I will share my BTCUSD analysis by providing my complete technical and on-chain insights, so you can watch it to improve your crypto trading skillset. The video is structured in 4 parts, first I will be performing my complete technical analysis, then I will be moving to the on-chain data analysis, then I will be moving to the liquidation maps analysis and lastly, I will be putting together these 3 different types of analysis.

BTC/USD Short Setup – Breakdown from Bear Flag Edge🚀||| 👆Your Boost is appreciated in Advance👆 |||🚀
Thesis: Bitcoin is trading within a well-defined descending channel, potentially forming a bear flag on the higher time frame. Price is currently hovering just below the key resistance zone near $108,600 (“The Edge”), failing to reclaim the upper boundary of the flag.
==================================================================
Entry: 🔻 Short at $106,850 – Price is rejecting the upper channel resistance and failing to break above “The Edge”
Stop-Loss: 🔺 $109,000 – Above the recent swing high and invalidation of the flag structure
Take-Profit 1: ✅ $104,700 🎯
Take-Profit 2: ✅ $102,400 🎯
Optional extended:
TP4: $98,000 – Full measured move of the flag breakdown
Risk-Reward Ratio: ~1:1 to 1:4 depending on target
====================================================================
#MJTrading
#BTCUSD #Bitcoin #CryptoTrading #ShortSetup #BearFlag #TechnicalAnalysis #PriceAction #MarketStructure #SwingTrade #TradingView

BTCUSD Bullish continuation pattern support at 101,780Trend Overview:
BTCUSD remains in a bullish trend, characterised by higher highs and higher lows. The recent intraday price action is forming a continuation consolidation pattern, suggesting a potential pause before a renewed move higher.
Key Technical Levels:
Support: 101,780 (primary pivot), followed by 100,380 and 98,184
Resistance: 109,170 (initial), then 111,600 and 114.140
Technical Outlook:
A pullback to the 101,780 level, which aligns with the previous consolidation zone, could act as a platform for renewed buying interest. A confirmed bounce from this support may trigger a continuation toward the next resistance levels at 109,170, 111,600, and ultimately 114,140.
Conversely, a daily close below 101,780 would suggest weakening bullish momentum. This scenario would shift the bias to bearish in the short term, potentially targeting 100.390 and 98,180 as downside levels.
Conclusion:
BTCUSD maintains a bullish structure while trading above the 101,780 support. A bounce from this level would validate the consolidation as a continuation pattern, with upside potential toward the 109,170 area. A breakdown below 101,780, however, would invalidate this view and suggest deeper corrective risk.
This communication is for informational purposes only and should not be viewed as any form of recommendation as to a particular course of action or as investment advice. It is not intended as an offer or solicitation for the purchase or sale of any financial instrument or as an official confirmation of any transaction. Opinions, estimates and assumptions expressed herein are made as of the date of this communication and are subject to change without notice. This communication has been prepared based upon information, including market prices, data and other information, believed to be reliable; however, Trade Nation does not warrant its completeness or accuracy. All market prices and market data contained in or attached to this communication are indicative and subject to change without notice.

BTCUSD – Major Decision Point at The Edge📍 By: MJTrading |||
Bitcoin has rallied sharply from ~$98K and is now testing a critical confluence zone — the top of the descending channel and a strong supply area, known as "The Edge."
EMAs are turning up, supporting bullish momentum
⏳ What’s Next?
At this stage, two scenarios emerge:
⚠️ This is a make-or-break zone:
🟩 Breakout above the channel signals trend reversal → next resistance: $111K
🟨 Rejection leads to a move back to the $103K or $100K levels
This setup offers a high-RR opportunity for both breakout traders and mean reversion players.
🧠 Trade the reaction at the edge, not the prediction.
Thanks for your attention...
Share your thoughts...
—
#BTCUSD #Bitcoin #CryptoTrading #TheEdge #BreakoutOrBounce #CryptoSetup #DescendingChannel #SmartMoney #TechnicalAnalysis #PriceAction #SwingTrade #EMA #RiskReward #MJTrading #4hChart #TrendDecision #SupplyZone

BRIEFING Week #25 : Heading into Summer ModeHere's your weekly update ! Brought to you each weekend with years of track-record history..
Don't forget to hit the like/follow button if you feel like this post deserves it ;)
That's the best way to support me and help pushing this content to other users.
Kindly,
Phil

How about another RR2 Short?Lets try for a RR2 Sell..
Entry: 107100
SL: 108500
TP1: 106000
TP2:104800
See below for Reason and Full Analysis:

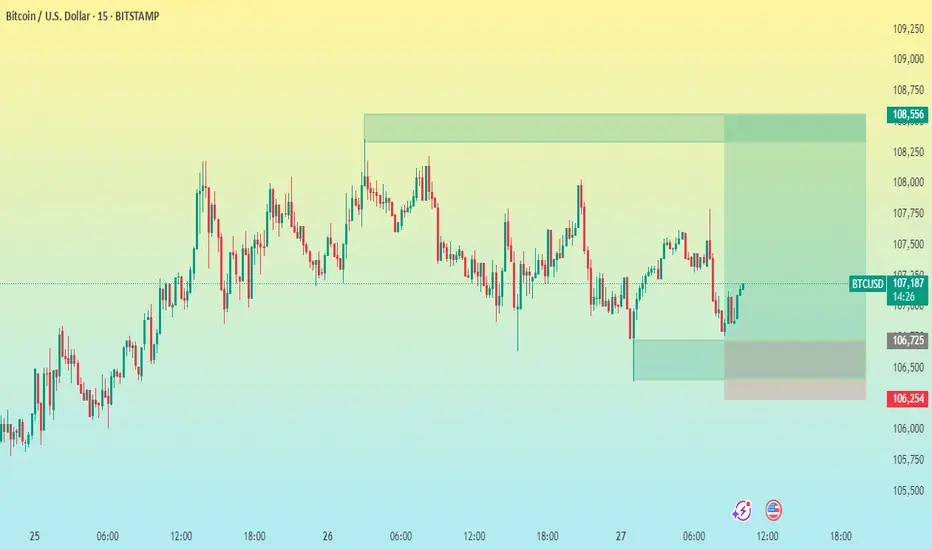
BTC/USD 15 M CHART PATTERN 🕵♂ Chart Context
Asset: Bitcoin (BTC) vs. USD
Exchange: Bitstamp
Timeframe: 15-minute
Date Range: June 25–27, 2025
Chart Type: Candlestick
---
📊 Technical Analysis
1. Trend
Short-term trend: Sideways to slightly bullish.
Market saw an earlier uptrend, then consolidation with lower highs and higher lows (forming a range).
Price is currently rebounding from the lower part of the range.
2. Key Levels
Entry Level: ~107,123 – likely where a long trade was entered.
Support Zone:
Minor: 106,725
Strong: 106,254 (stop-loss level, clear structure support)
Resistance Zone / Target: 108,556 – a prior high and possible supply zone.
3. Risk-Reward Ratio
Entry: 107,123
SL: 106,254 (−869 points)
TP: 108,556 (+1,433 points)
RR Ratio: ≈ 1.65:1 – acceptable for intraday trading.
BTC/USD BULLISH 30 MINUTES ANALYSISmarket may be going to buy side . i feel the market will rise further ,and i am quite confident it can go significantly higher and hit its target .

Bitcoin is gearing up for 120K and 140K (1D)The flip zone has been reclaimed, but no proper pullback had occurred. The recent pullback came with a sweep of the all-time high (ATH), which has caused confusion and uncertainty among market participants.
In fact, this drop can be interpreted as a pullback to the flip zone, accompanied by an ATH hunt.
We expect the price, after touching the green zone and forming a base around this level, to move toward the targets of 120K and 140K — which we currently consider as Bitcoin’s final targets for this cycle.
A weekly candle close below the invalidation level would invalidate this analysis.
For risk management, please don't forget stop loss and capital management
When we reach the first target, save some profit and then change the stop to entry
Comment if you have any questions
Thank You

BTCUSD 4 hr. takes a deeper wave 4 dive!If wave 4 gets rejected from the wicks of wave 1...It's likely off to the races towards new highs on a wave 5 north!

BTC Breakout or dropBitcoin has been trading in a range from 97.5K-112K for some time we tested 97K weekend and we bounce over 10% but we fail to make a ATH, also Bitcoin has strong bearish divergences that hardly anyone pays key attention to and these are almost identical to 2021 cycle top.
I have draw the resistance line and support from 2021 my theory is that IF we invalidate the bearish divergences we can see price action between 145K + . I do not think we can see a 320K price per bitcoin this cycle this will maybe happen in 2028 or 2032 cycle. Now if we do not breakout and invalidate the bearish divergences we can see the price dropping back to test the major 2021 support which is around 78K-84K only when this support if broken and we close a full body weekly candle below it then this confirms bear market has started.
Price action has move almost 8X from the 2022 ATL which is a decent return if you bought and hold.
If you enjoy the TA feel free to join my network its absolutely FREE.

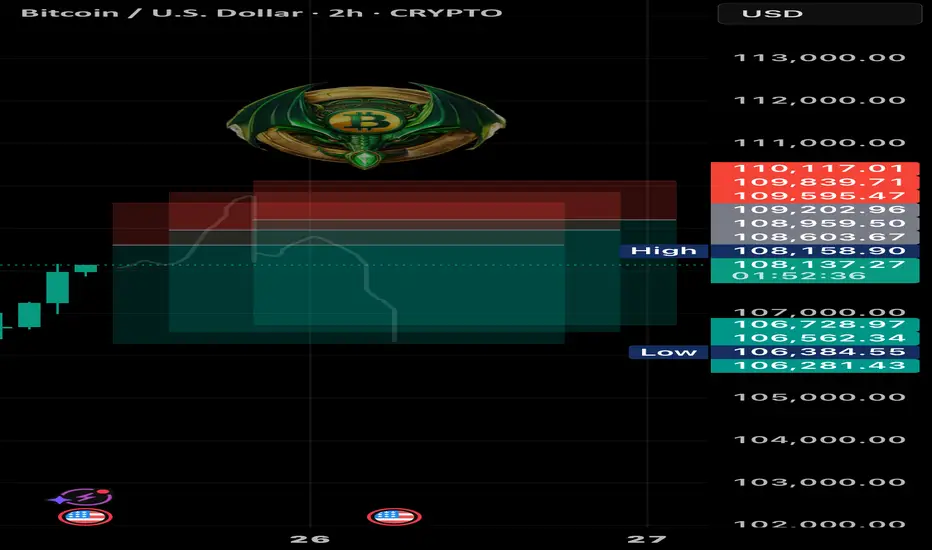
BTC SHORT TP: 106,300 25-06-2025Let’s be real — what’s coming looks like pure manipulation 😮💨
Setting a SHORT between 108,550 – 109,250, aiming for 106,200 – 106,550, with an average 3.3 RR.
🕑 Timeframe: 2H
⏳ Duration: 20–30 hours
Context: If you see a massive green candle… that’s not strength — that’s the short signal. Stops are pretty obvious in this kind of setup. Classic trap vibes loading.
If the move doesn’t happen within the estimated time, the setup is invalid.
We don’t use indicators, we’re not out here drawing lines or cute little shapes — I just give you a clean trade.
Bullish confirmation today on both the daily and 4hrly.Bullish confirmation today on both the daily and 4hrly.
4hrly Chart:
Caught the dip?

BTCUSD a potential "BUY" at the bottom of corrective wave2!1). Trade is going sideways on wave 2 looking for Buyers towards $110K+ 2).Banks are Buying liquidity!

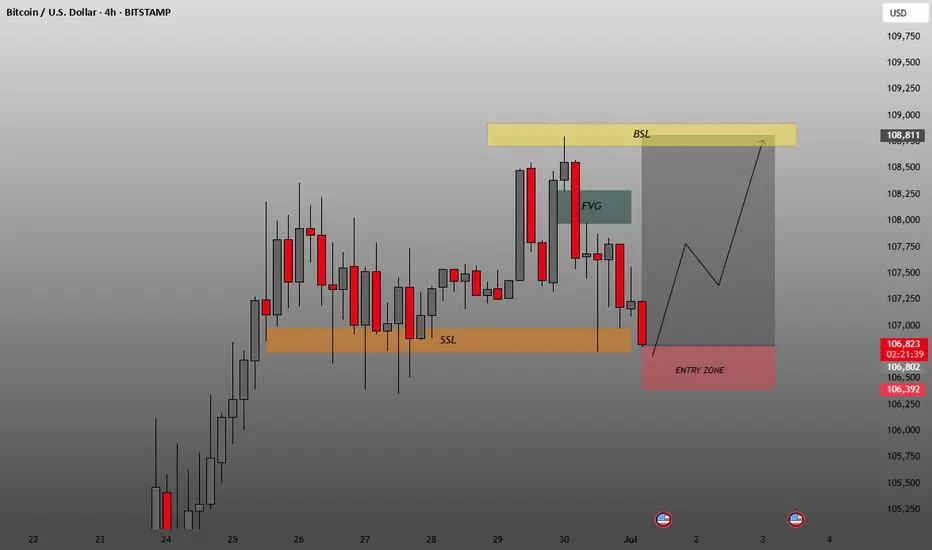
Often targeted before potential reversal or continuation moves.Key Zones & Annotations
BSL (Buy-Side Liquidity) – Yellow box at the top (~$108,811):
Represents liquidity above recent highs.
Often targeted before potential reversal or continuation moves.
SSL (Sell-Side Liquidity) – Orange box below current price:
Represents liquidity under recent lows.
The market just swept this area, possibly to trigger liquidity grabs or stop hunts.
FVG (Fair Value Gap) – Blue shaded box:
Indicates an imbalance area where price could return for mitigation.
Price might revisit this area before or during a bullish move.
Entry Zone – Red box around current price:
Marks a potential long entry area.
Positioned just after sweeping the SSL.
Projected Move (Gray Box):
Forecasted price trajectory is bullish, aiming for levels above $108,500+, targeting the BSL area.
🧠
Interpretation Based on Smart Money Concepts
Market swept sell-side liquidity (SSL), suggesting weak hands or stops were taken out.
Entry zone aligns with a potential order block or demand zone.
Anticipated move is bullish, likely targeting the imbalance and BSL.
✅
Trading Insight
This is a classic Smart Money reversal setup:
Liquidity sweep below.
Entry near demand zone.
Targeting inefficiencies and liquidity above.
BTCUSD H4 Potential DropHi there,
BTCUSD H4: As long as the 85,119.33 level holds, the overall trend remains bullish in a larger scope.
Currently, the price is trading below the diagonal dotted trendline. The further it stays below this trendline, the stronger the bears' position.
The level of 101,574.21 is open for a bias towards 93,511.35.
Happy Trading,
K.
Not trading advice.

Last chance to make profit from BTC with buying positionBullish flag
Strong resistance breakout
2 bull points
Position trade spot buying
Bitcoin completing timecycle on oct 2025 after that it would be 4th time if market again crash for around 70%
Manage your risk in both future and spot trading
Note: NO analysis would 100% profitable trading is the game of probability and risk management so follow your trading plan with proper risk reward and win rate.
