Bitcoin H1 | Potential bounce off an overlap supportBitcoin (BTC/USD) is falling towards an overlap support and could potentially bounce off this level to climb higher.
Buy entry is at 106,532.50 which is an overlap support that aligns closely with the 23.6% Fibonacci retracement.
Stop loss is at 104,600.00 which is a level that lies underneath a swing-low support and the 38.2% Fibonacci retracement.
Take profit is at 108,808.50 which is a swing-high resistance that aligns with the 127.2% Fibonacci extension.
High Risk Investment Warning
Trading Forex/CFDs on margin carries a high level of risk and may not be suitable for all investors. Leverage can work against you.
Stratos Markets Limited (tradu.com ):
CFDs are complex instruments and come with a high risk of losing money rapidly due to leverage. 63% of retail investor accounts lose money when trading CFDs with this provider. You should consider whether you understand how CFDs work and whether you can afford to take the high risk of losing your money.
Stratos Europe Ltd (tradu.com ):
CFDs are complex instruments and come with a high risk of losing money rapidly due to leverage. 63% of retail investor accounts lose money when trading CFDs with this provider. You should consider whether you understand how CFDs work and whether you can afford to take the high risk of losing your money.
Stratos Global LLC (tradu.com ):
Losses can exceed deposits.
Please be advised that the information presented on TradingView is provided to Tradu (‘Company’, ‘we’) by a third-party provider (‘TFA Global Pte Ltd’). Please be reminded that you are solely responsible for the trading decisions on your account. There is a very high degree of risk involved in trading. Any information and/or content is intended entirely for research, educational and informational purposes only and does not constitute investment or consultation advice or investment strategy. The information is not tailored to the investment needs of any specific person and therefore does not involve a consideration of any of the investment objectives, financial situation or needs of any viewer that may receive it. Kindly also note that past performance is not a reliable indicator of future results. Actual results may differ materially from those anticipated in forward-looking or past performance statements. We assume no liability as to the accuracy or completeness of any of the information and/or content provided herein and the Company cannot be held responsible for any omission, mistake nor for any loss or damage including without limitation to any loss of profit which may arise from reliance on any information supplied by TFA Global Pte Ltd.
The speaker(s) is neither an employee, agent nor representative of Tradu and is therefore acting independently. The opinions given are their own, constitute general market commentary, and do not constitute the opinion or advice of Tradu or any form of personal or investment advice. Tradu neither endorses nor guarantees offerings of third-party speakers, nor is Tradu responsible for the content, veracity or opinions of third-party speakers, presenters or participants.
BITCOIN trade ideas

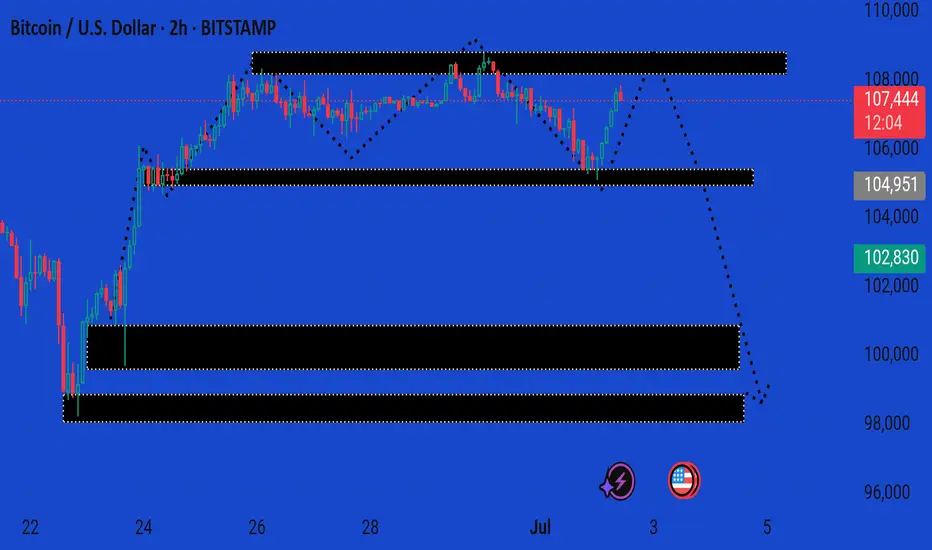
BTCUSD UPDATE MARKET This is a 2-hour BTC/USD (Bitcoin to US Dollar) chart showing a bearish projection after a consolidation phase. Here's a breakdown of the analysis:
---
🔍 Current Price:
107,549 USD
Up +1.74%, suggesting a recent bullish push — likely a short-term rally.
---
🧠 Technical Zones & Forecast:
1. Resistance Zone (~107,500–109,000):
This area has been tested multiple times.
The dotted arrow from this level suggests a projected reversal, possibly forming a lower high.
2. First Demand/Support Zone (~104,800–105,200):
Shallow support. If broken, it may confirm the start of a deeper correction.
3. Second Demand Zone (~101,500–102,800):
More robust support.
Could serve as a bounce zone or long-entry area.
4. Third Major Demand Zone (~97,500–99,000):
Strong long-term support; a bearish target if momentum increases.
---
🧭 Directional Bias:
The dotted line shows a bearish trajectory with targets at 104.9k, 102.8k, and potentially 99k.
The price action reflects a distribution range at the top, hinting at potential markdown phase starting soon.
---
✅ Conclusion:
Short-term bullish, but showing signs of weakness near resistance.
Watch for rejection around 108k–109k to confirm the bearish move.
Breakdown below 104.9k would accelerate downside toward 102.8k and 99k.
Let me know if you'd like entry/exit signals or stop-loss suggestions based on this outlook.

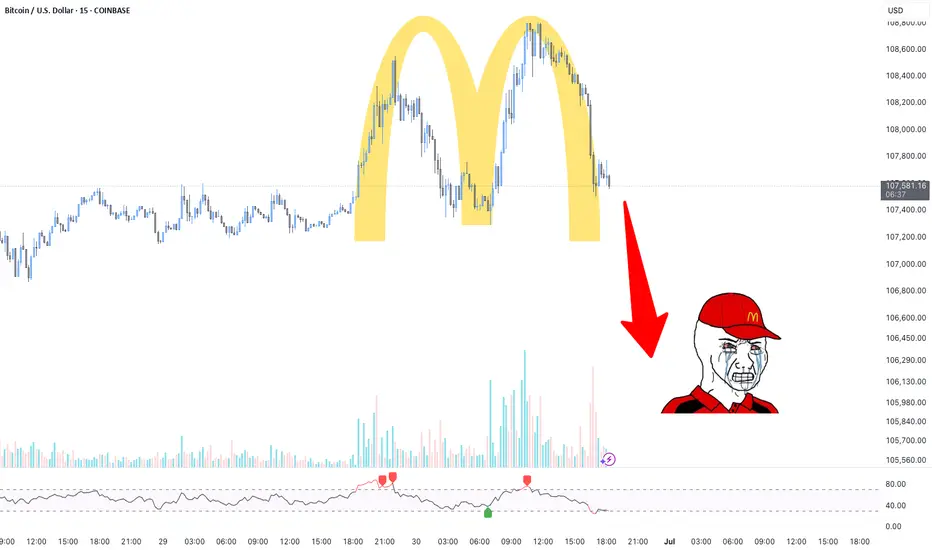
A run down to the sea of stop loss before it goes up again?We could see a potential correction as we are seeing a double top with a temporary loss of momentum to the upside according to the RSI and volume. It's a valid trade until Trump says otherwise.
BTCUSD TRADE SETUP 📈 **Bitcoin (BTC/USD) 1H Chart Analysis — June 28, 2025**
🔍 **Pattern Identified: Bullish Flag Breakout**
🧠 **1. Market Context**
* This is the **1-hour chart** of **BTC/USD** on Binance.
* Price recently formed a **bullish flag pattern**, which is a **continuation pattern** signaling a potential breakout in the **direction of the previous trend (upward)**.
🔧 **2. Technical Breakdown**
🔹 **Trend Before the Flag**
* Price had a strong **impulsive move up** from \~105,000 to \~107,800.
* That was followed by a **consolidation phase** forming a downward sloping **channel** (blue parallel lines), creating the **flag**.
🔹 **Flag Channel**
* Price oscillated inside this flag for nearly 2 days (June 26–28).
* The **channel** is clearly defined, and price **respected both upper and lower bounds** during the consolidation.
🚀 **3. Breakout Confirmation**
* Price has now **broken out of the upper boundary** of the flag.
* A clean **break and candle close** above the trendline suggests **bullish momentum** is returning.
* This breakout is occurring around the **107,400–107,800** zone, which is also a **key structure level** acting as local resistance.
---
🎯 **4. Trade Setup**
✅ **Entry:**
* Around **107,400–107,800**, post-confirmation of the breakout.
❌ **Stop-Loss (SL):**
* Placed just below the **flag support / demand zone**, around **106,800**.
* This protects against a fake breakout or pullback into the flag.
🎯 **Target (TP):**
* Projected at **110,000**, which is aligned with the height of the initial flagpole projected from the breakout point.
* This also represents a psychological round number and a previous resistance level.
---
📊 **Risk-Reward Ratio (RRR)**
* **RRR = \~3:1**
* For every \$1 risked, the potential reward is \$3 — **excellent reward structure**.
---
📌 **Key Insights for the Traders**
* This is a **classic bullish flag breakout** play—very reliable in trending markets.
* **Volume confirmation** (not shown in chart but should be checked live) is important — higher volume during breakout gives stronger conviction.
* Watch for a possible **retest of the breakout level** (around 107,800) before the next move up.

BTC/USD Potential Short Trade Setup - Detailed AnalysisThis chart indicates a potential short trade opportunity, where the price is approaching a key resistance zone. The current market scenario suggests a possible reversal or downward movement, especially if the price reacts to the sell zone ($107,495) and begins to decline.
Trade Parameters:
Sell Zone: $107,495
Stop Loss: $110,438 (Placed slightly above the resistance zone to account for any unexpected breakout)
Take Profit Targets:
1. Take Profit 1: $105,224 (Initial support level)
2. Take Profit 2: $102,465 (Second key support level for further downward movement)
3. Take Profit 3: $99,099 (Final target level)
Target Zone: $98,723 (A critical area for further downside potential)
Technical Analysis:
The price is currently in a strong resistance area where sellers have previously taken control.
A break below the sell zone could lead to a move towards the indicated targets.
RSI and other technical indicators suggest the market is approaching overbought conditions, increasing the likelihood of a downward move.
Risk and Reward Ratio:
This setup offers a balanced risk-reward ratio. Ensure the stop loss is strictly adhered to in order to protect against any unexpected movements.

#5572025 | BTCUSD Supply Zone 1:10BTCUSD Supply Zone Appears in D1 Time Frame Looking Price Action for Long Term Sell
Risk and Reward Ratio is 1:10
After 50 pips Profit Set SL Entry Level
"DISCLAIMER" Trading & investing business is "Very Profitable" as well as risky, so any trading or investment decision should be made after Consultation with Certified & Regulated Investment Advisors, by Carefully Considering your Financial Situation.


Break of the LIS is showing weakness to come BITSTAMP:BTCUSD broke the LIS at 106413. It’s likely to form a new bearish setup unless it recovers 108216. If you are long, get out until we see a bullish setup coming back.
June 30 Bitcoin Bybit chart analysisHello
This is Bitcoin Guide.
If you "follow"
You can receive real-time movement paths and comment notifications on major sections.
If my analysis was helpful,
Please click the booster button at the bottom.
This is the Bitcoin 30-minute chart.
There is no separate indicator announcement today.
The weekly and daily charts are being adjusted at the same time as they are created.
The strategy was carried out based on the Nasdaq pattern and the Tether dominance pattern.
The long position entry section on the 25th, $106,746, was connected as is.
*When the blue finger moves,
It is a two-way neutral
short->long switching or long waiting strategy.
1. $108,138.1 short position entry section / stop loss price when orange resistance line is broken
2. $107,507.9 long position switching / stop loss price when green support line is broken
3. $108,507.9 long position 1st target -> Good 2nd target price
You can also use the long position re-entry indicated in the middle.
If it comes down right away without touching the short entry section at the top,
it is a long waiting strategy at the gap section of 107,102.7 dollars,
and the stop loss price is the same.
And, if it succeeds in rebounding within the purple support line today,
the reason it is safe from a long position is
because the low point of the weekly and daily candles created this week is maintained without additional deviation.
Please note that the 1st section at the bottom is a sideways market / the 2nd section is open up to the bottom.
Please use my analysis article so far only for reference and use,
and I hope you operate safely with the principle trading and stop loss price.
Thank you.

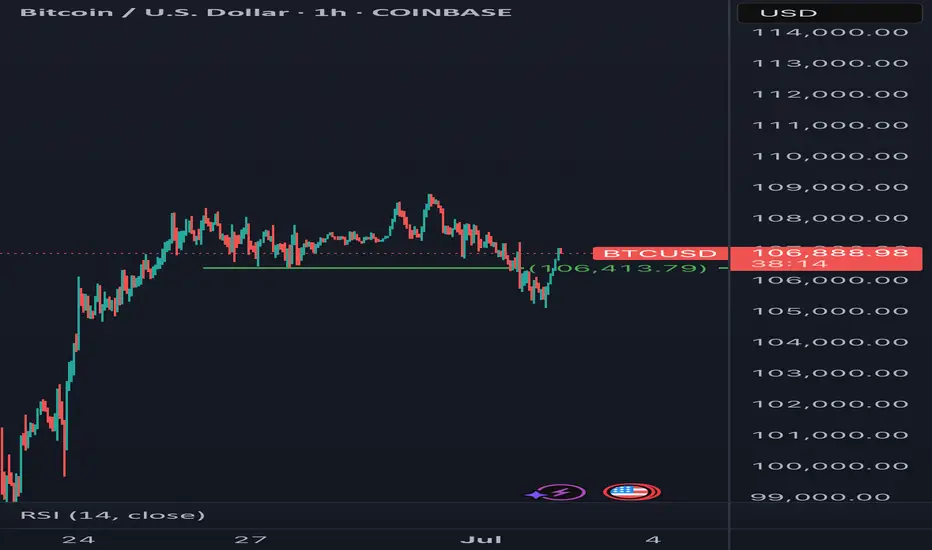
BTC CONTINUES TO PUSHBitcoin continues to press higher with quiet confidence. After reclaiming the $106,787 resistance level with a strong daily close last week, BTC has held the breakout and is now consolidating just above it – a textbook bullish retest. The 50-day moving average is rising beneath price, offering additional support as momentum builds. We’re seeing a small cluster of tight candles, hinting that the market is coiling for a potential move.
Volume has pulled back slightly since the breakout, but there’s no sign of aggressive selling. The structure remains clean: higher highs, higher lows, and a clear path toward the next major resistance at $112,000.
For now, it’s a bullish posture with strong technical support below and a stair-step climb in progress. Unless price falls back below $106,787, this looks like a base being built for continuation – not exhaustion.

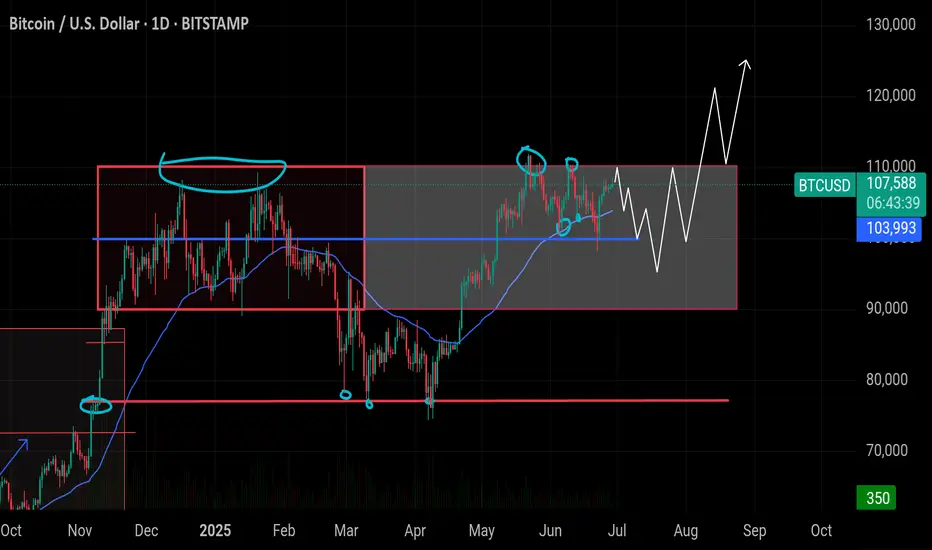
$BTC: Breakout Loading – Massive Opportunity Ahead! BTC is consCRYPTOCAP:BTC : Breakout Loading – Massive Opportunity Ahead!
BTC is consolidating within a major structure for 224+ days. Current price action is forming a bull flag, signaling strong potential for a breakout toward $120,000–$150,000. Short-term volatility expected, but long-term trend remains bullish.
🔸 Support at $90,000–$93,000:
Strong confluence in this region including CME gap, liquidity pools, and previous structure support. Rejection from $113K could trigger a flush into this zone. Long setups should be considered here. Whales are accumulating.
🔸 Upside Target: $120,000 – $150,000
Long-term breakout from consolidation range aligning with historical accumulation patterns and macro indicators like M2 lag. Break of $113K with strength opens doors to $120K+. Clean structure with confirmed support will fuel rally continuation.
🔸 Risk Level at $88,000:
If BTC breaks below $88K with volume and closes under structure, it would invalidate the bull flag scenario short-term and signal deeper correction.
🔸 Outlook:
Monitor price reaction near $113K. Prepare for fakeout and potential sweep into $90K–$93K zone. Place laddered long orders in that range for optimal R:R. If dip occurs, treat it as a gift entry. No bearish outlook unless macro conditions shift drastically. Momentum remains upward.
Decoding the Dollar's Next MoveThe Dollar Index (DXY) currently stands at a critical crossroads, with its weekly close below 98.00 poised to dictate the trajectory of major asset classes for the coming weeks. The DXY closed as a bearish weekly candle at 97.2, confirming the "Bearish Dollar Scenario" as it closed below the 98.00 level. The market sentiment is currently cautious, awaiting clear directional cues from the DXY2. Our analysis will explore the Bearish Dollar Scenario, outlining potential price movements and actionable recommendations across a range of correlated assets

CHECK BTCUSD SIGNAL READ CAPTAINsell Setup)
Entry Zone: Around 107200.00 \107000.00
Stop Loss: 108000.00
Take Profits:
TP1: ~106400.00
TP2: ~105400.00
Final Target: 104600.00

Could BTC Hit \$160,000 Before 2026?
As of **June 2025**, Bitcoin trades near **\$61,000**. But based on historical patterns, market signals, and macro trends, here’s a bold scenario that could unfold:
**📊 Key Signals:**
* The **2024 Bitcoin halving** cut new supply by 50%.
* **Institutional Bitcoin ETFs** now control over 6% of circulating BTC.
* **U.S. rate cuts** expected Q3 2025 could trigger a flood of new capital.
* **Global unrest** pushing investors toward alternative stores of value.
**🔥 Mind-Blowing Prediction:**
If Bitcoin follows even half of its average post-halving surge, we could see **\$150,000 BTC before March 2026**.
That’s a **+145% gain from today’s price** — within historical norms:
* 📈 2020 post-halving: +300%
* 📈 2016 post-halving: +600%
**⚠ Risks remain:** regulations, market shocks, or ETF outflows could stall momentum.
**✅ Bottom Line:**
If Bitcoin’s history repeats (or even rhymes), \$150k is not impossible — and 2025 could be the setup year.
#Bitcoin #BTC #CryptoPrediction #CoinMarketCap


BTC BOUNCESBitcoin just pulled off a clean bounce off support, landing perfectly on the 50-day moving average around $105,800 – a level that’s repeatedly proven its importance. The move came with a solid +2% daily candle, reclaiming lost ground and putting the bulls back in control for now. Price is still trapped under the descending trendline just below $112,000, which has capped every breakout attempt over the past month, but momentum is shifting. As long as BTC stays above that support zone and keeps printing higher lows, the structure looks bullish. A breakout above that trendline would likely send us flying – but fall back below $105,800, and we’re probably retesting $100,700. For now, the bounce looks strong, the trend is intact, and the ball’s back in the bulls’ court.

Bitcoin H4 | Potential bullish bounce off an overlap supportBitcoin (BTC/USD) is falling towards an overlap support and could potentially bounce off this level to climb higher.
Buy entry is at 106,535.50 which is an overlap support that aligns with the 23.6% Fibonacci retracement.
Stop loss is at 104,600.00 which is a level that lies underneath a swing-low support and the 38.2% Fibonacci retracement.
Take profit is at 108,808.50 which is a multi-swing-high resistance.
High Risk Investment Warning
Trading Forex/CFDs on margin carries a high level of risk and may not be suitable for all investors. Leverage can work against you.
Stratos Markets Limited (tradu.com ):
CFDs are complex instruments and come with a high risk of losing money rapidly due to leverage. 63% of retail investor accounts lose money when trading CFDs with this provider. You should consider whether you understand how CFDs work and whether you can afford to take the high risk of losing your money.
Stratos Europe Ltd (tradu.com ):
CFDs are complex instruments and come with a high risk of losing money rapidly due to leverage. 63% of retail investor accounts lose money when trading CFDs with this provider. You should consider whether you understand how CFDs work and whether you can afford to take the high risk of losing your money.
Stratos Global LLC (tradu.com ):
Losses can exceed deposits.
Please be advised that the information presented on TradingView is provided to Tradu (‘Company’, ‘we’) by a third-party provider (‘TFA Global Pte Ltd’). Please be reminded that you are solely responsible for the trading decisions on your account. There is a very high degree of risk involved in trading. Any information and/or content is intended entirely for research, educational and informational purposes only and does not constitute investment or consultation advice or investment strategy. The information is not tailored to the investment needs of any specific person and therefore does not involve a consideration of any of the investment objectives, financial situation or needs of any viewer that may receive it. Kindly also note that past performance is not a reliable indicator of future results. Actual results may differ materially from those anticipated in forward-looking or past performance statements. We assume no liability as to the accuracy or completeness of any of the information and/or content provided herein and the Company cannot be held responsible for any omission, mistake nor for any loss or damage including without limitation to any loss of profit which may arise from reliance on any information supplied by TFA Global Pte Ltd.
The speaker(s) is neither an employee, agent nor representative of Tradu and is therefore acting independently. The opinions given are their own, constitute general market commentary, and do not constitute the opinion or advice of Tradu or any form of personal or investment advice. Tradu neither endorses nor guarantees offerings of third-party speakers, nor is Tradu responsible for the content, veracity or opinions of third-party speakers, presenters or participants.

Bitcoin Mid Term Game Plan - BTC PLANBitcoin just broke a key resistance level with strength.
I expect a new all-time high soon, likely the summer top.
Summer markets are usually weak for risk assets and strong for gold. Seasonality matters, keep that in mind.
I expect risk markets to sell off until mid-July to early August. I’ll start buying once we break structure again.
The plan:
Wait for BTC to hit $110K
Look for a reversal from that level
Start aggressively shorting alts, beginning with ETH and memecoins
Hold shorts until late July / early August
Close positions and shift back to buying

BTC is clearly gearing up for its next big move.Could we see 120k next per the pattern unfolding before us?
It may not (or it could) happen now, but BTC definitely looking BULLISH!
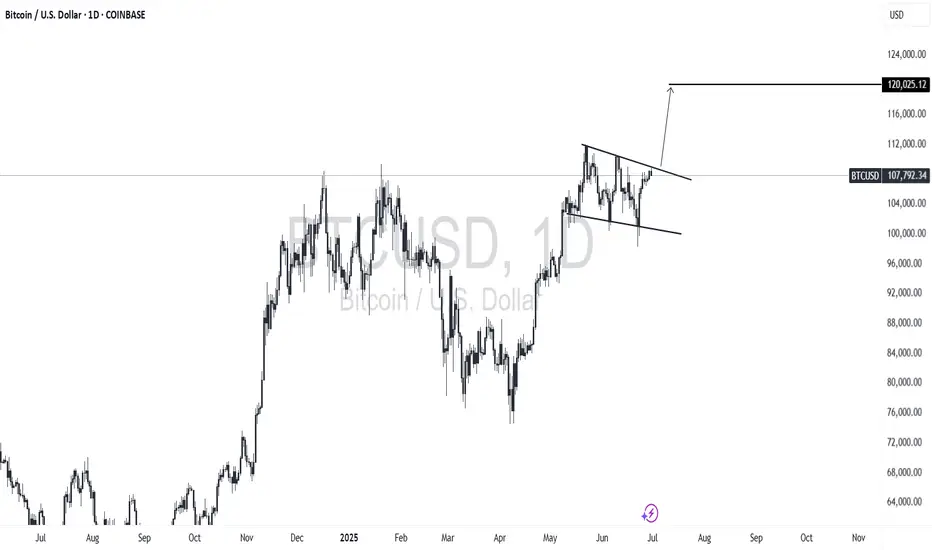
Bitcoin is now **on the verge of one of the biggest breakouts in
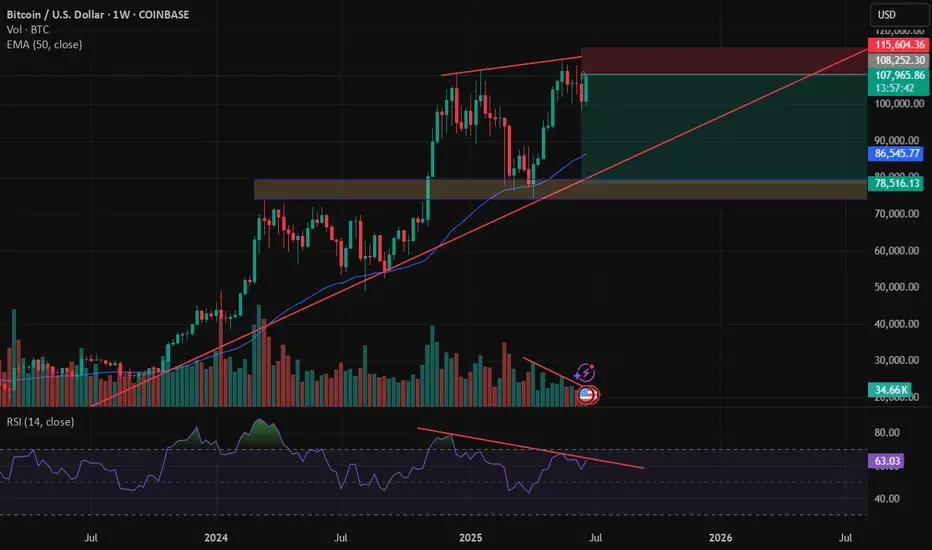
\#Bitcoin – **Higher Time Frame Analysis** 📈
Bitcoin is now **on the verge of one of the biggest breakouts in its history**.
📊 On the **daily chart**, we can clearly see a structure forming that's **similar to a Pole & Flag pattern**, which is typically **very bullish** from a price action perspective.
⚠️ However, we remain **cautious** —
We don’t just want a breakout above the upper trendline…
What we’re looking for is a **strong daily candle close above the previous all-time high** (\~**\$112,000**).
💥 If that happens, I’m anticipating a **massive upside move**, potentially towards the **\$123,000–\$125,000** zone.
Let’s stay alert and wait for **clear confirmation** before jumping in!

Bitcoin sell short Go 86kAfter the RSI breaks the trend line, a sell trade can be taken to hold 86,000.
