BTCUSD Analysis | Bearish Setup Unfolding?Bitcoin is trading within a descending channel, respecting lower highs and lower lows. The recent price action shows a sharp bounce from the $98,600 support zone, but the bigger picture still hints at potential downside.
🔍 Key Technical Insights:
Descending Channel remains intact – structure suggests bearish continuation.
Price bounced from $98,626 support, but is struggling below key resistance at $108,622.
A possible lower high formation near $106K–$107K could trigger the next drop.
Bearish projection remains valid if price fails to break above the descending trendline.
🟢 Upside Scenario: If bulls manage to break above $109K resistance, we could see a bullish reversal.
🔴 Downside Target: If the bearish setup confirms, we may revisit the $98,000–$99,000 support area once again.
📌 Plan Accordingly:
Wait for price action confirmation near resistance. Patience pays in volatile zones like this!
#BTCUSD #Bitcoin #CryptoAnalysis #TradingView #BTCUpdate #CryptoTrader #TechnicalAnalysis
BITCOIN trade ideas

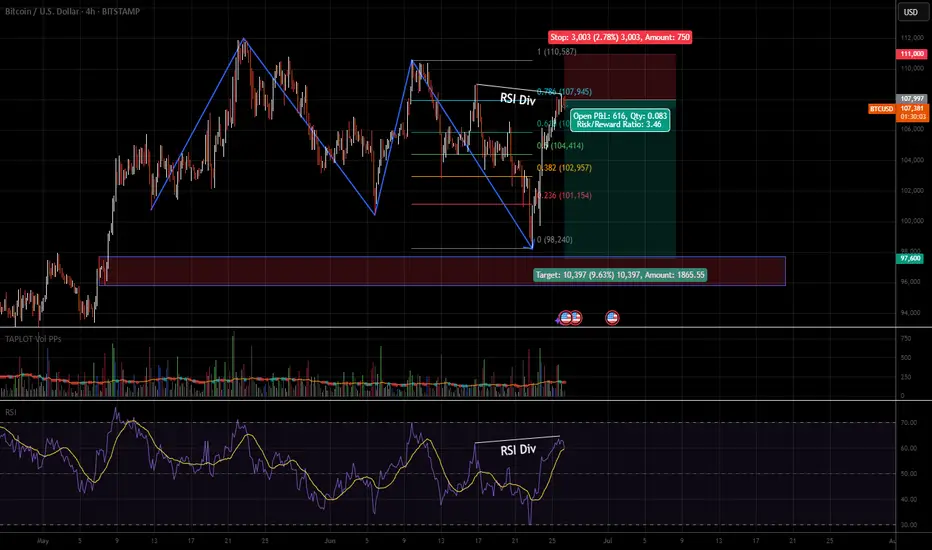
BTC Another Short SetupI want to try another BTC short position here.
BTC perform very well but we're still in QT.
RSI Div is obvious. Price going up but volume going down.
It's worth to try.
If you want to be in safe pos, wait till 1H structure break to bearish.
BITCOIN STRONG RESISTANCE AHEAD|SHORT|
✅BITCOIN is going up now
But a strong resistance level is ahead at 112,000$
Which is also an All-Time-High
Thus I am expecting a pullback
And a move down towards the target of 107,300$
SHORT🔥
✅Like and subscribe to never miss a new idea!✅
Disclosure: I am part of Trade Nation's Influencer program and receive a monthly fee for using their TradingView charts in my analysis.

BTC Bull Flag Breakout or Fakeout? Eyes on $107K–$112K ZoneHere's my updated chart for Bitcoin (BTC/USD) on the daily timeframe. The price action is currently testing a key zone that could define whether we're heading into the next major leg up, or facing another rejection.
Pattern Breakdown:
- BTC is respecting a bull flag formation after a strong impulse leg earlier this year.
- The $105K level has held as critical support, keeping the bull flag structure intact.
- Price is currently pressing against descending resistance (~$107K) with tightening consolidation indicating an imminent breakout decision.
Key Levels to Watch:
Support:
$105K – holding this level keeps bullish momentum valid.
$101.6K (Bollinger midline)
$100.4K (EMA 100) – must hold for macro trend to stay intact.
Resistance (before $112K):
$107K – major descending trendline resistance.
$110.1K – upper Bollinger Band and recent local high.
$112.45K – key breakout level from the flag. A daily close above this could trigger a sharp rally.
Indicators:
MACD is forming a bullish crossover but lacks strong momentum, watch for a green histogram to confirm.
RSI at ~51 gives BTC room to run, not in overbought territory.
Volume is low, but coiling tight near the apex could spark volatility.
Conclusion:
BTC is at a critical decision point. A clean breakout above $107K, followed by sustained momentum through $110K–$112K, would significantly raise the probability of a confirmed bull flag breakout, with a potential move toward $120K+.
However, the $105K level is a key support that must hold to keep this structure intact.
If we see a daily close below $105K, attention shifts to the $101K level (Bollinger Band midline + 53 SMA).
A close below $101K would invalidate the bull flag entirely, turning this setup into a potential bull trap, and shifting short-term bias bearish.
All eyes are on the $107K–$112K resistance zone for confirmation—or breakdown signals if support levels give way.

Turn off the noise. Listen to price. $XBTUSDFor me, BITMEX:BTCUSD.P is still in a bullish setup. If you are long, don't panic sell early yet. The signal to sell would be a break of my LIS which currently stands at 103703. If it makes new highs, it would be even more convincing that it wants to go higher ie. don't sell at new highs.
If a new high is made, i will be able to provide a min target to the upside. I will keep you updated.

BTCUSD Short setup on the 30-min chart#BTCUSD Short setup on the 30-min chart.
Resistance holding strong.
> Entry: ~$107,140
> SL: $107,815
> TP: $105,437
> What are your thoughts? #Bitcoin #Crypto #TradingView

Market next target ⚠️ Disruption & Analytical Weaknesses:
1. Support Zone Already Broken (Wick Penetration):
The candlestick wick clearly pierced the support level drawn on the chart.
This indicates that buyers are weak at that level — the support is not holding firmly.
Relying on this support for a bullish bias is risky, as it may soon turn into resistance.
2. Volume Confirms Weakness, Not Strength:
The bounce from the support zone happens on low or declining volume, suggesting lack of strong buying interest.
A legitimate bullish reversal should be backed by a volume surge — here, that’s absent.
3. False Sense of Recovery:
The analysis shows arrows projecting straight up to the “Target” level, implying a smooth bullish recovery.
This is unrealistic given the recent choppy price action and repeated failures to hold gains above 107,200.
Price action suggests uncertainty or distribution, not clean bullish momentum.
4. Tight Range and High Volatility Ignored:
Price has been ranging between ~106,400 and ~107,600 with rapid whipsaws.
This kind of structure is often indicative of indecision, and setting a clear directional target without breakout confirmation is premature

Bitcoin's Bullish DriversThe four bullish drivers behind Bitcoin's rally:
1.Institutional involvement: BlackRock and other institutions have accumulated large positions through ETFs, with OTC inventory declining, creating a scarcity effect in the market.
2.Policy tailwinds: Escalating expectations of Federal Reserve rate cuts have enhanced Bitcoin's attractiveness under low-interest-rate environments.
3.Regulatory breakthrough: China's Guotai Junan International has obtained regulatory approval, opening a compliant channel for Chinese capital.
4.Technical support: The 50-day moving average has broken above the 200-day moving average, forming a "golden cross" that confirms the long-term upward trend.
BTCUSD
buy@106000~107000
SL:105000
TP:108000~109000
I am committed to sharing trading signals every day. Among them, real-time signals will be flexibly pushed according to market dynamics. All the signals sent out last week accurately matched the market trends, helping numerous traders achieve substantial profits. Regardless of your previous investment performance, I believe that with the support of my professional strategies and timely signals, I will surely be able to assist you in breaking through investment bottlenecks and achieving new breakthroughs in the trading field.

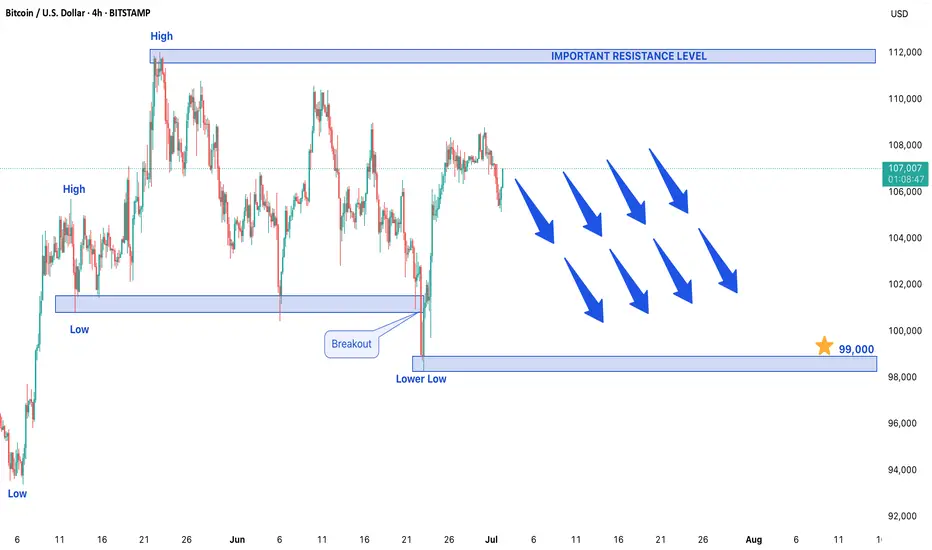
BITCOIN STRATED FORMING BEARISH TREND STRUCTUREBITCOIN SHOWS SIGNS OF BEARISH REVERSAL – KEY LEVELS TO WATCH
After an extended bullish run, Bitcoin is now showing early signs of a potential trend reversal as the market begins forming a bearish structure. The formation of a lower low on the price chart indicates weakening bullish momentum and suggests that sellers may be gaining control. This development comes after a sustained upward trend, signaling that a corrective phase could be underway in the cryptocurrency market.
Bearish Confirmation: Lower Low Formation
The appearance of a lower low is one of the most reliable technical indicators of a trend reversal. This pattern demonstrates that bears are successfully pushing prices below previous support levels, establishing a new downward trajectory. While this doesn't necessarily confirm a long-term bear market, it does suggest that Bitcoin could face further downside pressure in the near term. Traders should watch for confirmation through follow-through selling or additional bearish candlestick patterns.
Downside Target: $99,000 in Focus
If the bearish momentum continues, Bitcoin could test the $99,000 support level in upcoming trading sessions. This level represents a psychologically important zone where buyers may attempt to step in. However, a decisive break below this support could accelerate declines, potentially leading to deeper corrections. Traders should monitor volume and price action around this level for signs of either consolidation or continuation of the downtrend.
Resistance Level: $12,000 as Key Barrier
On the upside, $12,000 now acts as a critical resistance level. Any short-term rallies toward this zone could attract renewed selling pressure, reinforcing the bearish outlook. For the current downtrend to be invalidated, Bitcoin would need to reclaim and sustain above this resistance with strong buying volume. Until then, traders may consider selling into strength near this level while maintaining tight risk management.
Market Outlook: Correction Expected After Prolonged Rally
Given Bitcoin's history of volatile price swings, this potential reversal should not come as a complete surprise after its extended bullish run. Market participants should watch for:
- Increasing trading volume on downward moves (confirming bearish conviction)
- Potential bearish continuation patterns (like descending triangles or flag formations)
- Macro factors that could influence crypto markets (regulatory news, ETF flows, or macroeconomic shifts)
Conclusion
Bitcoin appears to be entering a corrective phase, with $99,000 as the next key downside target and $12,000 serving as major resistance. While the broader uptrend may still be intact long-term, short-term traders should prepare for potential bearish continuation. As always, proper position sizing and stop-loss strategies remain crucial in navigating Bitcoin's inherent volatility. A break above $12,000 would require reassessment of the bearish outlook.
BITCOIN STRATED FORMING BEARISH TREND STRUCTURE.BITCOIN STRATED FORMING BEARISH TREND STRUCTURE.
Market started forming lower low, which indicate bearish trend.
After a long Bullish trend, a correction is expected in market.
Market is expected to remain Bearish in upcoming trading session.
On lower side market may hit the target level of 99,000$ in upcoming trading sessions.
On higher side 12,000$ price may act as a key resistance level for the market.

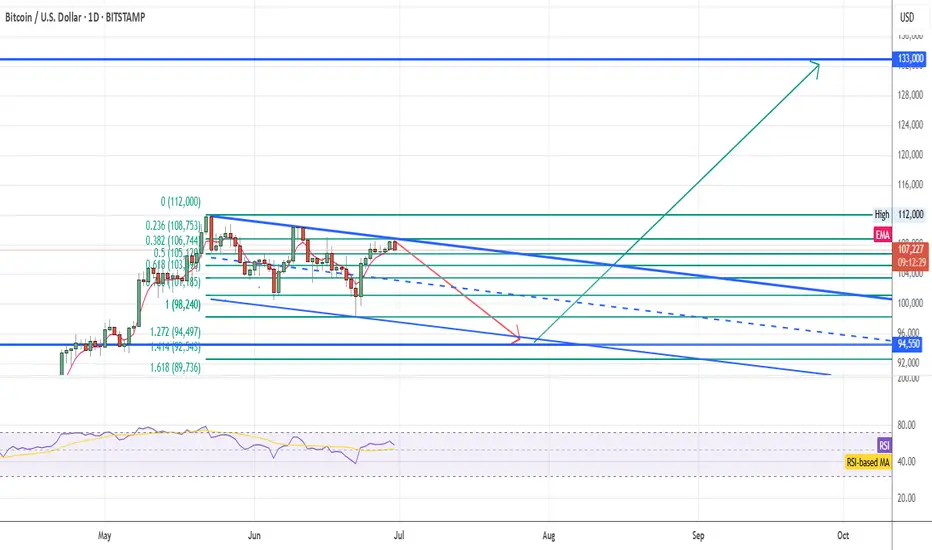
BTC updateBTC is moving in a falling wedge once broken my final target is still intact @133k but in the short term we could see a retracement to 94,5k .
So my plan is to buy BTC in case of 94,5k or in case of bullish continuation , to buy BTC once falling wedge will be up broken.
$BTC Bullish Engulfing Weekly CloseCRYPTOCAP:BTC closes the Week with a Big Bullish Engulfing candle back within the POI.
Should retest ATH soon.

#BTCUSD Buy 107248.20#BTCUSD Buy 107248.20
SL 106648.20
TP 107448.20
TP 108248.20
TP 109648.20
Trade at your own risk
Protect your capital
The Wizard 🧙♂️ SWFX

“DXY at 3-Year Low | Gold Slips, BTC Stalls – What PCE Data Meann this week’s Market Recap, we break down the key moves across the US Dollar Index (DXY), Gold (XAUUSD), and Bitcoin (BTCUSD) — and how they’re all being shaped by rising Fed uncertainty and looming U.S. inflation data.
🔹 DXY is hovering near 3-year lows as political pressure and expectations of Fed rate cuts weigh on sentiment.
🔸 Gold is slipping near 4-week lows as Middle East tensions ease and risk appetite returns.
🔹 Bitcoin remains flat but poised for a breakout, with macro data in the driver's seat.
We explain how each market is reacting, what traders are pricing in ahead of the upcoming PCE inflation data, and how to position yourself in the week ahead.
📌 Covered in this recap:
Market sentiment shifts and key news drivers
Practical insights for interpreting price action
What to watch in next week’s economic calendar
📊 Stay informed, stay prepared.
👉 Like, follow, and comment if you found this helpful. Let’s trade smart.

BULISH ON BTChi .
this in my humble forcast for the BTC ATM
juste wait for confirmation in the zones i put and you can long

108400 Breakout Level – Bullish Above, Bearish BelowWatching 108400 closely as a key breakout level.
Above 108400: Momentum shifts bullish – potential for upward continuation.
Below 108400: Bias remains bearish – risk of further downside.

Bitcoin setup: bearish for now but watch Trump’s crypto deadlineBitcoin is sliding, and the technicals point lower with clear RSI divergence and a possible descending triangle. But this could all change fast. Trump’s crypto working group is set to propose major changes by 23 July. If the news points to deregulation or a return of ICOs, Bitcoin could explode higher. In this video, we break down the chart, the risks, and the potential trigger that could flip sentiment overnight.
This content is not directed to residents of the EU or UK. Any opinions, news, research, analyses, prices or other information contained on this website is provided as general market commentary and does not constitute investment advice. ThinkMarkets will not accept liability for any loss or damage including, without limitation, to any loss of profit which may arise directly or indirectly from use of or reliance on such information.

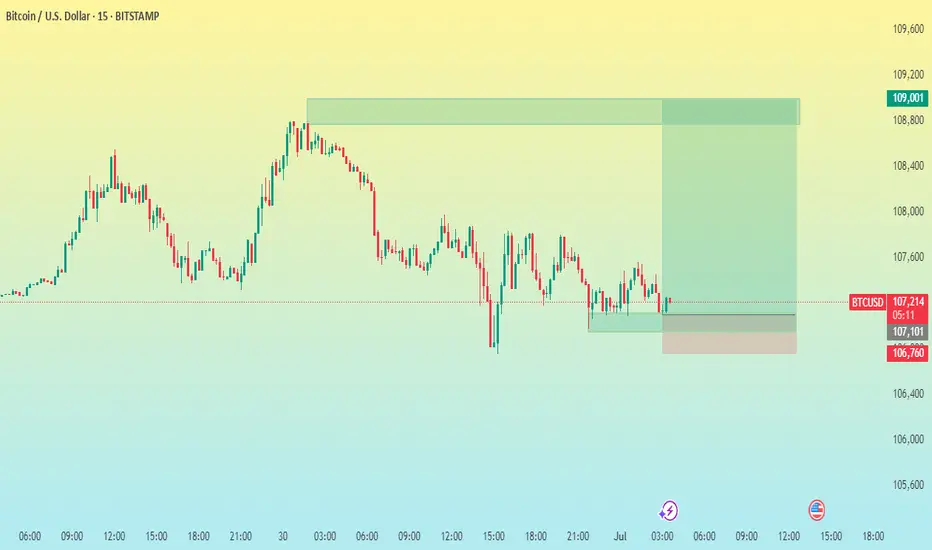
BTC/USD 15M CHART PATTERNHere’s a summary of your BTCUSD trade setup:
---
🟢 Buy Entry: 107,195
🎯 Take Profits:
1. 107,600
2. 108,400
3. 109,000
🔴 Stop Loss: 106,760
---
🔍 Risk-Reward Analysis:
Target Distance from Entry Risk-Reward Ratio (approx)
TP1: 107,600 +405 ~1.1:1
TP2: 108,400 +1,205 ~3.3:1
TP3: 109,000 +1,805 ~5:1
SL: 106,760 -435 —
---
📌 Notes:
Solid R/R: TP2 and TP3 offer favorable risk-reward ratios.
Scalping TP1: TP1 is close; good for quick exit or partial take.
Stop-loss proximity: 435 points below entry; tight but reasonable for short-term trading.
Market condition check: Make sure momentum is in your favor (use indicators like RSI, MACD, or price action confirmation).
Would you like help with setting this up in a trading platform, or converting it into a script for TradingView (Pine Script)?
BTC Blow off top coming soon?BTC cycles is showing the blow off top might be closer then we think, by the end of year 2025
BTC has always done this cycles and I hear "this time is different" since forever.
Do I expect this time to be different? Absolutely not.
Even if it goes to 140k? it is still the same wave and its expected to be honest, 120-140k is still at play and that will be the end of the fireworks finale.


Bitcoin BTCUSD 4H Chart Analysis – Potential Breakout Incoming!Bitcoin is currently consolidating after a strong bullish recovery from the $96,000 zone, holding above $107,000. Price is forming a tight range — a breakout is imminent.
⚡ If BTC breaks above $107,500 with momentum, expect price to target $110,000 and $112,000 short-term.
⚡ If price rejects $107,500 and breaks below $106,500, we could see downside towards $104,000.
⚠️ Watch for volume confirmation before entries. No FOMO.
🚀 Stay ready — breakout traders, your setup is building.
#Bitcoin #BTCUSD #Crypto #TradingView #BTC #Breakout #CryptoTrading

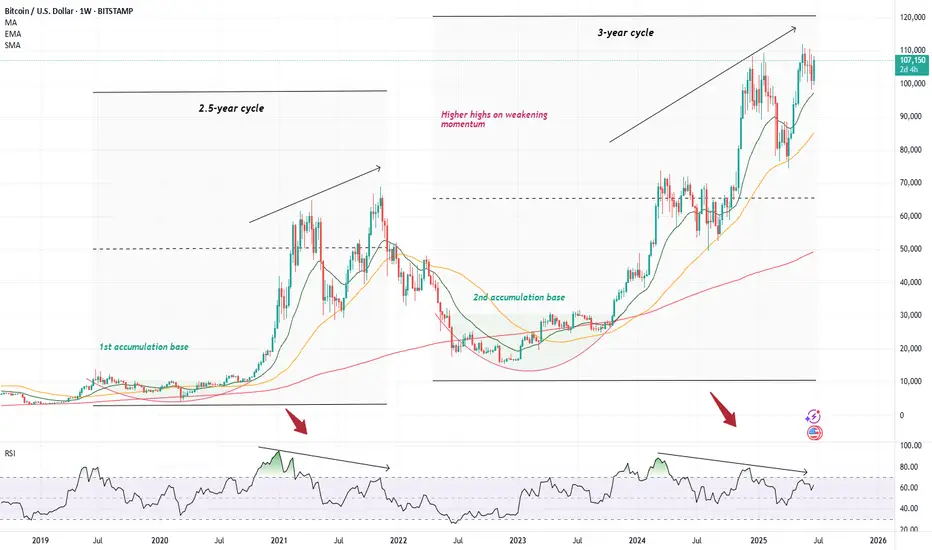
Cautionary tale on BitcoinI decided to temporarily depart from my usual trade ideas to wave a cautionary finger at the chart of Bitcoin, where I have noticed a rather worrying pattern within the weekly charts. However, before I delve in, I would like to stress that I am a very rigid believer in the long-term prospect of our monetary saviour and what I am supposed to write about only concerns the usual, inevitable cyclicality that always entails the otherwise upward-sloping trajectory of Bitcoin ( CRYPTO:BTCUSD )
Although overall this has not felt like much of a crypto bull run given the apparently absent performance of altcoins (apart from an occasional 1000x on a well-targeted memecoin), Bitcoin has, in the meantime, trod its usual path upwards. Since the '22 lows, it has mimicked its regular pattern where after a devastating plummet lower, it has spent several long months accumulating until it has burst out of its cocoon to provide a 6x return to its strong believer. However, the mimicking is almost too good as we have now started painting a very similar picture to what eventually transpired to be the '21 top. We have reached a strong above >100k top only to hit a vicious correction (announcement of tariffs), similar to what Bitcoin did in May of 2021 (China crackdown, tech selloff). The price then quickly consolidated - which I am not an avid fan of as a formation of a more robust base would be more preferable (though would take longer ) - and bitcoin shot back up again, quickly reclaiming the previous highs; just like it did in October/November 2021. This creates an unfortunate setup best represented by the series of lower highs on an RS I while the price keep climbing higher - creating the probably best-know bearish signal with higher highs built on weaker and less robust momentum.
We know how this ended in 2021, and I am not suggesting that Microstrategy should blow up, go bankrupt and sell all its bitcoin (though definitely a possibility) - however, one must admit that there are currently quite a lot of uncertainties that could unwind at any time (one such coming on July 8th with the second version of the lets-blow-up-the-stock-market day). With a stock market priced to perfection, and with what seems like a large pile of uncertainties hovering in the air, it seems like any one of these could light up the fire underneath these lovely valuations we have reached, and although I would love for cryptocurrency prices to be completely independent of the stock market, we usually know how this goes.
So, what to do about this? Preferably nothing . If you are as much of a believer as I am in the necessity of bitcoin in today's financial world, this is just another blip in an otherwise long and profitable ride. So, I won't be any selling any of it - hopefully only adding once we decline. I would also add that I am not expecting as much of a bloodbath as last time. I think Bitcoin has reached a point where the 80-90% declines become very rare. However, regarding my other allocations in crypto assets, I am not as optimistic, hence I decided to sell most of everything else. Although I love the premise of Ethereum, the chart looks pretty horrific, currently drawing a perfect head-and-shoulder on a 4h chart (which I might write about as well as a short idea).
I will end this essay the same way I started it - I know absolutely nothing, and maybe I will come back at the end of the summer, beautifully tanned and relaxed as we all are in Europe, and find everything at all-time highs. I just currently believe the risk-reward ratio is not skewed in my favour, and I don't know how about you, but I tend to listen to my probability gods, especially on the eve of another strong SPAC year .
BTCUSD Short Idea - Looking for further downsideBTCUSD (15m timeframe).
* Bearish Trend: Price has been respecting the downtrend line.
* Structure Break (ChoCh): Multiple 'ChoCh' (Change of Character) signals indicate a shift in market structure to bearish.
* Supply Zone Entry: I'm looking for a retest of the recent supply zone around 107,208 - 107,059 for a short entry.
* Stop Loss: Placed above the last significant high and supply zone around 107,861.
* Target: Aiming for 105,445, potentially lower, targeting previous lows and liquidity.
Always manage your risk! Let me know your thoughts."
