AAL American Airlines Options Ahead Of EarningsLooking at the AAL American Airlines options chain, i would buy the $15 strike price Calls with
2022-11-18 expiration date for about
$0.46 premium.
Looking forward to read your opinion about it.
AAL trade ideas

American Airlines Group flying up to $16.93 Inv Head and Shoulders has formed on Daily chart
We are just waiting for the breakout which will send the price to Target $16.93
With the bull market across the board with investors moving their money back to stocks and out of crypto, we are seeing global upside to come for stocks.

Is American Finally Cleared for Takeoff?American Airlines has struggled for years. Could it now regain lost altitude?
The first pattern on today’s chart is the falling trend line along the highs of May, August and September. The carrier pushed through that resistance last week and has now bounced at it. Has the line become support?
Next is the recent low around $12. This closely matches the 78.6 percent Fibonacci retracement level of the entire rally between March 2020 and May 2021. (For the sake of visual simplicity, the other retracement lines are not shown.)
Including the low in June, AAL has also formed a double bottom around the same price level. That’s another potential sign of sellers losing control.
Third, the Relative Strength Index has shown positive divergence over the same time period.
Finally seasonality and fundamentals could be in play as travel rebounds into the holidays. TSA data shows daily flights consistently back above 2 million per day. AAL also reported strong quarterly numbers last week (echoing the results of peers like Delta Airlines and United Airlines ).
TradeStation has, for decades, advanced the trading industry, providing access to stocks, options, futures and cryptocurrencies. See our Overview for more.
Important Information
TradeStation Securities, Inc., TradeStation Crypto, Inc., and TradeStation Technologies, Inc. are each wholly owned subsidiaries of TradeStation Group, Inc., all operating, and providing products and services, under the TradeStation brand and trademark. You Can Trade, Inc. is also a wholly owned subsidiary of TradeStation Group, Inc., operating under its own brand and trademarks. TradeStation Crypto, Inc. offers to self-directed investors and traders cryptocurrency brokerage services. It is neither licensed with the SEC or the CFTC nor is it a Member of NFA. When applying for, or purchasing, accounts, subscriptions, products, and services, it is important that you know which company you will be dealing with. Please click here for further important information explaining what this means.
This content is for informational and educational purposes only. This is not a recommendation regarding any investment or investment strategy. Any opinions expressed herein are those of the author and do not represent the views or opinions of TradeStation or any of its affiliates.
Investing involves risks. Past performance, whether actual or indicated by historical tests of strategies, is no guarantee of future performance or success. There is a possibility that you may sustain a loss equal to or greater than your entire investment regardless of which asset class you trade (equities, options, futures, or digital assets); therefore, you should not invest or risk money that you cannot afford to lose. Before trading any asset class, first read the relevant risk disclosure statements on the Important Documents page, found here: www.tradestation.com .

AAL - Short term flag play! Quick Post tonight!
Covering the Technicals of AAL ~ American Airlines!
Sadly this company does Report Earnings tomorrow, so that could screw with out Technical Analysis on this Chart, so I am keeping this short as Fundamentals will take presence!
We are seeing a clear flag being printed on the Daily Chart here, and A clear bounce off the support band. Looking here for a simple continuation upwards toward the upper trendline from the flag. The Candle made today is neutral, so we are looking for a jump in the coming days for a short term move up.
Momentum is in Bulls Favor (Daily, and Weekly)
It looks like a possible easy move up to resistance that could pay well.
Also, a break thru could be explosive.
Pros :
Predictable Chart here
Everything almost in favor
Con :
Daily Candle
Earnings tomorrow 9/20

2X $AAL TP2 HIT for 20%! (PERFECT SETUP)I STATED BEFORE THAT THIS WAS A PATIENT PLAY FOR A REASON! We have been in this since Aug. 17th, the put sznn has arrived!

2X $AAL TP1 HIT for 12%! (PERFECT SETUP)$AAL is going to keep selling btu i am glad i got people in early just in case it reverses! Lock in profit and continue to get in low-risk trades on this setup!

AAL I am bullish on AAL and I believe that it's a good buy, especially at this price. If I were to enter on current price I would put my S/L at $11.50 and my T/P at $25

#AAL long idea at monthly pivot support$AAL Price finds support at monthly pivot line.
Close above 13.93$ triggers idea with profit target 15.7$ and stop 13.5$. Risk Reward ratio 4.9


2X $AAL 1D Tech. Analysis!AMERICAN AIRLINES is a patient play for 2 reasons! If it breaks out this channel, we are looking for a retest and confirmation for the drop to continue with volume. Then if it bounces off the bottom and price heads to the top of the channel then we get a even better entry on this setup! Be patient and execute!

17.50 target w/ a cup/handle breakoutreviewing the monthly chart as well, shows both the AD/Stoc have bottom.

AAL - ClosedTrades2Who has not been subscribed to me, please review this idea:
I'm showing on the chart how this short was executed.
Closed it yesterday as it came to the support level.

AAL short - UPDATEUpdating my AAL earnings idea:
As you can see, we got a confirmation of the described scenario.
It was acceptable to sell intraday using the VWAP pullback point.
Also on the second day we got something similar to a flag, which has worked out.
But of course, being in a position already on the first day, I would not add on the second day.

AAL daily frame (possible leading diagonal in sub a)leading diagonal is a clear possibility with a 2.5 r/r.....meh, but its a good watch

AAL - short AAL reported today and in my opinion has all the signs to go lower.
1. Bear Flag (for those who want it, the Rising Wedge)
2. Support became resistance
3. Fib levels
If there would be good entry points, I will sell

#SuakuFlowsWatchlist, 18/7/22#SuakuFlowsWatchlist
Expiry: 22JUL22
$AAL 15C > 14.56 | 14P < 14.05
$UAL 39C > 38.83 | 37P < 37.44
Focusing on the airlines on Monday ✈️
Liking the setup to the upside.
Scale out above 20%.

These Two Airlines Should Be In Your PortfolioUp first is American (NASDAQ: AAL), part of that group of majors who’ll be hit hardest by the headlines from London. Their Q2 earnings are due out next week and investors will have a clearer picture of the internal numbers then, but for now at least the trends around its long-term stability are positive. Just yesterday, the company told investors they expect their quarterly revenue to be up 12% versus the same quarter in 2019, which was a welcome update. Airlines, among other front line industries affected the most by COVID, have been skipping 2020 when doing like for like quarterly comparisons, and this will have been a solid stat for them to share.
The other carrier that should definitely be on your watchlist, if not in your portfolio, is Southwest (NYSE: LUV). This column has written about the US flier’s consistent strength versus its more internationally focused peers several times in recent years, and it’s a tone we’ll be continuing here.
Whereas American shares are still down more than 50% from their pre-pandemic levels, Southwest shares are ‘only’ down 30%. This suggests Wall Street sees much more inherent strength in them that could justify their inclusion in the right kind of portfolio.
Indeed, it was only yesterday that the team over at Susquehanna upgraded Southwest shares from a Neutral rating to a Positive. This change was one of several they made during a sweep of the airline sector, a sweep that for context saw their price target on American shares dropped from $19 to $15. Analyst Christopher Stathoulopoulos said with the changes that “while we’ve yet to find any cracks in airline booking data, we believe that at some point consumers will have to contend with the economic reality of higher air fares, outsized general inflation, and potential layoffs in select industries (e.g., finance, tech, and media) into 2023."
They see this affecting the non-budget flier like American more than budget friendly fliers such as Southwest, whose various revenue initiatives and its break into corporate travel should bring fresh support to its share price. Southwest is also seen having ample liquidity to ride out a downturn, something that previous bullish comments on the stock have highlighted as well. Their shares are up about 14% from their low of last month and also on track to test the downtrend that’s been in place since their recovery peaked in April of last year.
It’s fair to say that both stocks are worth keeping on your watchlist, and depending on your tolerance for risk and investment timeline, there’s an argument for both being part of your portfolio.

AAL: Travel is Back!American Airlines
Short Term - We look to Buy at 13.78 (stop at 12.30)
Although the bears are in control, the stalling negative momentum indicates a turnaround is possible. The trend of higher highs is located at 13.40. There is scope for mild selling at the open but losses should be limited. Further upside is expected although we prefer to buy into dips close to the 13.40 level.
Our profit targets will be 17.89 and 19.00
Resistance: 18.00 / 21.00 / 25.00
Support: 13.40 / 11.00 / 9.00
Please be advised that the information presented on TradingView is provided to Vantage (‘Vantage Global Limited’, ‘we’) by a third-party provider (‘Signal Centre’) . Please be reminded that you are solely responsible for the trading decisions on your account. There is a very high degree of risk involved in trading. Any information and/or content is intended entirely for research, educational and informational purposes only and does not constitute investment or consultation advice or investment strategy. The information is not tailored to the investment needs of any specific person and therefore does not involve a consideration of any of the investment objectives, financial situation or needs of any viewer that may receive it. Kindly also note that past performance is not a reliable indicator of future results. Actual results may differ materially from those anticipated in forward-looking or past performance statements. We assume no liability as to the accuracy or completeness of any of the information and/or content provided herein and the Company cannot be held responsible for any omission, mistake nor for any loss or damage including without limitation to any loss of profit which may arise from reliance on any information supplied by Signal Centre.

ANALYSIS ON W1 Airline stocks have see a massive hit since the current economic downturn but could it be the climax basing for the next cycle
The 13-year cycle from 2008 completed a 661 week trend and market is forming a base for a 5-year bull market.
Repeating market patterns give us a clue of what we can project after completion of the cycle
1896 - 1903 7-year cycle
10/2004 - 05/2005 7- months cycle
06/1994 - 12/1994 6-months cycle
In the 3 occurrences there was a bull market that followed averaging 5 years
Giving that the next cycle node is in 2028 we can expect the bottom anywhere between now and March 2023

Week 3 assignment (EXHIBIT B) for AAL by PROSHERIFFA Bullish Engulfing Pattern has been spotted on a 15-minute chart. The overall trend is looking bullish after a reversal took place.

#SuakuFlowsWatchlist - 6/28#SuakuFlowsWatchlist
Expiry: 1/7
$AAL 14C > 13.96 | 13P < 13.38
$ABNB 105C > 104.17 | 99P < 99.33
$BA 141C > 140.57 | 136P < 136.22
$BAC 33C > 32.60 | 31.5P < 31.91
Lots of other inside days but these are the 4 that I'll be focusing on tonight 🌊

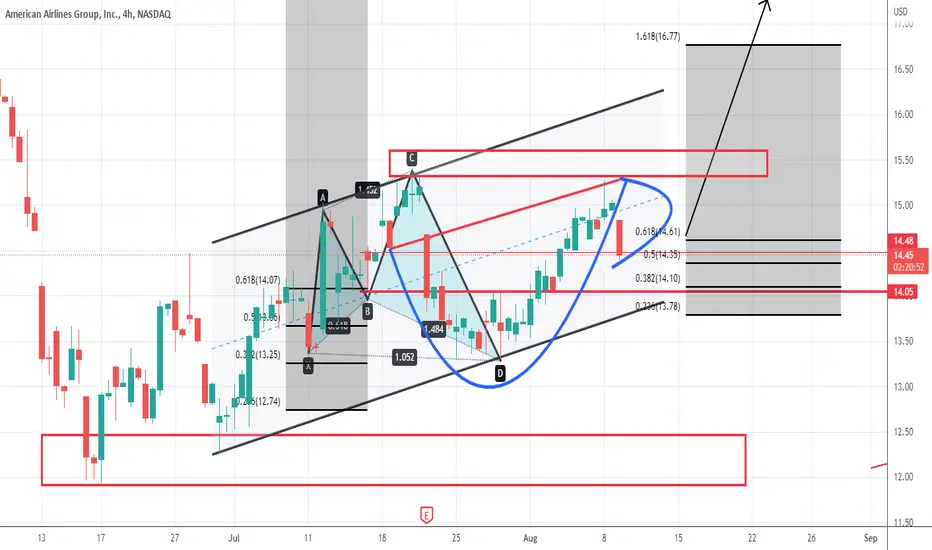
AAL - 3 Long scenarios - Fly little bird, fly 3 Long scenarios
Fundamentals
-
General
One scenario developing doenst invalidate the other. Would trade one after another if it should happen - or all at the same time.
Scenario 1 (Green arrow)
Target
Next resistance level (level 1).
Confluence with the 50% level of a monthly range.
Requirements
- Price closes above buy zone 1
Invalidation / SL
- No break under buy zone 1 AND creating lower swings
Time duration
Days, weeks, months, years... ;)
Scenario 2 (Orange arrow)
Target
Next resistance level (level 1).
Confluence with the 50% level of a monthly range.
Requirements
- Price dto buy zone 2
Invalidation / SL
- None, this is a possible longterm hold
Time duration
Days, weeks, months, years... ;)
Scenario 3 (Blue arrow)
Target
Next big resistance level
Requirements
- Break above level 1
Invalidation / SL
- None, this is a possible longterm hold
Time duration
Days, weeks, months, years... ;)
Good luck
