Archer Daniels Midland (ADM) - Investment Outlook for 2025
Comprehensive Analysis & Valuation of Archer Daniels Midland (ADM) - Investment Outlook for 2025
Archer Daniels Midland (ADM), one of the world’s leading agribusiness companies, presents an attractive opportunity for value and income-focused investors, particularly in today’s uncertain macroeconomic and geopolitical environment. Operating in the processing and distribution of grains, oils, biofuels, and animal feed, ADM is a defensive stock with cyclical characteristics. This article provides a detailed fundamental analysis, incorporating financial metrics, strategic developments, and a valuation based on four macroeconomic scenarios (War, Growth/ESG, Stagnation, Recession). We also include a Monte Carlo simulation, sensitivity analysis, and a peer comparison to offer a holistic investment perspective.
📌 Company Overview & Key Financials
Sector: Agribusiness (grain/oilseed processing, biofuels, animal nutrition).
Market Cap: ~$31-32 billion (June 2025, share price ~$52).
Revenue: $85.5 billion (stable, reflecting resilience).
Net Income: $1.8 billion (2024, down 59% from $3.48 billion in 2023).
Free Cash Flow (FCF): ~$2.5 billion, down ~40% from 2023.
FCF Yield: 1.25% (weak cash generation).
Net Debt: ~$9.5 billion, with Interest Expense of $647 million (increased borrowing costs).
Interest Coverage Ratio: 3.49 (down from 10.8 in 2023, under pressure).
Inventory: ~$20.5 billion (~1/3 of assets), Inventory Turnover: ~6x (~60 days, up from ~37 days in 2023, indicating slower turnover).
Return of Capital:
Dividend Yield: 3.96% (payout ratio ~49.5%, safe).
Share Buybacks: Limited in 2024, stable share count (~550 million shares).
Key Ratios:
P/E: 14.25 (moderate-low).
P/B: 1.12 (attractive).
P/S: 0.29 (very undervalued).
PEGY: 6.81 (expensive based on growth).
ROE: 8%, ROA: 7%, ROIC: 3.4% (< WACC 9%, low capital efficiency).
ESG/Innovation: Investments in biofuels, plant-based proteins, automation (partnerships with Cargill, LG Chem, Solugen).
FOREX Exposure: ~45% of revenue from outside the U.S. (Brazil, Asia, Europe), pressured by a strong USD.
Workplace Incidents: Minor incidents in silos (2023), manageable legal/regulatory risk.
Strategic Partnerships: Collaborations with Nestlé, PepsiCo, Cargill (sustainable oils), LG Chem (bio-plastics), Solugen (biotech).
📈 DCF Valuation (4-Year Horizon)
Using a Discounted Cash Flow (DCF) model with a 4-year horizon, we estimate ADM’s intrinsic value under four macroeconomic scenarios. Assumptions include:
FCF Year 0: $2.5 billion.
WACC: 9%.
Terminal Growth Rate: 2%.
Net Debt: $9.5 billion.
Shares Outstanding: ~550 million.
1. War/Geopolitical Instability (+6% FCF CAGR)
Description: Escalating conflicts (e.g., Iran-Israel, ongoing Ukraine) drive up commodity prices (grains, oils). ADM’s large inventory ($20.5 billion) becomes a strategic asset, boosting margins. Logistics/fuel costs rise but are offset by higher prices.
Enterprise Value (EV): $54.7 billion.
Equity Value (EV - Net Debt): $45.2 billion.
Share Price: $82-85 (+58-63% from $52).
Key Drivers:
Improved margins from commodity price spikes.
Inventory turnover improves to ~7x.
Minor FOREX pressure from strong USD.
2. Growth/ESG (+3.5% FCF CAGR)
Description: Economic recovery and rising demand for plant-based products/biofuels. Strategic partnerships (Cargill, LG Chem) enhance revenue, with ESG-driven innovation (automation, carbon-neutral practices) supporting growth.
EV: $48.3 billion.
Equity Value: $38.8 billion.
Share Price: $70-72 (+35-38% from $52).
Key Drivers:
Moderate FCF growth from technology investments.
Stable inventory turnover (~6x).
Potential FOREX tailwind if USD weakens.
3. Stagnation (0% FCF CAGR)
Description: Stable economy with no significant growth or crises. High inventories tie up capital, and limited share buybacks maintain stable share count. Dividend remains steady.
EV: $42.1 billion.
Equity Value: $32.6 billion.
Share Price: $58-60 (+12-15% from $52).
Key Drivers:
Flat FCF, pressured by borrowing costs ($647 million interest expense).
Inventory turnover remains low (~6x).
Moderate FOREX headwinds from strong USD.
4. Recession (-3% FCF CAGR)
Description: Global recession reduces demand for food/biofuels. FOREX pressures (strong USD) and potential inventory write-downs hurt profitability. Debt levels may rise.
EV: $36.9 billion.
Equity Value: $27.4 billion.
Share Price: $48-50 (-4-8% from $52).
Key Drivers:
Declining FCF, possible suspension of buybacks.
Inventory turnover drops (~5x).
Significant FOREX pressure.
📊 Sensitivity Analysis
The table below shows how the share price varies with changes in FCF Growth and WACC:
FCF CAGR / WACC 7% 9% 11%
+6% $90.50 $85.00 $80.00
+3.5% $75.80 $71.00 $66.50
0% $63.00 $59.00 $55.50
-3% $53.20 $49.00 $45.50
Observations:
Higher WACC (11%) significantly reduces valuation in weaker scenarios.
Strong FCF growth (6%) supports substantial upside in the War scenario.
🎲 Monte Carlo Simulation
A Monte Carlo Simulation (10,000 iterations) was performed to estimate the share price distribution, using:
FCF Growth: Normal distribution, mean 1.5%, standard deviation 3%.
WACC: Normal distribution, mean 9%, standard deviation 1%.
Terminal Growth: Normal distribution, mean 2%, standard deviation 0.5%.
Results:
Mean Share Price: ~$65.
95% Confidence Interval: $48 - $85.
Scenario Probabilities:
War/Geopolitical Instability ($82-85): ~25%.
Growth/ESG ($70-72): ~35%.
Stagnation ($58-60): ~25%.
Recession ($48-50): ~15%.
📊 Chart: Share Price Estimates
The following bar chart visualizes the estimated share prices across the four scenarios:
Grok can make mistakes. Always check original sources.
Download
🆚 Peer Comparison
ADM is compared to key competitors: Bunge (public), Cargill (private, limited data), and Louis Dreyfus (private):
Metric ADM Bunge Cargill (Est.) Louis Dreyfus (Est.)
P/E 14.25 11.50 - -
P/B 1.12 1.35 - -
P/S 0.29 0.33 ~0.4 ~0.35
Dividend Yield 3.96% 3.20% - -
ROIC 3.4% 6.8% ~5% ~4%
Debt/Equity 0.4 0.5 ~0.6 ~0.5
Inventory Turnover 6x 7x ~6.5x ~6x
Key Takeaways:
ADM offers a lower P/E and P/S, making it more attractive for value investors.
Bunge has higher ROIC but a less compelling dividend yield.
Cargill/Louis Dreyfus: Limited transparency, but similar commodity/FOREX exposure.
🌟 SWOT Analysis
✅ Strengths:
Defensive sector (food), resilient in crises.
Attractive dividend (3.96% yield).
Undervalued metrics (P/B 1.12, P/S 0.29).
Strategic partnerships (Cargill, LG Chem, Nestlé).
Large inventories provide a buffer in geopolitical crises.
❌ Weaknesses:
Sharp decline in net income (-59%) and FCF (-40%).
Low ROIC (3.4%) below WACC (9%).
High inventories (~60 days) tie up capital.
Rising borrowing costs ($647 million interest expense).
🌟 Opportunities:
Geopolitical instability boosts commodity prices, leveraging inventories.
ESG/biofuel trends drive long-term growth (partnerships in sustainable oils, bio-plastics).
EPS recovery in a growth environment ($70-75 potential).
⚠️ Threats:
Recession reduces demand, risking inventory write-downs.
FOREX headwinds from strong USD (~45% of revenue from abroad).
Workplace incidents/regulatory risks (minor but present).
🧠 Investment Conclusion
Current Price ($52): Undervalued for value investors, with a strong dividend (3.96%) for income investors.
Upside Potential:
War/Geopolitical Instability: $82-85 (+58-63%) – Best-case scenario due to commodity price spikes.
Growth/ESG: $70-72 (+35-38%) – Balanced scenario driven by innovation/partnerships.
Downside Risk:
Stagnation: $58-60 (+12-15%) – Limited upside due to high inventories.
Recession: $48-50 (-4-8%) – Moderate risk given defensive nature.
Investment Appeal:
Value Investors: Attractive due to low P/B (1.12) and P/S (0.29).
Income Investors: Ideal for stable dividend income.
Growth Investors: Less appealing due to low FCF Yield (1.25%) and high PEGY (6.81).
Key Catalysts:
Rising commodity prices from geopolitical tensions.
ESG-driven growth via partnerships and innovation.
Key Risks:
Recession-driven demand decline and inventory write-downs.
FOREX pressures from a strong USD.
🔍 What to Monitor
Commodity Prices: Critical for margins (grains, oils).
Geopolitical Risks: Conflicts (Middle East, Ukraine) favor ADM’s inventory strategy.
Inventory Turnover: A drop below 5x signals liquidity pressure.
FOREX: USD movements vs. BRL, EUR, CNY impact ~45% of revenue.
ESG Progress: New partnerships or investments in biofuels/sustainability.
Debt & Interest Rates: Rising rates could further strain interest coverage.
ADM trade ideas
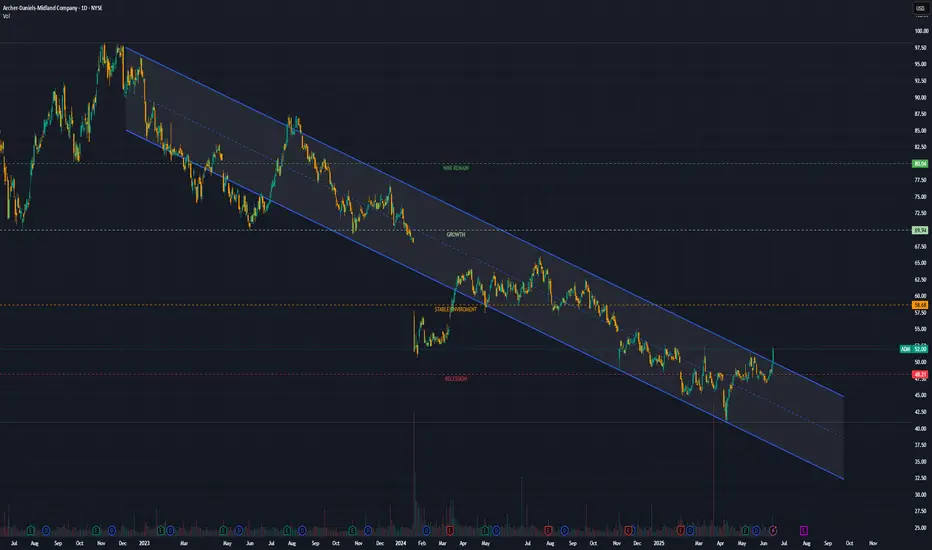
ADM 1D: 10-Month Channel Says Goodbye?Since July 18, 2024, ADM had been locked in a clean downward channel — well-behaved, well-respected. But in May 2025, the structure finally cracked: price broke out, crossed above the 50-day MA, and pulled back for a textbook retest right on the channel’s upper edge. So far, the breakout is holding. The next targets sit at 50.6 (0.618), 53.5 (0.5), and 56.5 (0.382). As long as price stays outside the channel, the bullish structure remains intact.
Connor’s RSI down below is quietly doing its job — already bounced from deep oversold, now curling up with momentum. It’s not flashy, but in this context it signals early strength before the crowd notices.
Fundamentally, ADM is still cleaning up after the early-2024 accounting scandal that nuked investor trust. But management moved fast: reinstated buybacks, tightened guidance, and Q1 2025 came in strong — $22.6B revenue, $0.88 EPS, both beating expectations. ADM remains a pillar of the U.S. ag sector, and in an era of global food anxiety, that means structural demand isn’t going anywhere.
Вот адаптированный перевод финального блока под **английский пост**, в том же живом и профессиональном стиле:
Enjoyed the idea? Like, share, and drop your thoughts in the comments.
It helps keep the content visible, free, and accessible to everyone.
Got your own charts or takes? Let’s discuss them below.

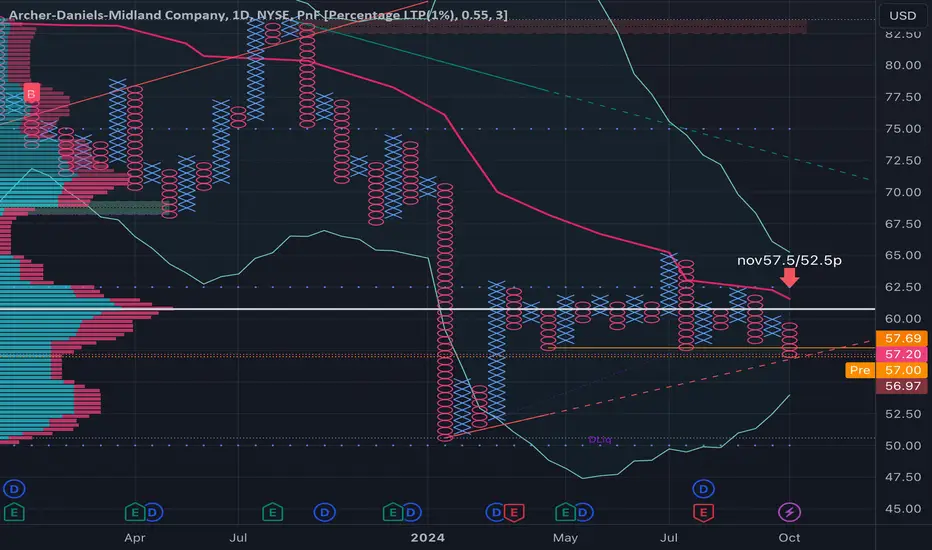
ADM | Inverse Head & Shoulders + Parallel Channel = Reversal📍 Ticker: NYSE:ADM (Archer-Daniels-Midland Company)
📆 Timeframe: 1D (Daily)
📉 Price: $48.74
📊 Volume: 2.82M
📈 RSI: 54.80 (Momentum building)
🔍 Technical Setup:
NYSE:ADM is completing a textbook Inverse Head & Shoulders at the bottom of a rising channel, hinting at a structural reversal.
🟢 Green arrow signals current buying opportunity
🔺 Red arrows highlight expected resistance zones on the way up
🟣 Channel provides a clean roadmap for a stair-step recovery structure
Pattern Highlights:
Well-defined L–H–R shoulders
Price reclaiming the midline of the channel
RSI recovering above 50, signaling shift in momentum
🧠 Trade Plan & Price Targets:
✅ Entry Range: $48.50–$49.00
❌ Stop-Loss: Close below $46.00 (invalidation of channel + pattern)
🎯 Target 1: $52.50
→ 📈 Return: +7.7%
🎯 Target 2: $56.50
→ 📈 Return: +15.9%
🎯 Target 3: $63.00
→ 📈 Return: +29.3%
⚠️ Technical Notes:
Pattern is visible across multiple timeframes — weekly structure aligns with daily bullish reversal
RSI breakout + neckline test = potential breakout confirmation
Earnings volatility in rear-view mirror – momentum favored near-term
💬 Is ADM finally turning the corner after months of weakness?
📌 Like & Follow for more structured swing setups!
#TargetTraders #ADM #HeadAndShoulders #ChannelBreakout #SwingTrade #InverseHnS #TechnicalSetup

ADM Closing In!!ADM is closing in on $37.xx. This is my buy zone. With a long term up trend and a break out 4 years ago. Price pulling back to pre covid levels is a huge opportunity. This is Longterm trade hoping to get a tp target as it approaches the resistance trend line. Stay patient for $37 levels sit back and collect the dividend


ADM dropping into the buy zone!ADM is a long standing Fortune 500 company and been around since 1902. ADM has been a back bone company in Americas young history. Although RFK is coming for the seed oils, ADM is and will always will be a big dog in American agriculture. Also important to add that commodity prices have collapsed the last year and there aren't many signs of that changing yet. (A massive drought would reset the market.)
Hedge funds such as BlackRock, State Street and Geode Capital Management all have massive investment in ADM, amounting to a combined $4,191,840,000.
I believe that a lot of American agriculture will continue to be subsidies by the US government and the processing of oilseeds and grains will always be a part of America. I think this could be a value investment as we creep into the zone noted on the chart.
I like to apply the strategy of setting up weekly buys on investments such as this. It helps DCA your overall investment.

$ADM for a 25%+ profitRSI is in the buy zone. PE and PB are in a beautiful buy range too. Sell at the red line.

ADM to $50My trading plan is very simple.
I buy or sell when price tags the top or bottom of parallel channels.
I confirm when price hits Fibonacci levels.
So...
Here's why I'm picking this symbol to do the thing.
Price in channel zones at bottom of channels (period 100 52 & 26)
Stochastic Momentum Index (SMI) at oversold level
VBSM is spiked negative and under bottom of Bollinger Band
Entry at $45.39
Target is $50 or channel top

ADM ...Archer-Daniels-Midland big boy in foodsSo the TSLA graph I just posted a bit ago doesn't flow like this one does in regards to cash flow and stock movements.
It follows pretty well and gives you a good idea that agriculture is the place to be in coming months/year max. There is an idea that follows:
You don't support those who actually make energy convertible into food- which fuels innovation...then all goes down. AI won't create farms...Electric tractors aren't even close to anything fantasy...and local operations in every state are going down.
Find you local grower if possible and support them and get to know them...they will be shutdown by your neighbors when agri-prices explode and don't blame their Iphone purchases or over-leveraging in credit card debt...it's the dude with a shovel and a few cows or goats. Don't be dumb and put money where there is none...cause when societies collapse and stocks go down, govt must give money to the Tyson/ADM/Purdue/Conagra/General Mills of the world.
Be smart and know there is more downside...then hop on if you think food matters. You can't eat gold or silver...but you will be first in line to get food from the dudes who actually have it and can create it..

ADM Lower?Might take forever, but its coming down to the box at some point. Will load up huge in the box.

BearishPrice oscillator just crossed below zero due to poor earnings. Time to go short. Buy weekly ATM put.
This is a trade journal. Do your own analysis.

BearishPrice oscillator just crossed below zero due to poor earnings. Time to go short. Buy weekly ATM put.
This is a trade journal. Do your own analysis.

$ADMGreen: Entry Point
Blue: Start of Week
Red: End of Week
Thumbs Up: Trade Available for Week
Numbers: Price Targets
*For share traders only. Not meant for options.

ADM Needs Help, So I Am Short!That right, ADM is setting up nicely for a short pullback trade. Looking for price to break just below today's candle 10/29 for an entry.

Great Entry into ADMADM has a great entry setup I give stop loss 10% which fits with the support level and a clear breakout target on the right shoulder in the $70 range which should potentially yield a quick trip back through the levels if a bullish movement is reached resulting in a great long term hold.

ADM still being sold. Looks good at $63 and better at $67.Really love what this company does, you already know this is a staple stock, but we need to break this channel and I'd take a small position at $63 and add on at $67.
Other than that, keep it on watch.
Also look at key level around $68

Target 68.25Following weekly chart.
Got a long signal from indicator.
TP1 64.09
TP2 68.25
SL - Close under 58.95 candle close.


Archer Daniels Midland (ADM) Rises as Accounting Probe ConcludesArcher Daniels Midland Co. ( NYSE:ADM ), the agricultural powerhouse based in Chicago, saw a surge in its stock price after announcing the completion of an internal investigation into accounting irregularities within its nutrition business. While this development removed a significant overhang on the stock, ADM faces challenges as its fourth-quarter earnings fell short of expectations. Despite this setback, the company's upbeat guidance for 2024 and additional share buyback authorization offer a glimmer of hope amidst uncertainty.
Resolution of Accounting Probe:
ADM's stock rose by 3.95% following the announcement that the internal investigation into accounting practices at its nutrition segment has been substantially completed. The company assured investors that the adjustments required as a result of the probe would not have a material impact on its overall financial statements. This resolution alleviates concerns stemming from a voluntary document request by the Securities and Exchange Commission (SEC) and restores confidence in NYSE:ADM 's governance and transparency.
Earnings Disappointment:
However, despite the positive news regarding the accounting probe, NYSE:ADM 's fourth-quarter earnings fell short of analyst estimates. Net income for the quarter stood at $565 million, down from $1.019 billion in the previous year. Adjusted earnings per share came in at $1.36, below the FactSet consensus of $1.43. Additionally, revenue declined to $22.978 billion, missing expectations of $23.786 billion. These disappointing figures underscore the challenges facing ADM amidst shifting market dynamics and operational headwinds.
Optimistic Guidance and Share Buyback Authorization:
Despite the earnings miss, NYSE:ADM provided upbeat guidance for 2024, expecting adjusted earnings per share in the range of $5.25 to $6.25. The company's board also approved an additional $2 billion for its share buyback program, signaling confidence in its long-term prospects. However, FactSet's expectation of $5.41 falls within the lower end of ADM's guidance range, indicating lingering uncertainties about the company's performance.
Looking Ahead:
As NYSE:ADM navigates through the aftermath of the accounting probe and works towards remediation, investor sentiment remains mixed. While the resolution of the probe removes a significant cloud over the stock, concerns about earnings performance persist. The company's ability to execute its remediation plan effectively, improve financial transparency, and capitalize on growth opportunities will be critical in restoring investor confidence and driving long-term shareholder value.

ADM: Bullish Harami on the Weekly at a Bullish Gartley HOP LevelArcher-Daniels-Midland is sitting at the HOP level of a Bullish Gartley aligning with support with a Bullish Harami Visible on the Weekly Timeframe after setting record-breaking weekly volume into the test of the Support Zone.
ADM will close and confirm the Weekly Harami in less than an hour and from there we would expect to see ADM make an effort to fill the weekly gap above, perhaps going all the way up to the 61.8% retracement.

ADM is oversold!Start accumulating daily/weekly!
I plan to trade ADM the exact same way as I traded Pfizer stock a month ago. I drop a link below.

ADM - Long Dear traders,
ADM is too oversold, lets find entry orders at least with a target to fill the gap around 70,
The general trend is bullish and it already touched the previous level of resistance, which is a good level for thinking in open a buying position.
best of trading,
