AMC: Sell idea on 15 minutesSell idea on AMC because we have the breakout with force the support line by a big red candle with a large red volume.Thanks!
AMC trade ideas

AMC 01032023 long IdeaAMC Going long Idea
AMC bounced well from weekly support are and got some social media negative and expected to retest new support area on daily time frame which can be a good entry point. Below is trade plan
EP: 6.49
SL: 4.34
TP: 9.87
RRR:1.58

Inverse Head and Shoulders Pattern. Bullish Prediction for $AMCWhy I am bullish?:
Clear inverse head and shoulders pattern with a decisive close above the neckline on the daily chart. I am looking for a return back to the neckline to potentially add to a new long position.
Volume is about as perfect as can be with light volume around the head and strong volume on the rally up to the neckline from the right shoulder.

$AMC $8 squeeze imcoming! HSBAF$4 support has been taken out.
currently at $5
LEVEL 1 resistance @ $5.33 (fill gap from 02.01.23)
LEVEL 2 resistance @6.80-6.90 (take out YTD highs from 02.06.23)
TP @ 8.50 for strike (12.01.23 highs )
EXP 4/21/23. As soon as we get over $8.50 or even above the $7.75 range more volume will push this stock higher.
AS LONG AS WE DO NOT RETRACE UNDER $4.50 I HAVE FAITH THIS WILL TAKE PROFIT.

AMC putFirst, I'm not bullish on $AMC, but IV is 200%+, I SOLD April 21 $5 put for $0.85 premium.
With a potential court outcome in April, $AMC won't drop below $5, IMO.
As long as it stays above $5, I get the full premium.
Let's see what happens.

AMCToo some it’s a laser light show. I see the lasers as points of interest. Idk the full understanding of these tools. But I’ve learned how to use them pretty well

$8 AMC This WeeK?If you know me well, you know I HATE trendlines but the bull flag on the hourly is looking quite nice. Look for a retest around $6.00-$$6.05 for buy positions. Looks like we started around $4.50 to get us to $6.70. If the lower end of the bull flag is $5.70 then we should be able to hit $7.70+ easily either after earnings or in the following days/weeks.

AMC 2DAMOOOOOONNNAMC Breakout confirmed!!!!! We are only up from here!
$80 first take profits!!!!
After moon bag to $1000
DONT SELL EARLY@@@!!!!!!
Noyt Finacianl Advice!!!!!!!!111!!!

THE PUMP SHALL COMMENCE! AMC Theatres, your time is now.I think we are going to get a heck of a short squeeze here and we are breaking up out of a long term down slopping resistance. Not financial advice, DYOR.

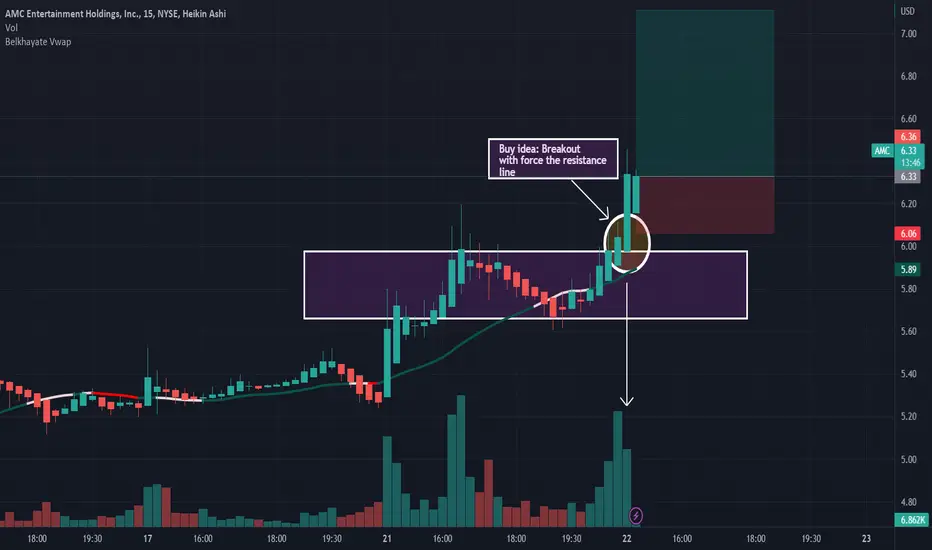
AMC: Buy idea;Example On AMC we have a buy idea because we have the breakout with force the resistance line by a big green candle with a large green volume as you see on the chart.Thanks!

SUS... DAYS BEFORE... 2 YEAR ANNIVERSARYStupid candles like this don't just happen, It at the very least should have been fixed yesterday. This seems like some kind of hidden message. Obviously this would only happen in a meme stock, just days before an interesting 2 year since the initial squeeze highs...idk...conspiracy theorists have been proven right after being clowned these past few years. Keep your eyes and ears open.

AMC Can Go Any Day NowPrice is at the literal bottom, i doubt support will break. I can feel something brewing. Must watch closely. get your popcorn ready.

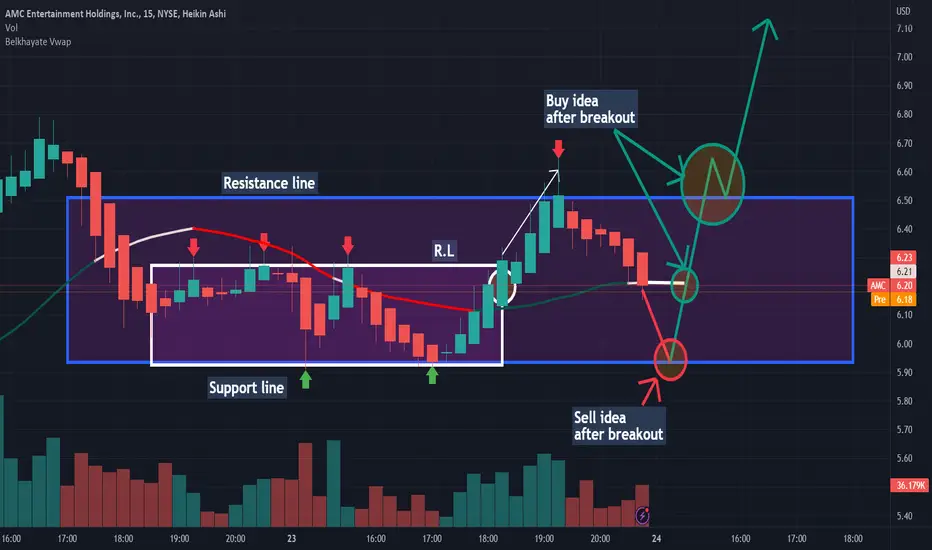
AMC: AnalysisOn AMC today you can see our analysis on the chart. We will have a big probability to have an uptrend after the breakout with force the vwap and the resistance line by a big green candle with a large green volume. But, in other hand, we could have a downtrend if only if we have the breakout with force the vwap and the support line by a big red candle with a large red volume.Thanks!

$GME - Here we go | Starting tomorrow or on March 6 ish. The chart above is a composite chart of: AMC, GME, COIN, HOOD, CHPT, F, LUMN, GRAB, FINV, CHPT. 3 of these are in the XRT ETF but that doesn't matter too much. This basket is the "meme" basket and it's general use as i understand is as a source of liquidity since most of the stocks inside it are illiquid like GME, LUMN and maybe a few others. I don't think AMC is illiquid, it's in fact highly traded in the swaps world as a single name stock. GME has had 1/20'th of AMC's trading volume in swapps in 2022. In 2021 they were close-ish but that changed in November/December 2021.
My preferred way of seeing the composite meme basket it in Tradingview is to copy and paste this in my Symbols/Ticker List:
AMC+CHPT+COIN-DT+F-FINV+GME+GRAB+HOOD+LUMN
This is the best variation of the basket i've managed to make in my own opinion/world. You could simply just remove the minus symbols and make everything a + if you like and that generates a really nice liquidity rich looking chart that's also quite linear and good for selling spreads which is exactly what's been happening. I've found out that for this basket, in the last quarter, around $168 mil worth of spread swaps were sold. The date of effect or expiry ( i don't remember which) was Dec 7 this year which now explains the subsequent price drop in not just GME but this whole entire basket.
About GME and what might occur next week onwards:
Data on GME has turned bullish:
imgur.com
Data on SPY is turning bullish too:
imgur.com
I believe SPY is going to retrace back to $405 within the next 15 days and with that obviously all other stocks are going to follow this oscilation and move up appropriately. This includes meme stonks just like the one we love to hate and hate to love GME.
Since i found the actual basket and was able to take my time to check it out and simplify what i see, basically i think i have the precise days of the price runs up. Since it's really close, i can tell with a lot of certainty now... It's going to start this week and will continue up to the 3'rd - 6'th of Jan (Max 9'th of Jan).
Me giving you this info isn't great as everyone i let people know the dates, everyone buys the heck out of this thing, brokers are forced to go short a share they're selling you and the price plummets, the borrow rate skyrockets and the "wen moon" date gets extended to a later date.
Seeing that people have already gone nuts on GME since Dec 23 and have forced the borrow rate up again, considering that most broker based retail traders including myself have been burned by holding short dated options and have sold them off last week, the price should start to rise back and above it's previous levels before the insane buying started.
Now if people go nuts again this could result in another muted run where people know where to buy and where to go short resulting in a very muted and quick GME run. Unfortunately there are no longer enough people that are willing to buy enough GME options for a Gamma Squeeze, that's completely out of the question and people buying 40 share lots instead of even 100 share lots aren't helping since they getting bought and grouped up by a wholesaler and lent out to others intra-day before finding other to sell their inventory to and not to mention the pennies retail is getting scalped on due to the wholesaler grouping the various orders and selling spread/lending/selling/buying at better or wider prices.
Anyway, point is, i think things happen next week. If the blue line i circled in the first pic i posted here continues to move up parabolically, we're golden and i'll know when this happens on Tuesday EOD which may already be late as i think things will start from that day, but ok... it might at least serve as some kind of confirmation.
Anyway, don't get to gree buying both shares and options... who am i kidding, do your thing. I have 438 calls $25c for next week so. Hoping to be a millionare so i can quit it all. Good luck and regards you highly regarded folk you.
Basic Analysis:
-I'm not going to add details in order to keep this simple for people. To that, i've simply drawn 3 date counting lines showing 3 x 140 day periods inside the RSI at the bottom of the chart. If for some reason you are unable to see these lines, please resize the RSI chart.
Basically, the cycles seem to be ~140 day long instead of 90 day or 60 day or 120 days as many other have tried theorizing including myself. At least that's the theory here unless i'm wrong, again.
It looks like a prerequisite for a GME/meme basket run is that the RSI has to be oversold or generally harshly treated near the weak or oversold area. As i said, not to go into details about other microcycles, i'll just be talking about the big cycles...
Now each time the RSI bottoms out on the chart above for the composite basket, 60 days later GME begins it's ~1w price run which is then followed by a market correction.
So, the next big GME price run either starts tomorrow onwards till Jan 3-9
Or it starts on March 6.
What cannot go wrong is buying at these levels since the entire basket's RSI is completely bottomed out and has spent it's time not only in RSI prison (weak spot) but also within the oversold area. Without the rest of the market moving down, it would be difficult to move the price of GME lower. At best it can be kept sideways, but that takes effort as well. The easiest thing for all sides is for the price to simply move up along with the rest of the market.
So yes. Either tomorrow for the next 10 days or in March on the 6'th ish.
You're definitely a highly regarded person if you've read this far down. Let me know down in the comments if you feel highly regarded.
Thanks

AMC AnalysisPrice exactly as analyzed last week. Price has mitigated the bearish POI at 7.33. I'm expecting price to continue higher, unless we see a confirmation to go lower on the lower timeframe. Currently, I see price breaking market structure to the downside on the lower timeframe. However, volume is decreasing on the break, signifying that price could still continue higher.

AMC: Buy ideaOn AMC we have a buy idea because we have the breakout with force the resistance line by a big green candle with a large green volume! Thanks:
Looks well for a 121%Well, i dont know if the reverse split going to affect, but we are watching very interesting activity here, and a potential symmetrical triangle formation, pointing 120% to the upside.

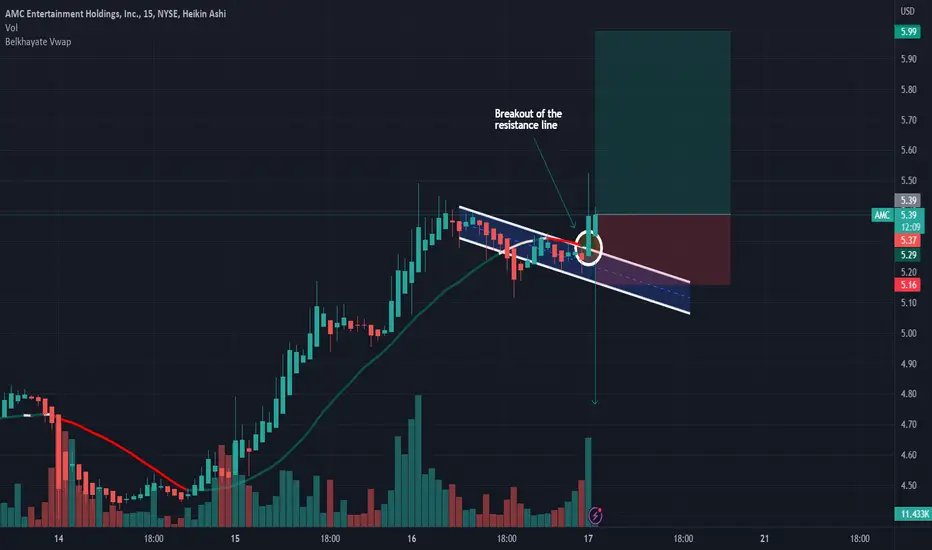
AMC: Buy ideaBuy idea on AMC because we have the breakout with force the vwap by the buyers.! Thanks!

AMC 6 month downtrend breaking soon? 🐒🥵boost and follow for more! 💙 clearly AMC is in a bearish downtrend, but with penny stocks flying left and right I think this can breakout any day!
watching for break of trend resistance/7.66, after that we should see a rally to 9.79-11.40-14.61 🎯 good luck


AMC AnalysisPrice played out nicely as analyzed last week. Price bounced off the bullish POI at 4.39 to the dot. As we have confirmation on the lower timeframe to go higher, I'm expecting price to continue rallying into the bearish POI at 6.05 next.
