AMD Advanced Micro Devices Price TargetAdvanced Micro Devices (AMD) has positioned itself as a major player in the semiconductor industry, capitalizing on growing demand for high-performance computing, artificial intelligence (AI), and data center solutions. As of now, AMD’s forward price-to-earnings (P/E) ratio stands at 17.12, indicating that the stock is trading at a reasonable valuation compared to its growth potential.
AMD has benefited from the increasing adoption of AI-driven solutions, particularly through its MI300 series of AI accelerators, which have gained traction among major cloud service providers. The company’s expansion into the data center market has also been a key growth driver, with strong sales in EPYC processors contributing to revenue growth.
Furthermore, AMD's strategic acquisition of Xilinx has strengthened its position in the FPGA (Field-Programmable Gate Array) market, enhancing its ability to offer diversified and high-margin products. This, combined with improving margins and consistent product innovation, positions AMD for steady financial performance in the coming quarters.
Given AMD’s solid fundamentals, growing market share in AI and data centers, and attractive valuation at a 17.12 forward P/E, a price target of $125 by the end of the year appears achievable. This would represent approximately 15% upside from current levels, driven by continued revenue growth and expanding profit margins.
AMD trade ideas

Rounding Bottom Pattern waiting for Breakout and RetestIf this plays out it will be about a 20 point play as I have the target price measured to be
$135.36.
Wait for cross above and retest of the resistance line ($115.01) then enter. Stop at $109.35.
Keep an eye on CCI and if line falls below the zero line the trade becomes invalid and exit
immediately.
I like the April 25 $115 strike options @ $3.15
R

Classic BreakoutAMD has broken out of a long downtrend, I believe there's a good opportunity for entry on the retest for a lower risk long. NFA, this is my personal strategy.
On a fundamental level, AMD appears to have had a very successful GPU and 9950X3D launch gaining marketshare from nvidia and intel respectively

Advanced Micro Might Have Hit a WallAdvanced Micro Devices has bounced sharply this month, but now the semiconductor stock may have hit a wall.
The first pattern on today’s chart is $116.04, the weekly close from January 10. AMD stalled at that level on February 20 and seems to be halting there again in late March. Has old resistance become new support?
Second, the 50-day simple moving average (SMA) is under the 100-day SMA. Both are below the 200-day SMA. That sequence, with faster SMAs under slower SMAs, is potentially consistent with a downtrend.
Third, stochastics have rebounded to an overbought condition.
Finally, AMD is one of the top underliers in the options market. (It averages more than 300,000 contracts per day, according to TradeStation data.) That could make it easier to position for moves with calls and puts.
TradeStation has, for decades, advanced the trading industry, providing access to stocks, options and futures. If you're born to trade, we could be for you. See our Overview for more.
Past performance, whether actual or indicated by historical tests of strategies, is no guarantee of future performance or success. There is a possibility that you may sustain a loss equal to or greater than your entire investment regardless of which asset class you trade (equities, options or futures); therefore, you should not invest or risk money that you cannot afford to lose. Online trading is not suitable for all investors. View the document titled Characteristics and Risks of Standardized Options at www.TradeStation.com . Before trading any asset class, customers must read the relevant risk disclosure statements on www.TradeStation.com . System access and trade placement and execution may be delayed or fail due to market volatility and volume, quote delays, system and software errors, Internet traffic, outages and other factors.
Securities and futures trading is offered to self-directed customers by TradeStation Securities, Inc., a broker-dealer registered with the Securities and Exchange Commission and a futures commission merchant licensed with the Commodity Futures Trading Commission). TradeStation Securities is a member of the Financial Industry Regulatory Authority, the National Futures Association, and a number of exchanges.
Options trading is not suitable for all investors. Your TradeStation Securities’ account application to trade options will be considered and approved or disapproved based on all relevant factors, including your trading experience. See www.TradeStation.com . Visit www.TradeStation.com for full details on the costs and fees associated with options.
Margin trading involves risks, and it is important that you fully understand those risks before trading on margin. The Margin Disclosure Statement outlines many of those risks, including that you can lose more funds than you deposit in your margin account; your brokerage firm can force the sale of securities in your account; your brokerage firm can sell your securities without contacting you; and you are not entitled to an extension of time on a margin call. Review the Margin Disclosure Statement at www.TradeStation.com .
TradeStation Securities, Inc. and TradeStation Technologies, Inc. are each wholly owned subsidiaries of TradeStation Group, Inc., both operating, and providing products and services, under the TradeStation brand and trademark. When applying for, or purchasing, accounts, subscriptions, products and services, it is important that you know which company you will be dealing with. Visit www.TradeStation.com for further important information explaining what this means.

AMD Potential Long. 85% Win Rate. Using the above chart as a Macro indicator you can see that the time to buy AMD has arrived.
Each time the RSI moves to an oversold position in the 3 week we often see great returns. The exception being 2008 where the period was much longer than usual.
Yesterday I finished back testing AMD from 1972 to 2025. I came out with a 85% win rate over those years. I did not use the chart above either as it would have created an unfair bias for my normal trading strategy and rules. 1994-1995ish was the first bad trade and another stumbling block was 2008-2009. As it was very drawn out and stop losses were triggered.
Using the 85% Win Rate strategy and using the above chart shows us the following:
RSI: Tickled the oversold zone. I am sceptical of this as I do not think the move will be a massive one as it barely touched the zone but in previous years we will still see a 30-40% move in similar cases.
Phoenix Bollinger Bands: This indicates that price is where its suppose to be. On lower timeframes it also shows that price does have the potential to expand to 130-140 range.
Strategy: The strategy that I use is indicating that the 2 week buy signal is 2 days away from confirming.
I have the following things to do:
1) Update tomorrow if Buy Signal is confirmed. If was more aggressive I would be buying today but because its only a 85% win rate and not 90%+ like the others I will wait.
2) Regardless if price goes down from here or not. I will start to build a position from tomorrow.
Sorry that I did not post all the charts etc in this one today. I am just a bit busy with my own trades and thought I would try get this out ASAP.
Have a blessed day and Stay Adaptable.

AMD - Monthly - Long Term ContenderClick Here🖱️ and scroll down👇 for the technicals, and more behind this analysis!!!
________________________________________________________
________________________________________________________
..........✋NFA👍..........
📈Technical/Fundamental/Target Standpoint⬅️
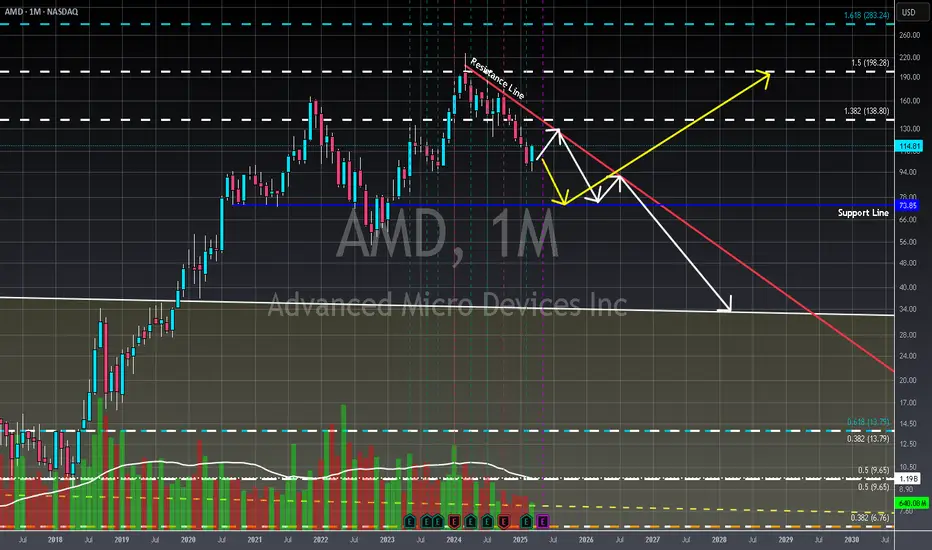
1.) AMD's strategic execution and innovative product portfolio have fueled a truly remarkable resurgence, directly challenging Intel's long-held dominance. Despite lingering skepticism, their competitive position is undeniable, marking one of the most compelling comebacks in the tech industry.
2.) AMD's 2024 financial performance demonstrates robust momentum, with consistent year-over-year growth in both revenue and net income, signaling strong market demand and effective operational management.
3.) In 2024, AMD significantly fortified its financial foundation by strategically reducing overall debt, achieving a doubling of its 2023 cash flow, and maintaining healthy cash reserves, indicating improved financial stability and flexibility.
4.) While AMD's current stock price reflects its strong performance, and is arguably justified, retail investors naturally seek more attractive entry points, highlighting the inherent tension between market valuation and individual investment strategy.
5.) From a technical perspective, AMD's current price action at the 1.382 Fibonacci level suggests potential resistance. Given the difficulty in breaching this level, and potential support zones at $73 and $32, a prudent approach acknowledges the possibility of significant retracements. While those lower targets may seem distant, market volatility can produce unexpected outcomes.
==============================
...🎉🎉🎉Before You Go🎉🎉🎉…
==============================
Leave a like👍 and/or comment💬.
We appreciate and value everyone's feedback!
- RoninAITrader
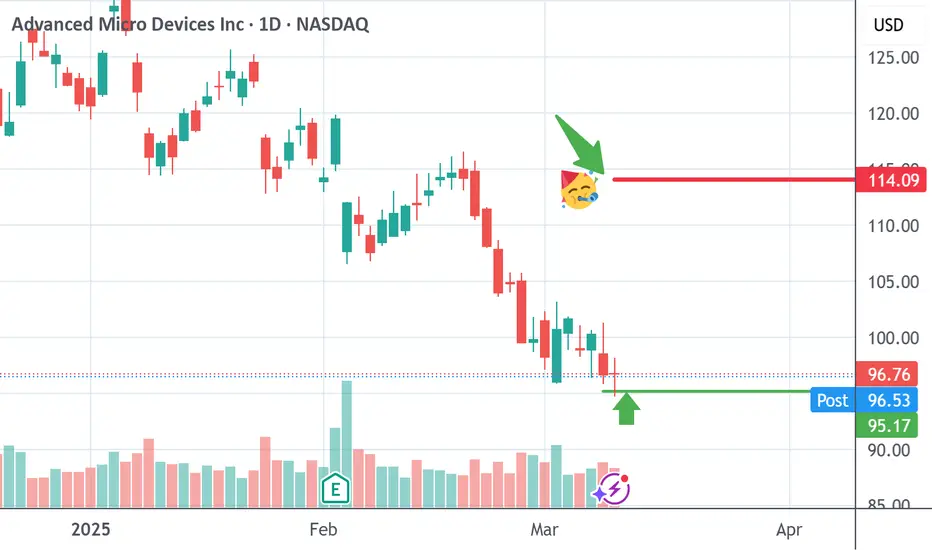
AMD long idea tgt $114I do dowsing for my ideas and it suggested a low in AMD soon/tomorrow. I think there's a dip in everything tomorrow & then reversal up. I suspect AMD holds today's low and maybe trades into the $95 zone and continues up to $114.
I asked what date this may occur by and get the 20th. We'll see.
very clean breakout for AMDboost and follow for more 🔥
lovely start to the week, secured most my weekly calls for 180-400% in profits🙏 now keep an eye on 116.32, if we can clear that the 120s should come soon.. if not we dip into 110 or so find a new support then higher.
ill post some other updates her when I can, goodluck this week everyone ⚡

AMD stock up over 20% off the lows- outperform NVidia?AMD is still cheap relative to its growth and still way down from all time highs.
Seeking alpha analysts expect 25-30% annual growth in earnings yearly. The stock is still in the low 20s PE. Stock can double and still be a good business worth owning for the long term and let compounding earnings work.
Low rsi and bollinger bands gave us the signal to buy, we bought with leverage, now we are in the shares unlevered.
Target would be all time highs over the next 2-3 years.

Already kicking the dead for a whileChart
From October 22 to march 24 we had a strong upside move.
Now we are in a deep retrace, the chart is reacting on further down moves with little emotion, I think we are kicking the dead for a while already.
In my opinion we can do even 150$ in 2 months. Than we will see.
Strategically
Trump most likely works for russian secret service. US is on the way to a regular dictatorship unfortunately, I have seen it many times before, all the same approach. He can destroy many important things and harm the usual economy in general, but the AI is so important that it could be the one of islands that will outperform despite the craziness.

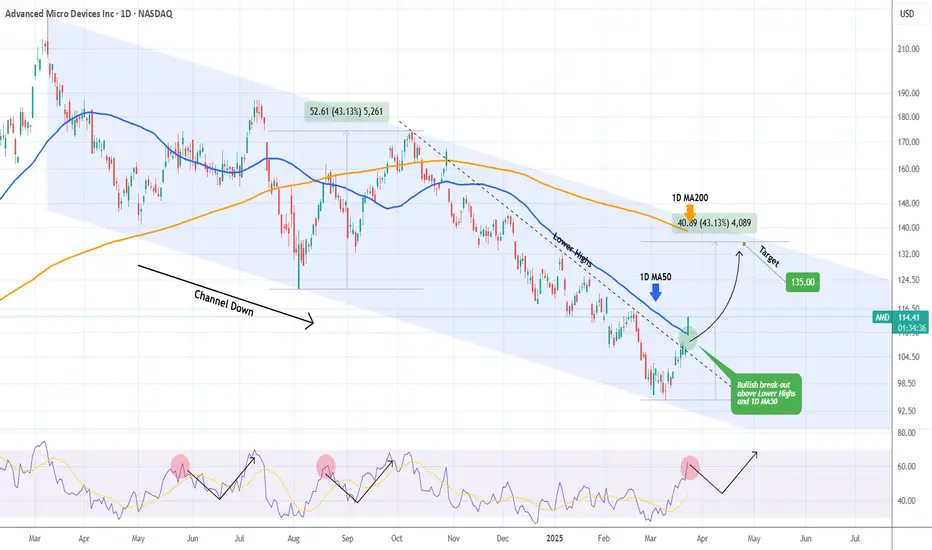
AMD broke above its 1D MA50. Is the trend finally changing?Advanced Micro Devices (AMD) broke today above its 1D MA50 (blue trend-line) for the first time in almost 5 months (since October 29 2024)! From that day after it has also been below a Lower Highs trend-line, basically the Bearish Leg of the 1-year Channel Down, which it marginally broke last week but today it smashed it.
A short-term pull-back based on the 1D RSI symmetry (with the August 20 2024 and May 28 2024 Highs) is possible but on the long-term we expect a full recovery on this Bullish Leg of at least +43.13% (like the August - September Leg).
As a result, we expect a 1D MA200 (orange trend-line) test at $135.00.
-------------------------------------------------------------------------------
** Please LIKE 👍, FOLLOW ✅, SHARE 🙌 and COMMENT ✍ if you enjoy this idea! Also share your ideas and charts in the comments section below! This is best way to keep it relevant, support us, keep the content here free and allow the idea to reach as many people as possible. **
-------------------------------------------------------------------------------
💸💸💸💸💸💸
👇 👇 👇 👇 👇 👇
Using Bands to define the stages according to WeinsteinAlways hard to see which stage a stock is in. This is a tentative way to define it

AMD UpdateThose of you that follow my AMD posts, you know that price came into my 1.382 target area @ $95.16 almost two weeks ago. Since then, I have been stating that I would prefer to see another low down to the $85-$87 area, but it is not required for the pattern to be complete. This move off of the 11 March bottom looks like a sloppy 5-wave move. If you know me, you know I instantly start to think of a corrective pattern as impulsive waves are normally decisive and leave little to the imagination.
That being said, a corrective pattern could be pointing to the initial a wave of intermediate (B), or it could be the last wave 4 of c of C of (A). Wave (B) would be pointing to the $160-$190 area, whereas the latter would be pointing to another drop in the $85-$87 range. MACD looks like it needs to drop and RSI shows AMD is overbought. These technicals point lower, but you should be asking yourself: how low? I still plan on buying in if price can make it down to the 1.618. If it doesn't make it to this area, I will remain on the sidelines until I can get a better entry point. Hopefully we can get some more clarity this week.

AMD Puts AMD (Advanced Micro Devices) – Powering the Future of AI & Chips
Stock: $106.78 | Ticker: NASDAQ:AMD | Chart: 4H
⚡️ AMD is a global semiconductor leader, designing high-performance CPUs, GPUs, and cutting-edge AI chips powering everything from gaming to data centers. With new AI processors rolling out in 2025, they’re going head-to-head with Nvidia in the AI race.
Chart Breakdown:
This 4H chart shows an ascending wedge pattern under the 200 EMA resistance – a classic bearish setup if momentum fades. Price is consolidating near $106, and a break below $105.34 could trigger a pullback to $99.
However, a breakout above $111.79 would flip momentum, aiming for $116–122.
Bottom Line:
AMD’s fundamentals in AI are 🔥, but this chart screams “decision point.”
Watch the breakout… or the breakdown.

Downtrend is officially broken :)boost and follow for more🔥
its been in a bearish downtrend all year, but it finally head a breakout last week, now look for a push to 111-127 🎯
After 127 the rally may slow down, profit taking and consolidation before we build a base for the next leg up to 150-200 🚀
side note: AMD was really good to me last week, paying 200%+ in call options, it didn't have a crazy upside move either my entries were just perfect, and i had really good exits too. I think when momentum is fully back on this stock the options will payout more than 200% ⚡
current chart request list: NVDA-XYZ-USO-HOLO-ZTS-PLTR-AAPL-SMCI-SPY-MELI-APP-V-SOUN-PLTR

AMD 1st breakout made. Now waiting for the 1day MA50.AMD is trading inside a Channel Down since November 1st 2024 and under a second layer of lower highs since December 4th 2024.
Along with the 1day RSI that just crossed above its own Resistance level, the price crossed above that second layer of lower highs.
This is the first sign of an upcoming bullish breakout but the last Resistance to confirm that is the 1day MA50.
If that breaks, go long and target 144.00.
Follow us, like the idea and leave a comment below!!

Safe Entry ZoneNever Ever Follow stocks let it come.
Always wait confirmation for entry.
the Green 1h Zone is safe entry zone.
We have two scenarios:
One: strong buying volume with reversal Candle.
Two: Fake BreakOut of green Buying Zone.
Both indicate buyers stepping in strongly once showed up at 1h Green Zone
it would be safe entry.
Note: Take Profit Line is Strong Resistance, watch out for any sell pressure at this Line.
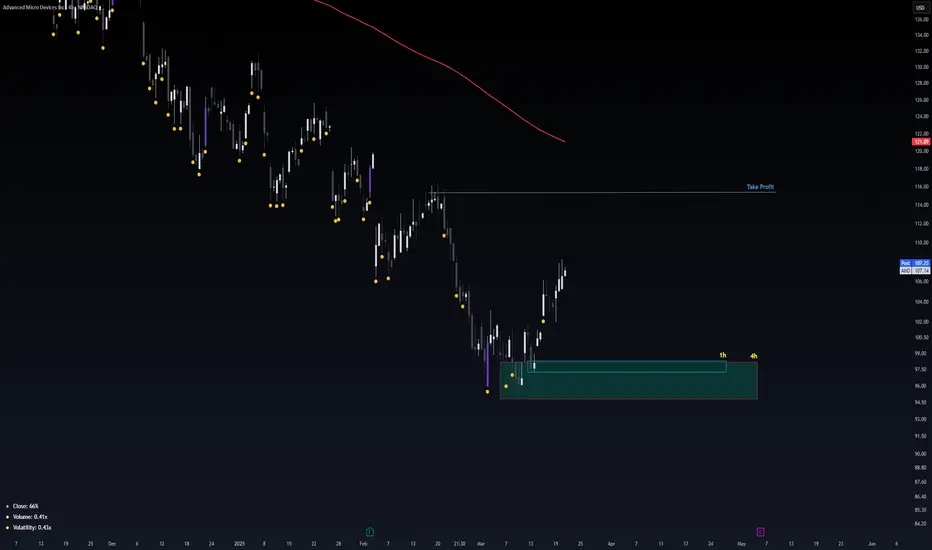
Chart on AMD with Fibonacci Retracement, Trendlines, SupportTrendline: Downtrend, connect lower highs and draw a line.
Fibonacci Retracements: High to Low for the period will show where the potential resistance
levels are.
Support Levels: Price held support from previous levels.
For Educational Purposes Only. Not a recommendation to buy or sell.
AMD gaining momentum A relief bounce or a reversal?
If price can close decisively above the trendline, this could trigger a reversal targeting the $133 level first, with potential to reach the $ 143 zone.
Entry price: $107 ish
Stop loss: $102
Target: $133
Risk calculation:
$107 - $102 = $5 per share risk
Reward calculation:
$133 - $107 = $26 per share potential reward
Risk/Reward ratio:
$26 ÷ $5 = 5.2:1

AMD - after FED- positive Inflation outlook
> more rate cuts expected
> bearish for the US market
Deeper retracement expected

AMD downtrend is almost broken!boost and follow for more 🔥
we are one green day away from finally breaking that local trend resistance, short covering and buying pressure may return if we get the breakout this week!
look for 120s short term, if the major trend resistance breaks then 150-170 comes very quick 🎯 also look at the RSI and what AMD did after it hit this RSI level last time...
ok now im done for today see y'all soon with more ✌️

AMD: Fibonacci Framework (Fractal Analysis RECAP)In this idea, I’d like to share a quick recap about my unconventional approach to understanding the chaos of the market.
Price movements don’t just mirror fundamentals, they also reshape them in continuity. Relating recent fluctuations to historic swings is crucial, because markets operate within a structured, evolving framework where past price proportions subtly wire the future. The interplay between bulls and bears doesn’t unfold randomly — it reflects recurring behavioral cycles encoded in historical patterns. Each swing carries the imprint of collective psychology, liquidity dynamics, and structural forces, which tend to repeat in varying scales. In Fractal Analysis, I recognize 2 key aspects of price dynamics: magnitude (price) and frequency of reversals (time).
For example, capturing the direction of past bullish wave can be used to define boundaries of future bearish waves. In logarithmic scale, the movements exhibit relatively more consistent angle (as percentage-based distance factors in natural growth).
To build structural framework, we need another 2 chart-based frames of reference because having multiple Fibonacci channels layered across cycle creates a collective framework of confluence zones, where price reactions become more meaningful. When several channels align or cluster around the same price levels, those zones gain credibility as potential support/resistance, because independent measurements are pointing to the same structural levels. This is why by analyzing price within a broader historical context, we gain perspective on where current price action fits within the larger market narrative.

AMD short term bullish. Price is expected to have sought its SSL and Receiving nice reaction from Previous Bull POI which was that Bullish Breaker and thus Seeking new Price discovery for short term.
Thus it is very good chance that Price will visit that Bearish Breaker first in next few weeks.
DYOR. This isn't a financial advice. This is just educational and speculative idea.
Your gains or losses are your own responsbility.
If you like this idea, please give it a thumbs up.
