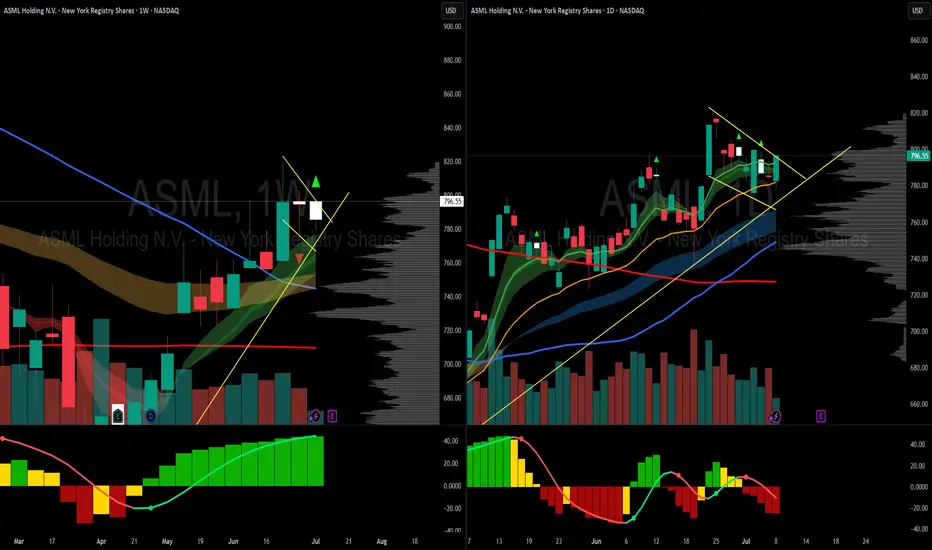
ASML looks readyNASDAQ:ASML looks ready to go with a bull flag and a double inside week, semis are strong as a sector and it is a monopoly business... pretty good long term hold also
ASML/N trade ideas
ASMLASML Holding
ASML closed at $671.6 on July 7, 2025.
Market Capitalization:
ASML's market cap is approximately $302–$314 billion as of early July 2025, making it one of the world’s 30 most valuable companies.
Key Financials and Outlook
Next Earnings Release:
Scheduled for July 16, 2025. The consensus estimate for Q2 2025 earnings per share is $5.94, with analysts expecting continued strong performance driven by demand for advanced lithography equipment
Recent Performance:
Q1 2025 EPS: $6.31 (beat consensus by $0.19)
Q1 2025 Revenue: $8.77 billion (above consensus)
Guidance for Q2 2025 Revenue: $7.6–$8.1 billion
Valuation Metrics:
P/E Ratio: Approximately 29.8–35.8, based on trailing earnings.
Dividend: ASML continues its capital return program, including dividends and share buybacks.
Recent Trend:
The stock is currently at a pullback reflecting demand and supply in semiconductor and its equities market
Industry Leadership:
ASML remains the world’s leading supplier of photolithography machines, essential for advanced semiconductor manufacturing. Its EUV (extreme ultraviolet) systems are critical for producing the most advanced chips.
Order Backlog:
The company maintains a robust order backlog, providing revenue visibility despite market volatility.
Global Demand:
Demand from Asia, especially China, continues to be a significant driver, alongside global investments in AI and advanced chip production.
ASML remains a global technology leader with a strong financial position and positive long-term outlook, despite recent share price volatility. The upcoming July 16 earnings report will be closely watched for updated guidance and demand trends in the semiconductor sector
#ASML #AI #STOCKS
ASML ASML is trading around $659.4per share The stock has a market capitalization of approximately $312 billion
Company Overview
ASML is a global leader in advanced semiconductor equipment, specializing in lithography systems essential for chip manufacturing, including extreme ultraviolet (EUV) and deep ultraviolet (DUV) technologies.
The company serves major semiconductor manufacturers worldwide, including in Asia (China, Japan, South Korea, Taiwan), Europe, and the US.
CEO: Christophe D. Fouquet
Headquarters: Veldhoven, Netherlands
The next earnings announcement is scheduled for July 16, 2025, which will provide updated guidance and insights into demand trends, especially from China and the AI-driven semiconductor sector.
ASML continues capital returns via dividends and share buybacks, supporting shareholder value.
Summary
ASML remains a dominant player in semiconductor manufacturing equipment with strong financials and growth prospects driven by AI and chip demand. While the stock has retreated from its peak, it maintains a bullish technical setup
In brief:
ASML trades near 659.4$ with a market cap over $300 billion, supported by robust fundamentals and strong demand for its lithography systems. The stock shows moderate bullish momentum with upside potential ahead of its July earnings release.
#ASML #STOCKS #AI

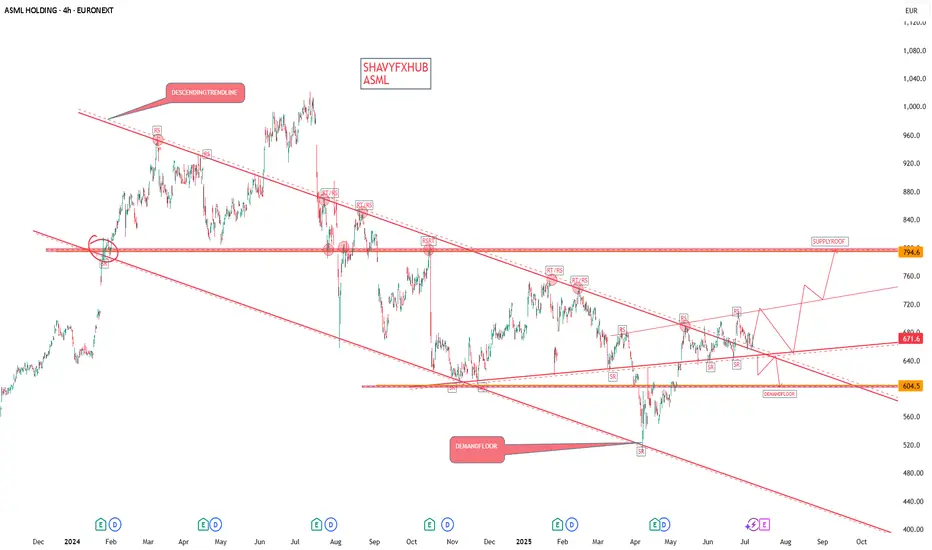
ASML Double Top Breakdown – Bearish SetupASML has formed a double top pattern, signaling potential downside. The neckline has been broken, confirming the bearish setup. If price holds below this level, further downside is expected.
Key Levels:
🟠 Entry: Below confirmation level
🔴 Stop Loss: 780.43
🟢 Target: 549.66
Bearish momentum is strong, and a move toward the target could play out if the breakdown continues. Manage risk accordingly.

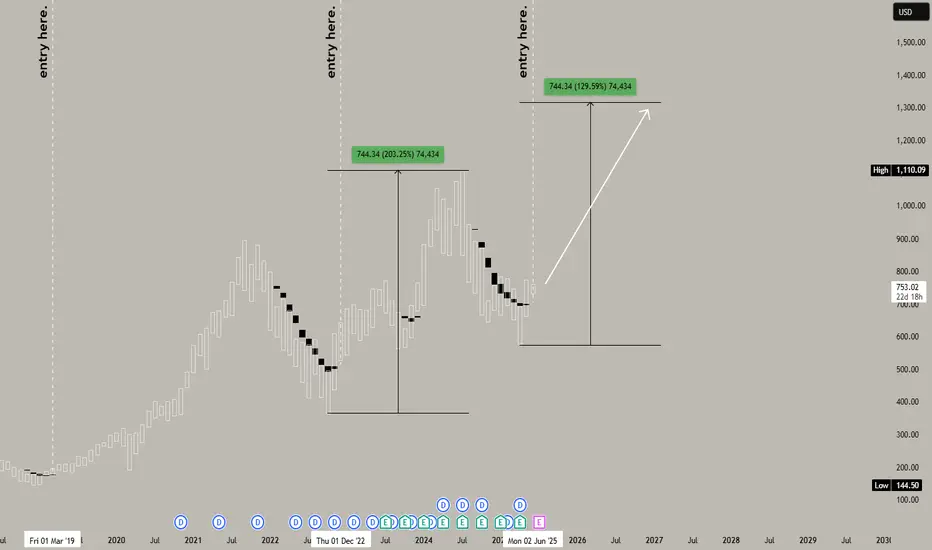
ASML REVERSAL SHIFT to the upside begins. SEED at 750 X2 Target!ASML Holding N.V. holds a near-monopoly in the semiconductor industry, particularly in the production of extreme ultraviolet (EUV) lithography machines, which are essential for manufacturing advanced chips. ASML is the sole provider of these machines, making them indispensable for chipmakers like TSMC, Intel, and Samsung. This position gives ASML significant control over the global chip supply chain.
ASML an industry leader which has seen consistent multiyear price growth from 300 to tapping a peak at 1100 -- took some much needed hibernation during the trump transitional period, coinciding with the general market.
Now, the stock's red days season is about to meet its end. This month, June 2025, ASML registered its first bear weight clearout based on our diagram conveying an initial prep work for that significant reversal to the upside.
The last bear weight clearout was on December 2022. So you know this current massive shift that transpired this month is very special. This signal is elusive and doesn't come often.
It touched the most bargain 78.6 FIB levels -- the most discounted area where most buyers converge. And its currently manifesting based on the prices the last few days.
Ideal seed is at the current price zone at 750 with mid target at x2.
Flight will be easier now.
With ASML monopolizing the industry -- and with FA and TA aligning, second guessing has no place with regards to the trajectory of this stock.
Spotted at 750
Target at 1400.
TAYOR.
Trade safely.
ASML Update! Bullish teal is proving itself! We identified in the last video (must watch if you didn't see it) that we need to prove teal over purple in this fight for a LTF breakout toward HTF algorithms.
We're seeing that happen in live-time! Continue to watch for teal to hold for a nice LTF breakout toward the $820 level and the HTF purple algorithm / known supply
Happy Trading :)

ASML Analysis - Short/mid-term outlook & trade ideasNot as clear of an opportunity as we had last time when we nailed those 100+ point trades. Check out those videos (linked below) to see the power of the algorithms!
But here, we can see a nice roadmap toward HTF intentional liquidity and what we need to see in order to get there.
Happy Trading :)

ASML Index Stock Chart Fibonacci Analysis 052725Trading Idea
1) Find a FIBO slingshot
2) Check FIBO 61.80% level
3) Entry Point > 760/61.80%
Chart time frame:D
A) 15 min(1W-3M)
B) 1 hr(3M-6M)
C) 4 hr(6M-1year)
D) 1 day(1-3years)
Stock progress: B
A) Keep rising over 61.80% resistance
B) 61.80% resistance
C) 61.80% support
D) Hit the bottom
E) Hit the top
Stocks rise as they rise from support and fall from resistance. Our goal is to find a low support point and enter. It can be referred to as buying at the pullback point. The pullback point can be found with a Fibonacci extension of 61.80%. This is a step to find entry level. 1) Find a triangle (Fibonacci Speed Fan Line) that connects the high (resistance) and low (support) points of the stock in progress, where it is continuously expressed as a Slingshot, 2) and create a Fibonacci extension level for the first rising wave from the start point of slingshot pattern.
When the current price goes over 61.80% level , that can be a good entry point, especially if the SMA 100 and 200 curves are gathered together at 61.80%, it is a very good entry point.
As a great help, tradingview provides these Fibonacci speed fan lines and extension levels with ease. So if you use the Fibonacci fan line, the extension level, and the SMA 100/200 curve well, you can find an entry point for the stock market. At least you have to enter at this low point to avoid trading failure, and if you are skilled at entering this low point, with fibonacci6180 technique, your reading skill to chart will be greatly improved.
If you want to do day trading, please set the time frame to 5 minutes or 15 minutes, and you will see many of the low point of rising stocks.
If want to prefer long term range trading, you can set the time frame to 1 hr or 1 day.

ASML has broken out of a falling trend channelASML has broken out of a falling trend channel and is now testing resistance around 773.
The stock entered a declining trend after breaking down from a double top formation — the target from that pattern has long been reached.
Price is trading above a red Ichimoku cloud.
Volume balance has been negative throughout the chart, except recently.
Price momentum, including RSI(21), indicates potential for further upside.
From a fundamental perspective, analysts are predominantly positive on ASML.
The company has a near-monopoly in the production of photolithography machines used to manufacture the most advanced semiconductor chips.
Disclaimer: I hold a position in the stock.
Note: Always do your own research and analysis before making any trading decisions.

Support = Buy and Resistance = Sell , Really ?Some people believes the market is rigged and very few people made money out of it, perhaps the top 1% of the people.
In charts, there are support and there is resistance. Sometimes, the price action bounces up precisely upon hitting the support line and reverse when it hits the ceiling/resistance line. Over time, it manages to "SELL" the notion that this works. And more people starts to believe in it and go LONG or SHORT. And the more money they made out of it, the more they share/exaggerate/boast about it.
I leave you to be the judge yourself. Go find a company you are currently vested and take a look at the chart. How many times does it work on the support and resistance concept , say out of 5 years ? The longer time frame the better !
So, when you look at my chart, it makes sense, doesn't it? Hit resistance plus there is a nice gap to be filled up. So the price action SHOULD rightfully close it first before the rally. Who said so ? And I have said many a times, trying to predict the market moves no matter how alluring it might be or make you looks like a guru/expert, it is futile if you had not taken any concrete action with it.
You could be just lucky once, twice or even three times. And when you finally gives in and decide to put in cold hard cash into it, the market turns against you. And your world turns upside down. Historical patterns is one thing and the future is another. How many economists with PHD and renowned university degrees got their predictions wrong about the market, years after years?

ASML watch $675: Key Resistance that may Reject or Mark BottomASML trying to recover slowly with the chip sector.
Currently test a key resistance zone $ 673.43-677.93
Looking for a Break-and-Retest to consider long entries.

ASML is Ready for another Leg upASML has closed revesal monthly candle and staning back on the 50 EMA monthly trendline.
Look like we about to trend up stongly from here

ASML Stock Chart Fibonacci Analysis 050925Trading Idea
1) Find a FIBO slingshot
2) Check FIBO 61.80% level
3) Entry Point > 696/61.80%
Chart time frame: D
A) 15 min(1W-3M)
B) 1 hr(3M-6M)
C) 4 hr(6M-1year)
D) 1 day(1-3years)
Stock progress: A
A) Keep rising over 61.80% resistance
B) 61.80% resistance
C) 61.80% support
D) Hit the bottom
E) Hit the top
Stocks rise as they rise from support and fall from resistance. Our goal is to find a low support point and enter. It can be referred to as buying at the pullback point. The pullback point can be found with a Fibonacci extension of 61.80%. This is a step to find entry level. 1) Find a triangle (Fibonacci Speed Fan Line) that connects the high (resistance) and low (support) points of the stock in progress, where it is continuously expressed as a Slingshot, 2) and create a Fibonacci extension level for the first rising wave from the start point of slingshot pattern.
When the current price goes over 61.80% level , that can be a good entry point, especially if the SMA 100 and 200 curves are gathered together at 61.80%, it is a very good entry point.
As a great help, tradingview provides these Fibonacci speed fan lines and extension levels with ease. So if you use the Fibonacci fan line, the extension level, and the SMA 100/200 curve well, you can find an entry point for the stock market. At least you have to enter at this low point to avoid trading failure, and if you are skilled at entering this low point, with fibonacci6180 technique, your reading skill to chart will be greatly improved.
If you want to do day trading, please set the time frame to 5 minutes or 15 minutes, and you will see many of the low point of rising stocks.
If want to prefer long term range trading, you can set the time frame to 1 hr or 1 day.

BOS LS bottom not quite in. 600The 666 stock feels like it has been stuck here for quite some time, breaking every time it offers a solution or a reaction. Crossdown on numerous oscillators could be the only thing left to break before it stabilizes. A shake is likely imminent.

ASML Could Significantly Outperform Over The Next 5 YearsWhat Makes a Compounder?
"Compounder" has become a buzzword in investment circles, but we define it simply: a company that delivers higher-than-average returns for longer-than-average periods.
The formula is basic economics - a compounder excels at both sides of the supply-demand equation:
Demand side: Growing revenue and profits drives investor interest
Supply side: Reducing share count increases each investor's ownership percentage
Why ASML Makes the Cut
NASDAQ:ASML demonstrates classic compounder characteristics:
Growing Demand
- Revenue growth from 11B in 2018 to 32B today
- Net income increase from $2.6B to $9.3B in the same period
- Dominance in advanced chip manufacturing equipment, particularly EUV and DUV technology
Decreasing Supply
- Consistent share count reduction through buyback programs
- Management's clear focus on shareholder value
Why Now Is the Time to Buy
The current buying opportunity exists because:
- ASML is trading at the lower end of its historical P/E and P/S ranges
- The recent drawdown is among the deepest in years, comparable only to the 2022 tech slowdown
- The current pullback reflects cyclical semiconductor industry dynamics, not fundamental issues
- TTM revenue has already hit all-time highs, but the stock hasn't caught up
Risks to Consider
- Potential semiconductor manufacturer CAPEX delays affecting ASML's backlog
- Geopolitical risk with Taiwan, where many customers including TSMC are located
- Premium valuation relative to broader market

ASML Holding NV Falls Short on Q1 Orders Amid Tariff UncertaintyASML Holding NV reported weaker-than-expected first-quarter orders, citing growing global uncertainty due to fresh tariff announcements. The Dutch semiconductor equipment firm recorded €3.94 billion ($4.47 billion) in net bookings for Q1, well below the €4.82 billion anticipated by analysts, according to Bloomberg data.
The company supplies advanced chipmaking machinery to leading names like Taiwan Semiconductor Manufacturing Co. and Intel Corp. ASML’s CEO Christophe Fouquet acknowledged that the semiconductor industry is facing renewed pressure. He stated that tariffs are “creating a new uncertainty,” not only for global economic stability but also for future market demand.
Despite missing order expectations, ASML emphasized that bookings often fluctuate and may not fully reflect ongoing business momentum. Nevertheless, concerns persist over how geopolitical tensions and potential tariff measures—particularly from the U.S. government—might impact the broader semiconductor supply chain.
Technical Analysis
As of 2:53:28 PM EDT, stock is trading at $630.08, down $52.79 (-7.75%), following the earnings announcement. Technically, this is seen in a sharp selling pressure after the earnings miss. Current price action is now trading towards a key support zone around $578, which marks the recent low.
If the price faces rejection there, a potential retest of the $770 resistance remains likely.
Alternatively, a successful breakout above the resistance may drive a move toward $600 levels.

ASML probably hasn't bottomed yetThe ASML bounce looks tempting but i'm exprecting another thrust down. I've been buying around the mid-600s and long term this is still a good price to be avg in, but just keep in mind it may not have found bottom. All the other recent bottoms have tested the lower bollinger bands, i think this will play out similar.

ASML - Nailed our short trade! How, Why, and What now?If you watched my video on why I was shorting ASML last week, you'd be quite pleased with the subsequent dump. This wasn't luck - this was understanding the algorithms, the basics of market dynamics and supply and demand, and doing what we do best - sniping a good entry to allow the HTF algorithms to be in control.
Let's keep this momentum up as the market and individual equities continue to offer us excellent trade opportunities!
If you haven't watched my SPY video that I just posted, please check it out as it's extremely important to keep an eye on the broader markets as a gauge as to when these liquidity builds might be happening and to understand if the market's movements are just that, liquidity building, or continuation.
Happy Trading :)

ASML - An exciting short trade I've been preparing forI've been analyzing price action on ASML for a few months and am very excited to finally be entering a position here once all the confluences line up. Lots of chop recently and price is still deciding where it wants to land. Luckily, utilizing algorithms and known S&D, we can get a good picture of which way and where that will be.
Happy Trading :)

IT COULD BE THIS EASY!No further commentary necessary here.
Comment, boost, shoot me a message, let me know that this is working for you guys too!
If you're new here, check out some of my videos and watch the market start to make sense!!
Happy Trading :)

ASML is on life support Warning: This baby is super volatile and not for beginners. If you’re trading with a small account, start with 1 share and put your stop in as soon as you enter. No exceptions.
We’ve got 3 lower highs, and there are institutional sellers parked near the 200-day EMA, slowly walking this thing down.
If they press, I’m watching to see if ASML can test the $650 area.
If it breaks, we might be looking at another 50–60 points lower.
📌 Tight stop: $750
📌 Wider stop: $770
This one isn’t for the faint of heart—respect the volatility and use stops!

750 Soft spot for selling, but trendline stabilizingIt has been a yo-yo recently, swinging one way rather than the other, and it seems to be the same pattern. It has seen progress, but I anticipate another selloff until we get some serious volume and volatility into the 750 regions!

ASML: Possible Upside MomentumNASDAQ:ASML appears to be setting up for a potential upside move. After a period of consolidation, the stock has shown resilience at key support levels and is now primed for a bullish breakout.
Resistance: $786 – This is the primary target for the next leg higher.
Momentum: Indicators suggest increasing buying pressure.
