Informative | ATOSNASDAQ:ATOS
Bullish Scenario : If the price breaks above the resistance zone ($1.31 - $1.39) with strong volume, it could test the next resistance at $1.57.
Bearish Scenario : Failure to break above the resistance zone could result in a pullback to support levels at $1.20 or $1.10.
The overall trend is cautiously bullish, but confirmation is needed with a decisive break above the resistance zone.
ATOS trade ideas


Atossa Therapeutics: Navigating Clinical Trials and Market TrendAtossa Therapeutics is in the spotlight with its Phase 2 clinical trials, a crucial stage in assessing the efficacy and safety of their drug. Success here is vital for FDA approvals and advancing to later trials. However, the journey is fraught with challenges like regulatory hurdles and unpredictable trial outcomes, which can significantly sway the company's stock value.
On the technical front, ATOS appears to be in an uptrend but recently faced a minor pullback, hitting the upper Bollinger Band. In response, I've sold part of my position, planning to reinvest on witnessing a stronger upward trend.
Investors should note that Atossa is still in the research phase, lacking a market-ready product. Despite a bullish trend, the company's future hinges on its clinical achievements and market entry potential.

ATOS Break OutAverage daily volume has been increasing since late May when it made a bullish pennant and a golden cross.
The ADX at 36 indicates a strong trend with D+ moving sharply higher.
Price broke out of the pennant (which corresponds to the descending trend line on the weekly) and looks very bullish as it appears to be flagging.
Most importantly we bullish divergence as OBV has been rising while price was dropping. This indicates volume is flowing in to the stock. (OBV is a cumulative total of positive and negative volume) OBV is a powerful indicator that often signals the actions of "smart money".
Watching for a break of possible double top at $1.40
target: $1.80 short term $4 long term.

ATOS | InformativeNASDAQ:ATOS
It completed wave 3, and now wave 4 has started. It is expected to reach the 1.08 area soon, which aligns precisely with the Fibonacci retracements. After that, it should initiate wave 5, with the initial target being 1.60, followed by 2.10, which is a significant key level from 2021.
There is a possibility that market manipulators (MM) will create volatility and attempt to discourage retail investors. Considering the Fibonacci levels and historical support and resistance lines, there is even a chance of it dropping to the $1 area. However, it's important to maintain faith as the overall trajectory is upward. More retracement could potentially result in a higher upside possibility.
The Company:
ATOS is the ticker symbol for Atossa Therapeutics Inc., a biopharmaceutical company focused on the development of novel therapeutics for breast cancer and other breast conditions. The company's primary area of research is the development of therapies using its proprietary Endoxifen technology.
Endoxifen is an active metabolite of the drug tamoxifen, which is commonly used in the treatment of hormone receptor-positive breast cancer. Atossa Therapeutics is investigating the use of its proprietary formulations of topical and oral Endoxifen for various indications, including breast cancer prevention and the reduction of mammographic breast density.

ATOS | InformativeNASDAQ:ATOS
I anticipate a pullback to $0.85 as the Relative Strength Index (RSI) indicates an overbought condition. Based on Elliott Waves theory, a correction is expected, followed by the emergence of the fifth leg.
Following the pullback, if the price surpasses the psychological resistance level of $1, there are three potential price targets: $1.15, $1.30, and $1.60.
TP1: 0.85$
TP2: 1$
TP3: 1.15$
TP4: 1:30$
TP5: 1.60$

Atossa Therapeutics*risky but the reward…*
Trawling through the Nasdaq at the 11th hour before a major correction reveals a number of interesting opportunities where the success of tech stocks have overshadowed the less successful of late.
This trade idea is 100% technical without focus on the fundamentals. Atossa is a small Therapeutics business with a limited number of employees. so please do your own research.
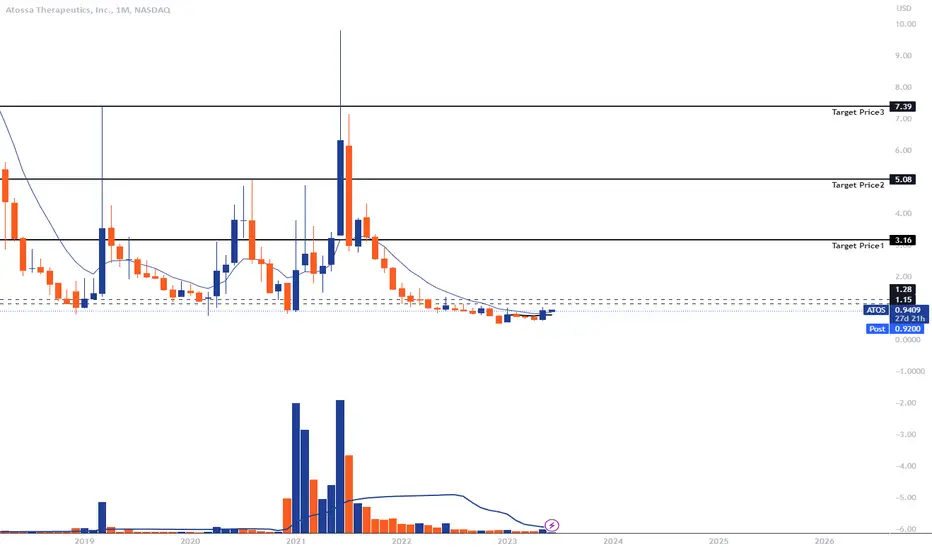
The technical's of the above monthly chart:
1) The 21-month recently crossed the 30 month moving average, very bullish.
2) Price action is currently trading on support of the bottoming candle.
3) The weekly chart recently printed a Dragonfly DOJI with a higher low in price action. Very bullish.
1st target: $220 / 14000%
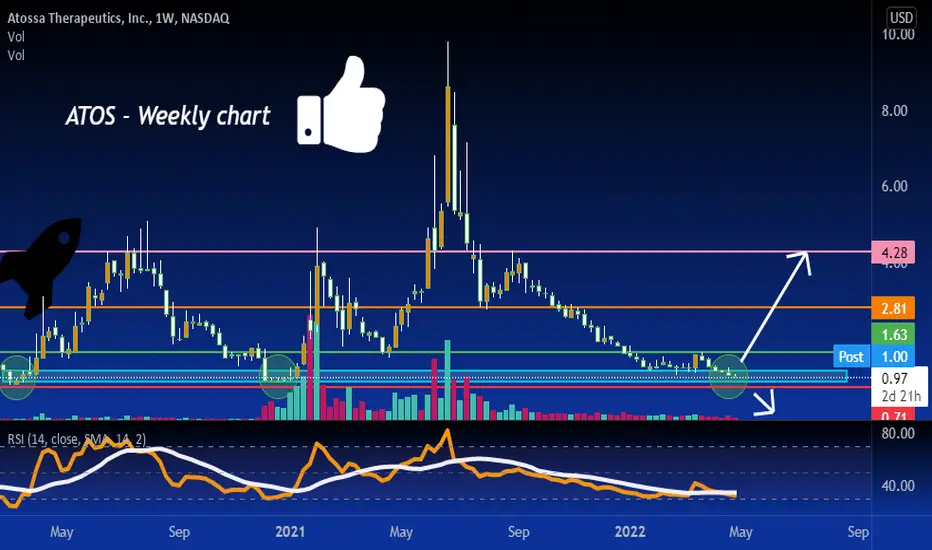
Weekly chart:

Target $ 2.78Atossa Therapeutics (ATOS) said Wednesday it has completed enrollment in part B of its phase 1/2a trial of drug candidate AT-H201 in Australia.
AT-H201 is being developed as an inhalation therapy for moderately to severely ill hospitalized COVID-19 patients and for "long-haul" patients with post-infection pulmonary disease, the clinical-stage drugmaker said. The phase 1/2a trial will enroll 60 healthy participants and moderately-ill hospitalized COVID-19 patients and will be carried out in four parts.
Atossa Therapeutics said it completed in vitro testing of AT-H201 in May 2020. Data showed that the components of AT-H201 inhibit COVID-19 infectivity of Vero cells, a type of cell that is being used to study infectivity of the coronavirus.

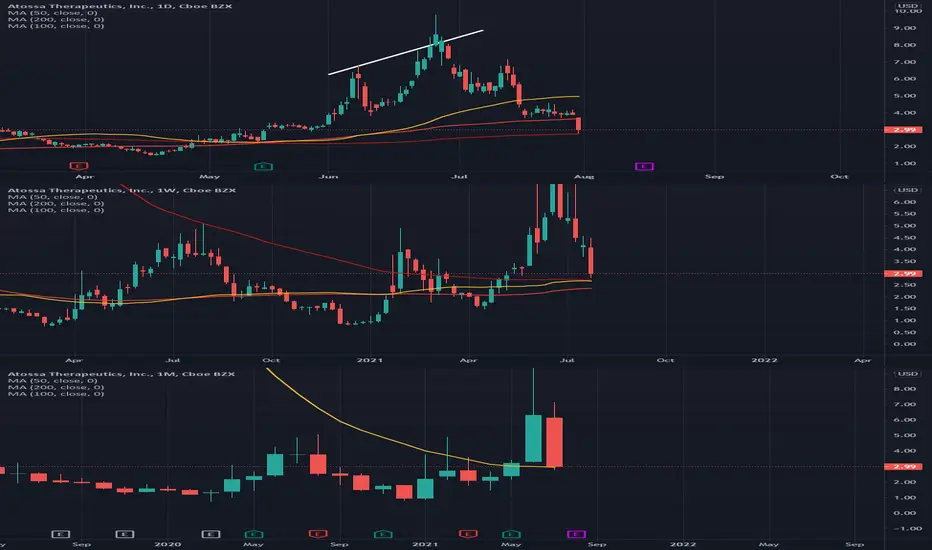
ATOS Weekly Shaping UpWe can see that the weekly chart is showing some exhaustion on the sell pressure. The daily has a bit of a heartbeat today breaking over the 20ema/ma.
Looking to see the weekly SARs flip underneath to support price, and a break over the T Line (EMA8) on the weekly to confirm a trend change.
If there is a solid break, targets (based on current price but will change) would be:
Weekly 20ema - 2.04
Weekly 50ema - 2.53
Weekly 100ema - 3.24
Anything over would just be cream. Unless they finally go phase 3 for endoxifen, but I'm sticking to TA.


our beloved $ATOS *This is not financial advice, so trade at your own risks*
*My team digs deep and finds stocks that are expected to perform well based off multiple confluences*
*Experienced traders understand the uphill battle in timing the market, so instead my team focuses mainly on risk management*
$ATOS remains my teams best trade yet, but sadly for you guys this was before we got serious about documenting our trades here at tradingview. Long story short our guys charted and caught an enormous jump from $1.50 to $9+ per share earlier this year.
My team entered $ATOS again today at $2.75 per share and have set our first take profit at $4.
ENTRY: $2.75
TAKE PROFIT 1: $4
TAKE PROFIT 2: $6.50
If you want to see more, please like and follow us @SimplyShowMeTheMoney


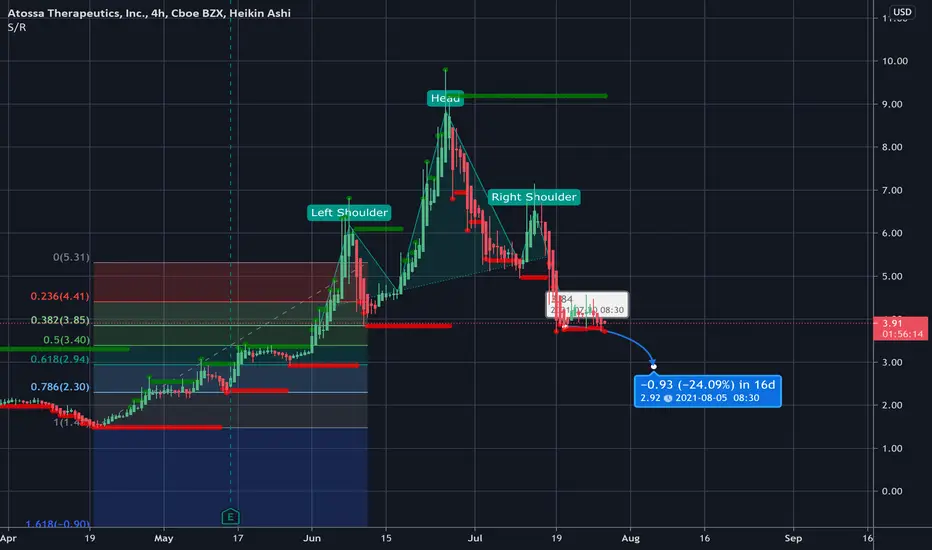
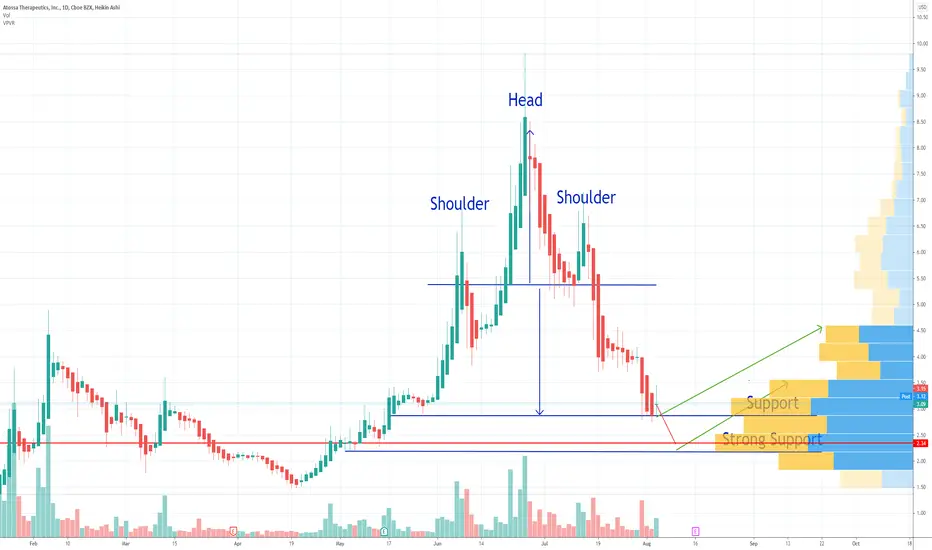
Atossa Therapeutics due for a local correction. ATOSIt was a spectacular run for this stock, yet we seem to be at the end of the run. This is backed up by momentum divergences and dropping momentum overall. The latter is both on RSI and MACD. Indicator picture is more or less the same up to the daily chart. Our take on technical indicators is always secondary to the fractal picture of the markets. Anyway... pivoting down.
We are not in the business of getting every prediction right, no one ever does. The Fibonacci targets going down are highlighted in purple with invalidation in red. Fibonacci goals, it is prudent to suggest, are nothing more than mere fractally evident and therefore statistically likely levels that the market will go to. Having said that, the market will always do what it wants and always has a mind of its own. Therefore, none of this is financial advice, so do your own research and rely only on your own analysis. Trading is a true one man sport. Good luck out there and stay safe!


$ATOS - AND I’M OUT$ATOS - AND I’M OUT
I closed this position early today… The only reason is that my average is wrong here… I know exactly what I did (I was adding and I sold my position, then bought back in, then I didn’t know what my real average was anymore- sometimes I just go too fast and my OCD won’t let me not know my average LOL) 😬
So either way I’m out and I’ll be looking for another entry…

ATOS | InformativeNASDAQ:ATOS
It's at 200EMA, and 3.31 is one of the key levels, it hit bounced up, it could be dead cat bounce (most likely), it's still in downtrend, without any reversal confirmation, I expect it hit 3.60 area, and then we will see what will happen, personally I expect price rejection to 2.80$ area and then 2.50$, GL
This is my idea and could be wrong 100%

DOUBLED $ATOS Target 5.69 for 46.27% DOUBLED $ATOS Target 5.69 for 46.27% (Actually I a little bit more than doubled here, but not by too much)
Next add level at 2.09
Or Double Position again at 1.48
@Dau30 Here is my new average after doubling this morning… and I have a small order open at 2.80 but I’m watching for 1.48. A WILD day, for sure...
-----
—
On the far right of the chart is my Average (Grey) Current Target (Green), and Next Level to add (Red) Percentage to target is from my average.
ONLY ADD at support levels & FIB levels… labeled
I start every position with .5 - 1% of my account and build from there as needed and as possible.
I am not your financial advisor. Watch my setups first before you jump in… My trade set ups work very well and they are for my personal reference and if you decide to trade them you do so at your own risk. I will gladly answer questions to the best of my knowledge but ultimately the risk is on you. I will update targets as needed.
GL and happy trading.
