Brighthouse Financial (BHF): Life Insurance Market ExpandsBrighthouse Financial, Inc. (BHF) is a leading provider of annuities and life insurance, helping individuals secure their financial future. The company offers retirement income solutions designed to protect and grow wealth over time. As more people focus on financial security, Brighthouse continues to expand its offerings, leveraging market demand for long-term planning and stability.
The stock chart recently showed a confirmation bar with increasing volume, moving into the momentum zone, which happens when the price moves above the 0.236 Fibonacci level. This signals strong investor confidence and potential for further gains.
BHF trade ideas

BHF - Bull Angle Drawing trend lines allows this structure to form
Within this structure is a smaller channel up, I want this to break out to the upside strongly, potentially out of its channel contained in and touch the upper trend line
If the upper trend line is touched it would be a big move
Bars pattern as usual for the example price movement

$BHF - Monthly Mid Cap Financial Company Set upsIWM has a beautiful set up after bouncing off bull flag trend line resistance turned support. Love to see it! Noticed 25% of the IWM is financials. This is the first one I looked at. This monthly chart is beautiful. RSI is above 50 which is bullish and we have a couple other set ups. Inverse head and shoulders and I could see this turning into a cup and handle formation. Mid cap financials could be setting up for some nice moves. I am going to see what else I can find for ya :)

$BHF looking primed for a breakoutHeavy resistance at $50 , but looking at the weekly MACD and using an anchored VWAP pinch, she looks ready for a move. Once $50 is cleared it's blue skies. High reward low risk in my opinion.. just an idea :)

Brighthouse Financial Announces $1 Billion Stock Repurchase ProgBHF: Brighthouse Financial, Inc.
2021-08-05 16:15:00
Brighthouse Financial Announces $1 Billion Stock Repurchase Program

BHF (Brighthouse Financial Inc) - Bullish on quarterly moveBrighthouse Financial, Inc.
Brighthouse Financial, Inc. provides life insurance and annuity solutions primarily in the United States. The Company offers shield, variable, guaranteed, income, and fixed annuities as well as life insurance, retirement planning and financial advisory services. Brighthouse Financial, Inc. is based in Charlotte, North Carolina.
Analysis/Commentary
Strong EPS and Sales Growth Y-on-Y
Based on the study of the previous quarterly earnings reports and subsequent price moves:
- Current quarter has given price move to the LOW point
- Buy initiated
- Expectation for the price to move to MID or HIGH point
- Trailing stop-loss on price above MID point
GOOD LUCK.
DO YOUR OWN RESEARCH!


BHF: Ascending Triangle + bullish engulfing candleAscending Triangle + bullish engulfing candle
Pros
Descending volume
Bullish engulfing candle
PPS above 50MA
Cons
PPS below 200MA
ATR descending
250RSI below 50
If confirmed
PT1 = 32,88
PT2 = 34,94
PT3 = 36,26
Bonus PT4 = 39,69


Brighthouse Financial Announces $500 Million Stock Repurchase PrBHF: Brighthouse Financial, Inc.
2020-02-10 16:15:00
Brighthouse Financial Announces $500 Million Stock Repurchase Program

BHF 7 RRR shortTrading Methodology:
1. An asymmetric bullish/bearish pennant is drawn using ascending and descending curved trend lines with a minimum of three price action touche points per line. The direction is determined by the previous trend.
2. The angle tool is applied from the earliest two trend touch points, beginning at the earliest touch point.
3. A trend-based Fibonacci retracement triangle is drawn starting from the earliest trend touch point and ending at the earliest touch point of the opposite trend line .
4. Based on the degree, of the earlier defined angle, the appropriate (and secret) levels are selected for the fibonacci retracement ; two levels for stop-loss and two levels for take-profit. The closest stop-loss level to the current price level is the top priority stop-loss. Though the secondary stop-loss level is often chosen for some markets such as FX and some equities in order to account for seldom unexpected resistance breaks. The greater target level is the top priority, and where majority of the shares are sold, though some may choose to close part of the position at the first target level or set it to be the stop-loss once price exceeds it. Entries should be laddered in around the levels closest of the yellow line.
This trading strategy can be applied to any market and time frame, and positions most often garner the greatest risk-to-reward ratio with the highest success rate. What more can you ask for? I will only be posting my unique trading strategy until EOY. I work solely with price action to identify pennants and apply unique trend-based fibonacci retracement levels for SL and TP levels. Reach out to me if you have any questions.

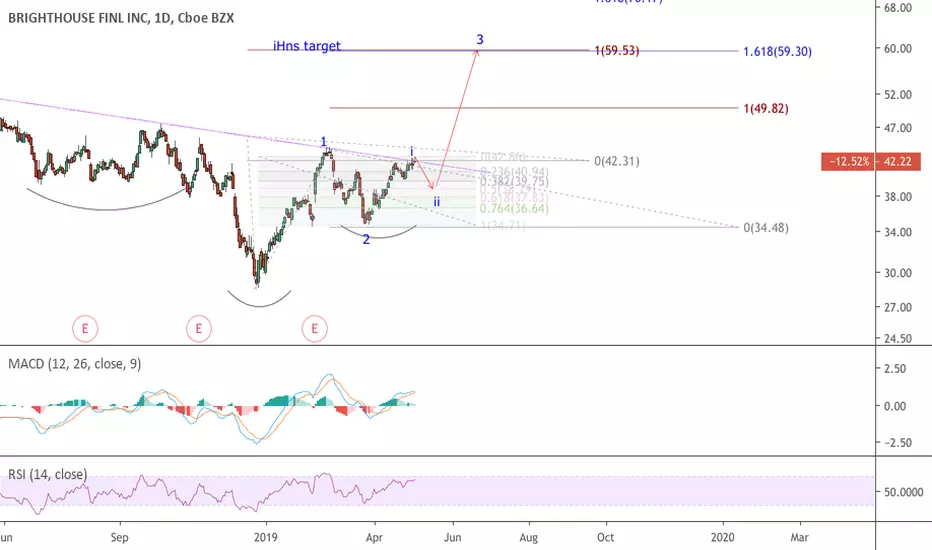
BHF: On the cusp of wave 3. Bullish Abandoned Baby. 10R tradeBased on the 1-2-3 Trading Rule, Point 1 had already happened when BHF broke out of the downtrend line. Point 2 happened when it printed a higher low. Wait for point 3 (a higher high) to enter. If held until wave 3 target is reached, this will be a 10R trade.

Brighthouse Financial Announces $400 Million Stock Repurchase PrBHF: Brighthouse Financial, Inc.
2019-05-06 16:15:00
Brighthouse Financial Announces $400 Million Stock Repurchase Program - Business Wire

BHF: Wave 3 target matches iHnS target. Expect a sub (ii)pullback @Fib 50%-61.8%. Wave 3 of 3 should be sweet.

BHF Detected possible stock repurchase!!!BHF: brighthouse financial inc
2018-08-06 16:15:10
Detected possible stock repurchase

