Citigroup.nyseFix above 80 ascent to specified numbers otherwise descend to lower numbers
Citigroup Stocks. New York Stock Exchange
4 hour time
C trade ideas

$C Near Resistance LevelCitigroup is nearing the 1-year resistance level. But with its bearish candle at the closing, huge volume and weakening upward momentum, it could be the start of its retracement to 75-76 support levels.


i46.CBeta-R:Journal. Risk Management: Compound .Level : PA . Time: Short-term - Intermediate . This is just my view follow if it aligns with yours. Ideas are not repeated rather updated.Worry about risk only.

$C Citigroup on breakout alertAwaiting break above $77 for a possible long entry on a multiyear breakout.

Now you can truly and happily laugh yourself to the bank -3 Same thing here for Citigroup.
Now you can choose one of the 3 banks to buy , no need to buy all 3 as that concentration might be too heavy for a single portfolio or you aren't too sure.
The bank takes money from you each year on interest and bank charges, now is the time to get back some from them, wouldn't you want that ? haha


38.2% & POSSIBLE 61.8% Retracement SHORT GWAVE38.2% & POSSIBLE 61.8% Retracement SHORT GWAVE.
FIB Retracement Percentage is calculated in a Higher Cartesian and or Euclidean Dimension.
PLEASE ALWAYS WAIT FOR STOCHASTIC CONFIRMATION!!! THANKS

CA finales del año 2011 se puede ver un patron doble piso y en la actualidad hay una linea de tendencia bajista

$C Citigroup chart Bullish pre earnings.Bullish above $72 or break of channel.
Trading at a exceptionally low P/E ratio of 9.75.
2.91% yield is reasonable.
Average analysts rating BUY | target $81.16
Indicators are very bullish but sentiment is not, fears exist for lower earnings and the inevitable selloff after report.
Company profile
Citigroup, Inc. is a holding company, which engages in the provision of financial products and services. It operates through the following segments: Global Consumer Banking; Institutional Clients Group; and Corporate and Other. The Global Consumer Banking segment provides traditional banking services to retail customers through retail banking, including commercial banking, and Citi-branded cards and Citi retail services. The Institutional Clients Group segment provides corporate, institutional, public sector and high-net-worth clients around the world with a full range of wholesale banking products and services. This segment includes fixed income and equity sales and trading, foreign exchange, prime brokerage, derivative services, equity and fixed income research, corporate lending, investment banking and advisory services, private banking, cash management, trade finance and securities services. The Corporate and Other segment includes certain unallocated costs of global staff functions, other corporate expenses and unallocated global operations and technology expenses, Corporate Treasury, certain North America and international legacy consumer loan portfolios, other legacy assets and discontinued operations. The company was founded in 1812 and is headquartered in New York, NY.

A High probable short position of Citigroup.Upon observing price I see Price Has reacted to the following Zones Outlined. I will be making trades on these Zones in the Options Market.


Citigroup may not be JP Morgan, but who cares! NYSE:C
Let us take some risk (again) based on the 10-year pattern C has been drawing for us. Short-term traders may want to have $64.80 as their risk level (exit strategy) on any longs.

C long setupC’s innovation outlook is trending up based on a current score of 58 out of 99, outperforming sector average. Jobs growth over the past year has decreased and insiders sentiment is neutral. C is an Average Performer in terms of sustainability. Over the past 4 quarters C beat earnings estimates 4 times and it pays dividend lower than its peers.
For more analysis and articles visit our website .


CitiGroup shares pulled back after breaching trend line C - CitiGroup shares breached a long term trend line to the upside, only to be pushed back down. Stocks fell on Tuesday trades but found support at 63.00, a critical Fibonacci retracement price level and closed at 63.41. Its next challenge is to remain above 63.00 and have another go at 64.45. It has the potential to reach 66.65 targets in a short period if it makes it through 64.45


CITI sitting on a critical support level.Financials have taken a real battering in the past 2 weeks with the majors entering correction phase, NYSE:C is mow down 15% from its recent high. During today's trading session it has managed to hold critical support , if it breaks a further 20% drop sits below to the December 18 lows.
Longs are sitting in a very nervous position which will need a green day tomorrow or major trouble lay ahead.
Safe trading if already in, if not stay away.

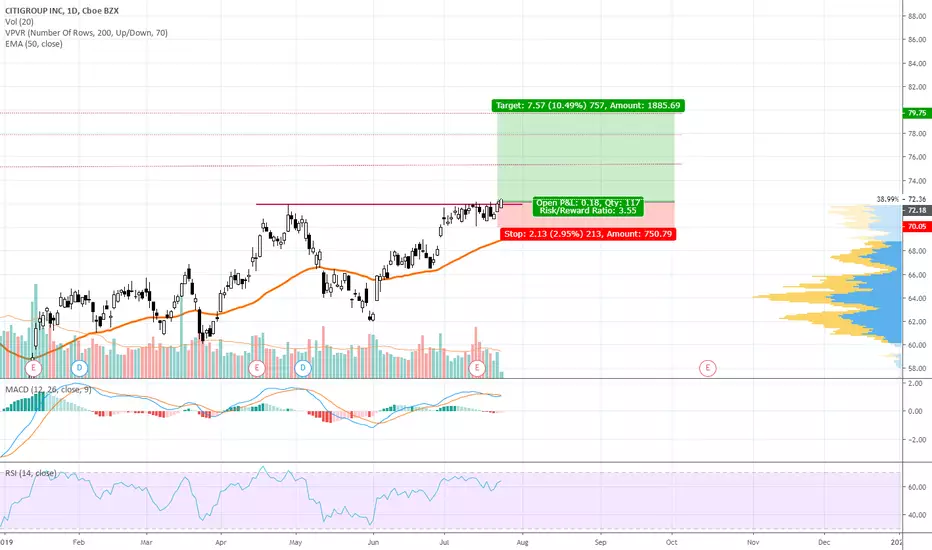
Buying Citigroup $CAiming for a 10% gain on my entry at $65.15, stop loss at $61 and take profit at $72. Price should be rebounding off the bottom trend line after testing it and headed back to the top, the RSI hit at 30 at the time of testing showing it was also oversold, and volume is normal. Estimated trade length 20-40 days.

Buying Citigroup $C Aiming for a 10% gain on my entry at $65.15, stop loss at $61 and take profit at $72. Price should be rebounding off the bottom trend line after testing it and headed back to the top, the RSI was at 30 at the time of testing showing it was also oversold, and volume is normal. Estimated trade length 20-40 days

Citigroup on trend aloneIf earnings exceed estimate expecting a sizaable growth from Citigroup in continuation of trend

Earnings Play Day Trade C on Monday the 15th of July C has earnings tomorrow Monday the 15th. It looks more bullish than bearish. Its making higher highs and higher lows and its above all its major moving averages 20ema,50sma,100sma,200sma. Recently its been hitting the overhead resistance area around $72.00. If it breaks out of the 72 daily resistance then it has room to go up until around $73.30. On the bearish side, it could go back and fade to its 20 ema daily at $69.63. I would be more inclined to go Long on it rather than Short it, due to the reasons mentioned above. The market sentiment is critical here as it needs to be in line with the SPY for the trade to work. The general expectations is that the earnings reports would be positive, so we shall see on Monday how C will play out. Remember this is a stock that doesn't make huge moves, and it has a lot of liquidity so its safer to trade than some other stocks like CMG.
