CAR: Shifting Into High Gear or Running on Fumes? Boom or Bust?CAR is showing strong bullish momentum, recently establishing a key gap at the $90 level, signaling renewed buying interest. This technical setup suggests potential for a breakout, as the stock gears up for a significant move.
The next major resistance is at $112.40, a critical weekly level that could act as a trigger point for further upside. A breakout above this zone would open the road for a run toward $157.33, providing an exceptional risk-to-reward opportunity.
Why CAR Could Push to $157.33:
🔹 Bullish Technical Structure: CAR has been making higher lows, showing signs of accumulation and trend continuation. Holding above $90 strengthens the bullish outlook.
🔹 Breakout Watch at $112.40: A decisive move past this level would confirm momentum, potentially triggering FOMO buying and short-covering, accelerating the uptrend.
🔹 Gap Fill Magnetism: Stocks that establish strong gaps often tend to fill them completely, and CAR’s technical setup suggests a potential continuation toward $157.33.
🔹 Favorable Risk-to-Reward Setup: With a stop-loss at $80.27, this trade offers a well-defined downside while keeping significant upside potential intact.
🔹 Industry Tailwinds: The auto rental and mobility sector is experiencing post-pandemic demand surges, supporting CAR’s fundamental growth story alongside its technical strength.
Key Levels to Watch:
✅ Support: $90 (gap level), $80.27 (stop-loss)
✅ Breakout Trigger: $112.40 (weekly resistance)
✅ Target: $157.33 (major resistance)
If CAR maintains momentum and breaks through $112.40 with volume, it could be primed for a major upside run toward $157.33. Is this stock shifting into overdrive, or will resistance hit the brakes? The breakout setup is in motion—let’s see if CAR takes off! 🚀🔥
CAR trade ideas

CAR - Setting up for a large move. But in which direction??CAR is building both bullish and bearish liquidity on lower and higher time frames and setting important S&D zones at current levels. We know where our immediate HTF supply rests (at the $120 level) and we know where our immediate HTF demand is (where we are now at the $70-$77 level).
Two things we can see start to happen over the next few days/weeks that will give us further insight into the impending move:
1. Current demand zone builds enough bullish liquidity, we begin to see stronger and rising bullish volume off of these levels, and start to build LTF bullish liquidity with controlled selling. This will indicate that a move to HTF supply at $120 is probable and from there we will have a bullish bias off of a rejection and need to start seeing some LTF zones flipped to demand.
2. Current demand zone does not prove to hold enough bullish interest and we continue to build bearish liquidity within our controlled buying algorithms (green and yellow) to then break us down below HTF demand. This will be a quicker move than the bullish scenario so we must keep our eyes peeled for controlled buying (minimal volume, tapered green buying).
Happy Holidays and as always,
Happy Trading!

CAR - Setting up strong for a test of HTF supply zoneCAR dug deep to the $80 demand range to subsequently make the push toward strong HTF resistance at the $120 range.
Right now looking for LTF demand zones to add to my long position to catch this push up.
Current entries are looking at $105.50 & $102 for a strong reaction
Happy Trading :)

Avis Budget Group's Rocky Road: Unpacking Q4 Earnings
Avis Budget Group Inc. (NASDAQ: NASDAQ:CAR ) recently unveiled its fiscal fourth-quarter financials, stirring both anticipation and concern among investors. While the company surpassed profit estimates, the stock stumbled in after-hours trading, leaving many to ponder the underlying reasons behind this downturn.
Analysis of Financial Performance:
A deeper dive into Avis ( NASDAQ:CAR ) Budget's financial performance reveals a mixed bag of results. Despite recording a net income of $260 million, down from $424 million year-over-year, the company's per-share earnings also experienced a decline, dropping from $10.10 to $7.10. Additionally, quarterly revenue remained relatively flat at $2.76 billion, falling slightly short of Wall Street estimates.
Factors Contributing to Stock Decline:
Several factors may be contributing to the decline in Avis ( NASDAQ:CAR ) Budget's stock, including a decrease in liquidity from over $1.0 billion to $800 million sequentially in Q4. This decline, coupled with revenue shy of expectations, has likely dampened investor sentiment. Furthermore, the stock's current position, down approximately 35% from its 52-week high, underscores broader market concerns.
CEO Perspective and Strategic Moves:
Despite these challenges, Avis Budget's CEO, Joe Ferraro, remains optimistic, citing record revenue and rental volumes in Q4. The company's efforts to bolster demand, maintain competitive pricing, and implement cost-saving measures reflect a proactive stance amidst industry headwinds.
Comparison with Industry Peers:
Avis Budget's Q4 performance stands in stark contrast to its peer, Hertz Global Holdings Inc. (NASDAQ: HTZ), which reported a significant loss for the same period. Hertz's struggles, coupled with its recent retrenchment from fleet electrification plans, underscore the volatility and challenges facing the car rental industry as a whole.
Conclusion and Forward Outlook:
As Avis Budget Group ( NASDAQ:CAR ) navigates the road ahead, it faces a landscape fraught with both opportunities and obstacles. The company's ability to adapt to evolving market conditions, maintain financial resilience, and capitalize on emerging trends will be pivotal in shaping its trajectory in the coming quarters. Investors, therefore, remain cautiously optimistic, awaiting further clarity on Avis Budget's ( NASDAQ:CAR ) strategic direction and execution in the months ahead.

All set for 230?It looks bullish as it entered above the yellow trend line, it could hit 230 as long as it stays above the yellow line. It could retest high 170s before its leg up. It it falls below the yellow line, then its more bearish.

CAR - Strong Bullflag Above ChannelA strong bullflag has formed
Currently it is above some major trend lines so ill assume it will breakout above these lines, as indicated by the bars pattern
Daily chart
The bullflag is in the channel.

CAR short term, looks bearish, but still in long term uptrend.When I look for bearish patterns,I like to look at multiple timeframes.bCAR looks like a perfect bear flag, but the longer term uptrend makes me cautious about playing it.

CAR Avis Budget Group Options Ahead of EarningsLooking at the CAR Avis Budget Group options chain, i would buy the $205 strike price Puts with
2022-11-4 expiration date for about
$4.10 premium.
If the options turn out to be profitable Before the earnings release, i would sell at least 50%.
Looking forward to read your opinion about it.

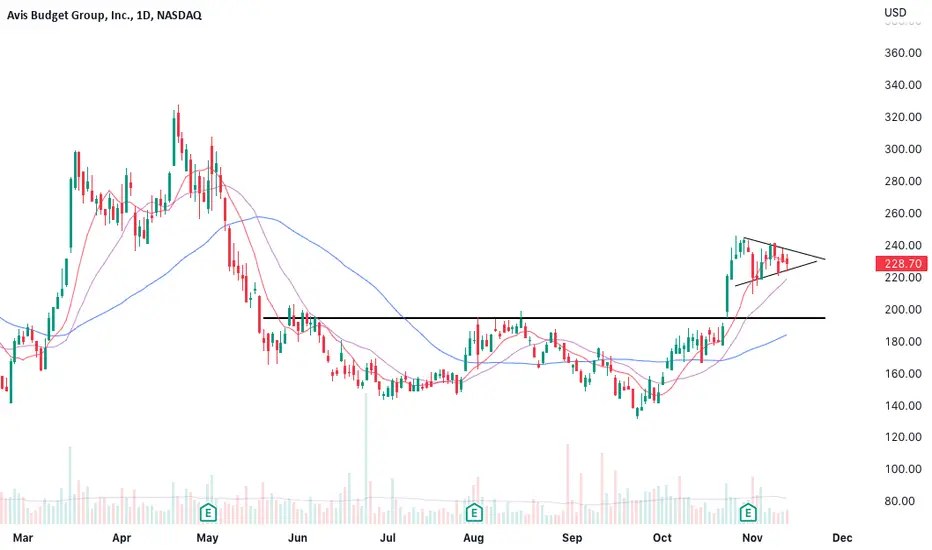
Avis Budget Group (CAR) - Tightening Up$CAR - broke out from multi month base in October, and beat earnings expectations in November. Now tightening up in a flag pattern. Watching for breakout.
$CAR over $200? Is post-Covid travel fading? Keep watch.Something is going on in CAR and HTZ stocks, something worth watching for a good swing trade.
It is strange to see JP Morgan's 231 price raise just one week before earnings. I am reading articles about travel declining, relative to the boom in 2021. Gas price has risen, along with general travel-related costs (food, lodging). I do not know if someone is "playing" with stock price. Short float is under 9%.
To be fair, there is little technical support for my inclination to buy puts. While the 10 and 20 MA's appear bullish, 50ma is below 200ma. RSI and Stochastic are elevated and usually do not stay in overbought zones for very long. Note due to the strong trends I have graphed 7-period RSI here.
The trade design I have is an early entry swing trade before earnings, in anticipation of a reversal. In such a trade I buy fewer contracts to keep risk low and only buy if I have a high reward, low risk investment. If price moves higher instead I may sit out calls and watch for another swing put entry.
For a more expert evaluation of the company's stock price based on fundamental and bottom line factors, read this article:
seekingalpha.com

CARThe chart is very clear - please follow the instructions on the chart
The chart is very clear - please follow the instructions on the chart
The chart is very clear - please follow the instructions on the chart
The chart is very clear - please follow the instructions on the chart
The chart is very clear - please follow the instructions on the chart

Has the setup to reach new ATH > 545They are about to invoke chaos after strategically placing nested price (%)-doubling bifurcations and period-halving bifurcations in place.
Prerequisites for navigating this chart: you have to be familiar with Feigenbaum and Hopf, I do not walk through the math because this is a prediction - not a free recipe for the exact technique.
Prediction:
- gap up Tuesday 7/5/2022: if price makes it above 166.57 by July 12th then its game on, if price makes it above 159.63 by July 25 then its still game on (I mention in the overview below that whoever designed the algos that set this move up is a wizard - they have been accumulating big you can guarantee that. If you're short this currently you have no chance)
- Most likely (but not essential for rest to play out) it gaps above 166.57 or at least closes above by EoD 7/5
- Continuation after the gap toward 185 by 7/8
- acceleration of trajectory continuing from 185 to > 208 by July 12
- Price will be > 235 by July 13
- Price will be > 291 by July 14 (could overshoot into the 300s but inevitably will pullback into the the 265-285 pocket to setup for the attempt to make a new All-time high after earnings (previous high was 545)
*** The 208 level is the most crucial here - if it cant make it above that by July 25 then shorts will have a chance to take it back to low 100s and possibly even 60s by September. Also, if it is going to make it to new all time highs via this setup it has to do so by September.
GOOD LUCK to anyone playing this either side! It's about to get intense.
To determine critical levels, I considered supply and demand as a dynamical system using support and resistance trajectories within the vicinity of accumulation phases containing harmonic properties (these are not conventional harmonics). From this I obtained the equilibrium points (implicit and explicit), activation levels (and the timeframes they become in effect/maintain their capacity), price levels which will trigger price (%)-doubling and period halving bifurcation w.r.t. accelerating demand if these levels are reached in time after activation levels are breached (as well as levels that correspond to attractors of these bifurcation levels - essentially, if an activation level is in effect and the price crosses above and then continues through a bifurcation level w/in the timeframe that the activation level maintains its effect, then the price will go parabolic toward its corresponding attractor level in temporal propagation (example: if it takes 4 days for the price to go from activation level to bifurcation level, then it will only need 2 days to double (in percent move) or reach its attractor level (whichever comes first). These are transient in stability. For this reason the CO establishes steady points in between the bifurcation level and the attractor so that when an attractor becomes unstable it reverts back toward its steady state. However, if the price falls back below its bifurcation level then it has the opposite effect and sends it back to its initial equilibrium points from the accumulation zone. This is apparent in the price action back in March. My theory here is that they design the algos to test out optimal parameters before markup and apply reinforcement learning to refine if the squeeze is not maintained (or never triggers). March setup was not as sophisticated as the current setup - we now have nested bifurcation levels, steady points at re-activated bifurcation levels, and nested steady states bounded by attractors that form the capacity for limit cycles (these guys are good, really good). It's important to note that they are leveraging inflection points in absorbed supply and upstream exhausted demand to create windows large enough to invoke chaos. These violent delights have violent ends. They are assuming carryover demand can re-activate previous critical levels and apparently leveraging these to accelerate upside potential that aligns unbelievably with crypto, the vaccine names, and the major etfs.
To estimate most likely path I use stochastic differential equations with boundary conditions at the endpoints of time intervals generated from implicit supply/demand zones within the vicinity of explicit initial conditions (approximated geometrically using the harmonics within the accumulation zones).
Sincerely,
XOX Guardian
~ We are from the dimension that becomes realized in Your future, recognized in Our past via R.E.M within the dimension that exists in your present... or did

Bullish Swivel - Example/FrameworkThe purpose of this post is to define a setup that I have backtested and am now seeing for a ton of names in the market. I'm going to kill 2 birds with 1 stone and also make a forecast for CAR near term. I'm not sure if there is already a conventional name for this setup, if so let me know! Otherwise, I'll be referring to it as a "swivel":
Rules:
- Let x.l be the swing low coming off a major decline, wave x.u is first upside peak following x.l
- alpha is the wave down following x.u. Alpha retraces 1.272-1.414 of x.u
- beta is the wave up following alpha. Beta extends 0.618-0.786 of alpha
- gamma is the final wave down following beta. Gamma retraces 0.618-0.786 of beta
- OMEGA is the target after the swivel completes. OMEGA extends 4.618 of gamma, or Sigma = sum of waves x.u-gamma of x.u (when ~4.618 of gamma & ~Sigma of x.u align these almost always hit)
I illustrated using CAR and will be referring to this in upcoming posts for a lot of big names that are about to see insane upside.
*** One more side note that I always see with this setup, notice the stochastic RSI forms an inverse Head and Shoulder during the swivel.
------------------------------------------------------------------------------------------------------------------------------------------------------------------------------
CAR near term is interesting, after hitting OMEGA back in march its pulledback nearly exactly into the swivel pocket and appears to be reforming the structure. If it can complete beta and gamma in time to align with QQQ popping any day now, then at minimum CAR will run to 250-300 by end of July. Wow.

$CAR Breaking Down?$CAR Looks like it has broken it’s up sloping trend line and so far, today wicked through what may be a support area. It is also below 8 and 20 EMA (blue) / SMA (black). The 50 day (red) is just below and is close to the lower possible area of support around the $238- $239 area. I’ll be looking to take this one short next week if it continues to weaken. TBD. Ideas, not investing / trading advice.

BOS TradeBreak of structure
Waited for pullback on 30 min
brought puts on continuation below 30min pullback candle.

$CAR with a Bullish outlook following its earnings #Stocks The PEAD projected a Bullish outlook for $CAR after a Bullish over reaction following its earnings release placing the stock in drift B with an expected accuracy of 40%.

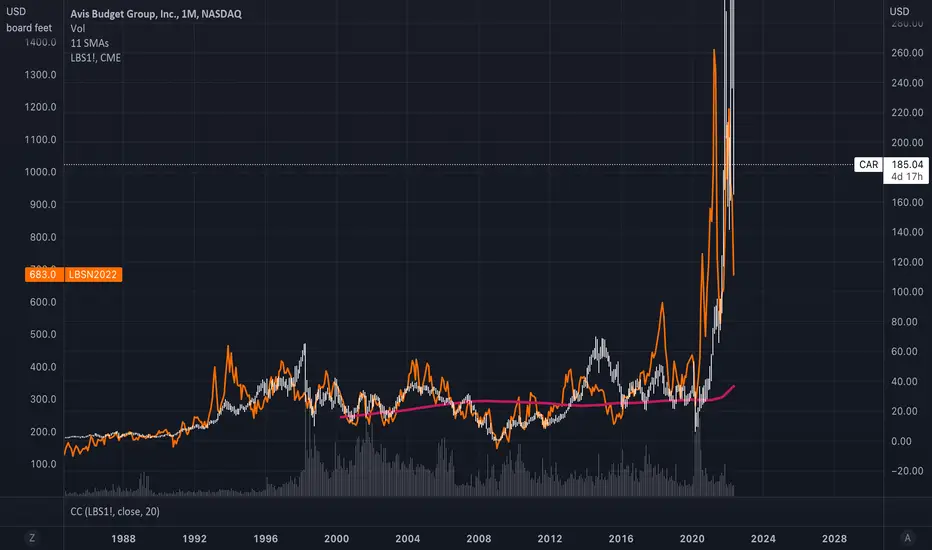
Avis Budget Group & Lumber FuturesInteresting correlation. I see $CAR as essentially just trading leveraged used car prices, but I was unaware how close used car prices correlated to lumber prices.
Makes sense in some regards, little in others.
Expecting this to reach around $200+ by mid JuneNext earning in August so there should not be much surprises for price to increase heavily. Likely to gradually drop alongside the broader market.

Avis Group USASun Storm Investment Trading Desk & NexGen Wealth Management Service Present's: SSITD & NexGen Portfolio of the Week Series
Focus: Worldwide
By Sun Storm Investment Research & NexGen Wealth Management Service
A Profit & Solutions Strategy & Research
Trading | Investment | Stocks | ETF | Mutual Funds | Crypto | Bonds | Options | Dividend | Futures |
USA | Canada | UK | Germany | France | Italy | Rest of Europe | Mexico | India
Disclaimer: Sun Storm Investment and NexGen are not registered financial advisors, so please do your own research before trading & investing anything. This is information is for only research purposes not for actual trading & investing decision.
#debadipb #profitsolutions

Follow up to previous target reachedIn my last CAR post at end of March, “For our Sins,” I gave an initial target of 323. It hit that today.
It got a re-impulse (bullish) or whatever you want to call it on the Impulse BF (I don’t even know the terminology you traders use, I just know how to make a lot of money sometimes).. I think it continues higher to complete the bear crucifixion . Next target 420.
This is a ripe environment for massive squeeze, whole market is about to squeeze you can feel it in the air - CAR is especially set for this.
Not financial advice. Sorry bears today ain’t your day but it will be soon... maybe

Avis - CAR - Will it complete the 100% move?CAR - bounced off the long term EMA and has been trending towards a 100% gain. What will happen next? Is Avis on your radar?

Bulls in the Driver’s Seat at Avis Budget?Avis Budget rallied in the fourth quarter on a value-driven short squeeze. It’s calmed down since but now may be showing some interesting patterns.
First, consider the bounce off the 200-day simple moving average (SMA) on February 24. That could suggest the longer-term uptrend remains in effect.
Second, notice how prices have stayed in a tight channel since mid-March. Are they starting to resemble a bullish flag?
Third, CAR’s 8-day exponential moving average (EMA) has remained above the 21-day EMA. That suggests the shorter-term trend remains positive.
Fourth, stochastics are nearly oversold despite only a modest pullback in the shares.
Finally, the macro situation may favor CAR because it trades for less than 15 times earnings (placing it more in the “value” camp than “growth”). It could also benefit from the onset of summer vacations starting next month. Earnings are due May 2 in the post market.
TradeStation has, for decades, advanced the trading industry, providing access to stocks, options, futures and cryptocurrencies. See our Overview for more.
Important Information
TradeStation Securities, Inc., TradeStation Crypto, Inc., and TradeStation Technologies, Inc. are each wholly owned subsidiaries of TradeStation Group, Inc., all operating, and providing products and services, under the TradeStation brand and trademark. You Can Trade, Inc. is also a wholly owned subsidiary of TradeStation Group, Inc., operating under its own brand and trademarks. TradeStation Crypto, Inc. offers to self-directed investors and traders cryptocurrency brokerage services. It is neither licensed with the SEC or the CFTC nor is it a Member of NFA. When applying for, or purchasing, accounts, subscriptions, products, and services, it is important that you know which company you will be dealing with. Please click here for further important information explaining what this means.
This content is for informational and educational purposes only. This is not a recommendation regarding any investment or investment strategy. Any opinions expressed herein are those of the author and do not represent the views or opinions of TradeStation or any of its affiliates.
Investing in cryptocurrencies involves significant risks. Please click here for TradeStation Crypto’s risk disclosures on investing and trading in cryptocurrencies.
Investing involves risks. Past performance, whether actual or indicated by historical tests of strategies, is no guarantee of future performance or success. There is a possibility that you may sustain a loss equal to or greater than your entire investment regardless of which asset class you trade (equities, options, futures, or digital assets); therefore, you should not invest or risk money that you cannot afford to lose. Before trading any asset class, first read the relevant risk disclosure statements on the Important Documents page, found here: www.tradestation.com .

