CDW - CDW Corp. (Weekly chart, NASDAQ) - Long PositionCDW - CDW Corp. (Weekly chart, NASDAQ) - Long Position; Mid-term research idea.
Risk assessment: Medium {support structure and market structure integrity risk}
Risk/Reward ratio ~ 2.91
Current Market Price (CMP) ~ 146
Entry limit ~ 138 on April 04, 2025
1. Target limit ~ 154 (+11.59%; +16 points)
2. Target limit ~ 164 (+18.84%; +26 points)
3. Target limit ~ 170 (+23.19%; +32 points)
Stop order limit ~ 127 (-7.97 %; -11 points)
Disclaimer: Investments in securities markets are subject to market risks. All information presented in this group is strictly for reference and personal study purposes only and is not a recommendation and/or a solicitation to act upon under any interpretation of the letter.
LEGEND:
{curly brackets} = observation notes
= important updates
(parentheses) = information details
~ tilde/approximation = variable value
-hyphen = fixed value
CDW trade ideas

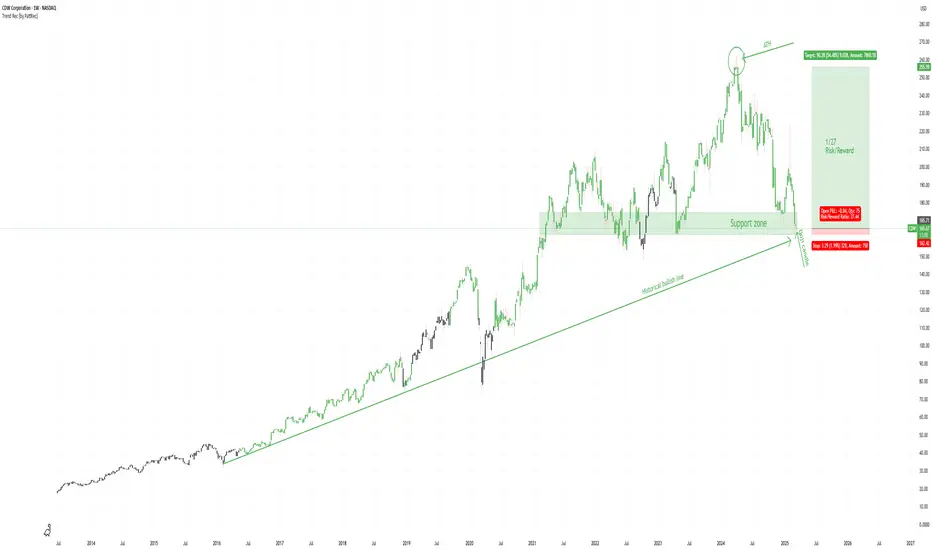
CDW Bullish Setup – 1:27 R:R at Strong Support with Doji CandleNASDAQ:CDW has arrived at a strong support level, aligning with a historical bullish trendline, making this a key area to watch. The all-time high (ATH) is not far off, offering a great upside potential if the stock rebounds from here.
A doji candle has now formed at support, signaling indecision and a possible reversal. With a 1:27 risk-to-reward ratio until ATH, this setup presents an attractive buying opportunity if momentum picks up.
Watching for confirmation of a bounce! 📈🚀
CDW Corporation: Bullish Trap or Breakout Play?NASDAQ-CDW at a Pivotal Moment—Can Bulls Hold the Line?
CDW Corporation (NASDAQ: CDW) is standing at a crossroads. The stock currently trades at $199.14, recovering from its January lows but still 24.3% below its all-time high of $263.37 set in April 2024. With a key resistance looming at $200.31, traders are asking: Will this level act as a launchpad for further gains, or is this the last breath before a deeper pullback?
Technicals present a mixed picture. On one hand, RSI (14) is hovering at 56.44, keeping the stock in neutral momentum, while MFI (60) at 48.22 suggests liquidity is balanced. The 50-day moving average sits at $195.92, reinforcing a support zone, yet sell volumes have increased over recent sessions. Recent candlestick patterns indicate a battle between bulls and bears, with sell volume spikes on January 31st hinting at potential exhaustion.
So, what’s next? Will CDW break above resistance and retest higher levels, or are sellers about to regain control? Stay tuned—this could be the breakout (or breakdown) of the month.
CDW Roadmap: Navigating the Market Waves
CDW Corporation (NASDAQ: CDW) has been riding a turbulent wave of buying and selling forces, creating a roadmap of high-impact trading signals. By breaking down recent validated patterns, we can see the key price shifts that traders should have caught—and what might come next.
January 27 – Buy Volumes Surge: Start of the Accumulation?
Opening at $192.13 and closing at $194.1, this session kicked off a strong bullish impulse. A classic Increased Buy Volumes pattern formed, signaling that buyers were stepping in near the lows. The movement of +3.49% indicated a clear upward drive, setting the stage for continuation.
January 28 – Confirmation of Strength
Another Increased Buy Volumes signal appeared, reinforcing bullish control. The price climbed to $194.56, and despite some hesitation, the closing candle suggested buyers were still in the game.
January 29 – Trap or Breakout? The Sell Shakeout
A sudden shift—VSA Manipulation Sell Pattern 1st appeared. Despite an opening near $195.15, price action reversed downward to $194.69. This was the first sign that sellers were lurking, potentially setting up a fake breakout to trap late bulls.
January 30 – Sell Pressure Grows
A Sell Volumes Takeover pattern developed, pushing CDW to $197.7 at the close. Bulls absorbed some pressure, but the next move would decide the fate of the trend.
January 31 – The Decision Zone
Sellers made their presence known. Increased Sell Volumes took over, with CDW slipping from $199.31 to $199.11. With the price rejecting the $200.31 resistance, traders had to decide—was this a healthy pullback or the start of a larger downtrend?
What’s Next?
The last confirmed direction was bearish, but with price hovering near resistance, we’re at a pivotal moment. Will buyers reload for another push higher, or are we gearing up for a deeper correction? Keep an eye on the next patterns—this roadmap is far from over. 🚀
Technical & Price Action Analysis: Key Levels in Play
CDW Corporation (NASDAQ: CDW) is testing critical levels that could dictate the next major move. If these zones hold, they’ll act as springboards for the next leg up—but if they fail, expect them to flip into resistance. Here’s what’s on the radar:
Support Levels to Watch:
$173.35 – First line of defense; bulls need to hold this to keep the uptrend alive.
$159.06 – The key retracement zone; failure here opens the door to lower levels.
$155.63 – Last stop before sellers take full control.
Resistance Levels to Break:
$200.31 – Immediate challenge; a breakout could fuel a push higher.
$213.00 – A major hurdle that aligns with previous liquidity traps.
$222.98 – If bulls take control, this is the next big test.
$226.67 – Where things get serious; failure here would signal exhaustion.
$239.45 – The ultimate upside target for now.
Powerful Support Zones:
$222.04, $232.57, $245.92 – If the trend stays strong, these levels will act as deep re-entry zones for dip buyers.
Powerful Resistance Zones:
$174.90, $158.66 – If these levels get rejected, expect a heavier correction.
Trading Strategies: Riding the Fibonacci Rays
The VSA Fibonacci Rays provide a roadmap for dynamic price interaction, where movements are dictated by liquidity, market psychology, and technical confluence. These rays aren't just static levels—they adapt as the market evolves, defining key zones where price is most likely to react.
Every trade setup is based on price interacting with a ray, confirming direction, and then targeting the next ray as the first milestone. Moving Averages (MA50, MA100, MA200) act as additional dynamic resistance and support.
Scenario 1: The Bullish Playbook 📈
Break Above $200.31 – The Path to Strength
If price interacts with a VSA Buy Ray near $200.31 and confirms strength, we target:
First Target: $213.00 – A historical liquidity pocket
Second Target: $222.98 – Next dynamic resistance zone
Final Target: $226.67 – The last stronghold before a trend shift
Dips to $195.92 (MA50) – The Reload Zone
A pullback to MA50 ($195.92) that aligns with a buy ray could be a prime entry:
First Target: $200.31 – Retesting resistance as support
Second Target: $213.00 – If momentum builds
Break Above $226.67 – The Power Move
Clearing this level unlocks a potential swing trade:
First Target: $239.45 – The major resistance
Final Target: $245.92 – High-probability take-profit zone
Scenario 2: The Bearish Playbook 📉
Rejection at $200.31 – The Short Setup
If price interacts with a VSA Sell Ray and confirms weakness:
First Target: $195.92 – MA50 convergence
Second Target: $186.08 – MA200 key zone
Final Target: $173.35 – Deep support
Break Below $195.92 (MA50) – Bearish Acceleration
A failure to hold $195.92 flips structure bearish:
First Target: $186.08 – A critical test
Second Target: $173.35 – A strong demand zone
Break Below $173.35 – Downtrend Confirmation
A decisive move below this level signals a long-term shift:
First Target: $159.06 – The next buyer zone
Final Target: $155.63 – Extreme retracement zone
Key Takeaways:
✔️ Trade from ray to ray – Every breakout or rejection defines the next move
✔️ MAs act as dynamic validation – Moving Averages filter weak setups
✔️ No early entries – Let price interact with rays before committing
What’s Your Next Move? Let’s Talk!
Trading is all about precision and timing, and if you’ve made it this far, you already know the importance of levels and price reactions. Now it’s your turn—drop your questions in the comments! Want to see how this setup plays out? Hit Boost, save this idea, and check back in a few days to see how price respects the levels.
My private strategy automatically maps out all rays and key zones—if you’re interested in using it, send me a private message. It’s not public, but for those who want an edge, we can talk.
Need analysis for another asset? I got you. Some ideas I share for free, some traders prefer to keep their setups private. Let me know in the comments which assets you’re watching, hit Boost, and I’ll get to them when I can.
This method works on any asset—price moves in waves, and the rays show the roadmap. If you want a personal markup, just reach out. And if you want to stay ahead of the market, follow me here on TradingView—this is where I drop the insights first. 🚀

CDW Weekly major upside implied.CDW forming a bullish bat on the weekly. Major upside implied if the pattern is respected. RSI and HSI need to get above/stay above 50. Looking for RSI/HSI confirmation for an entry.

Bias Upside for CDW for 2025The price is approaching an immediate support level around $160–$165.
There is also a stronger support zone at $147–$150.
The price action in the next few weeks or the upcoming monthly candle will be crucial.
If we observe a rebound from the current levels, $160–$165 could be confirmed as a strong support area.
Additionally, the recent acquisition of Mission Cloud Services is a positive indicator for the company’s future growth prospects.
Bias Upside for 2025

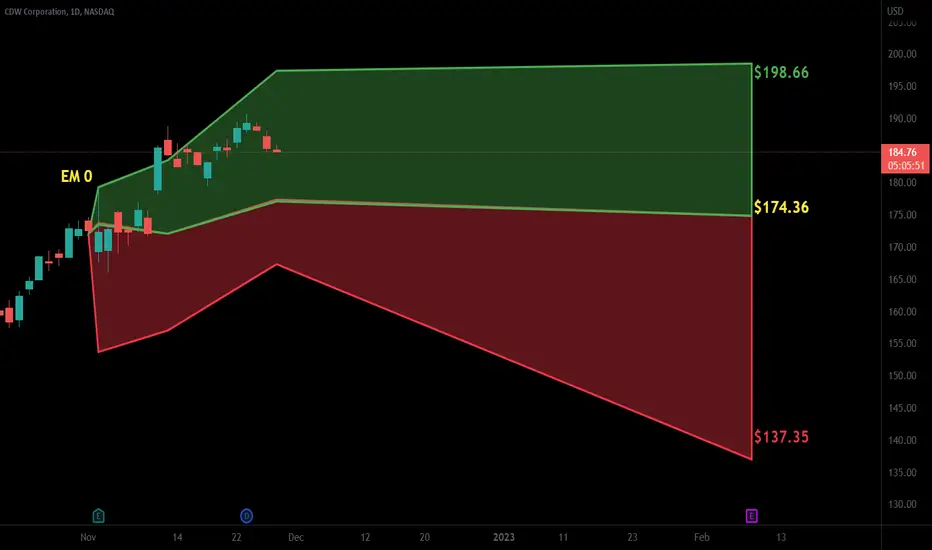
CDWIf this doesn't hold at current levels, I expect my box in the next couple years. Would take longs as an investment in my box. Thoughts?

Hitting 200 weeks average and bounce. Reversal?CDW has been punished for slow growth expectations and the price is hitting 200 week average. Given the new administration increases the spending (hoping some comes to educations and government upgrade), the price may be attractive to hold for long and long term, which buys the American corporation. Given that I do not know how erratic next 4 years would be. And, would personal computing (local - edge) be the thing of the past soon in AI era (data center driven)?
I am not a professional. I shared the thoughts, if anybody can add.

Pendulum pick CDW longI'm going to work on more of these stock picks since they are performing. I've been asking for more like the INSP idea posted a couple weeks ago, and this chart appears similar, so that's a good start.
I get some very bullish readings in the dowsing work on this, and the suggestion of a drop prior to liftoff (to around $204.89). That would be very much like INSP was.
I get some stuff about dates, which are the 15th, the 21st and 29th. I feel pretty strongly about the 15th because it came up twice. The others I'm not sure on so will wait and see.
The target is way up there, but I have suggestions of a pretty powerful move coming so we'll see!

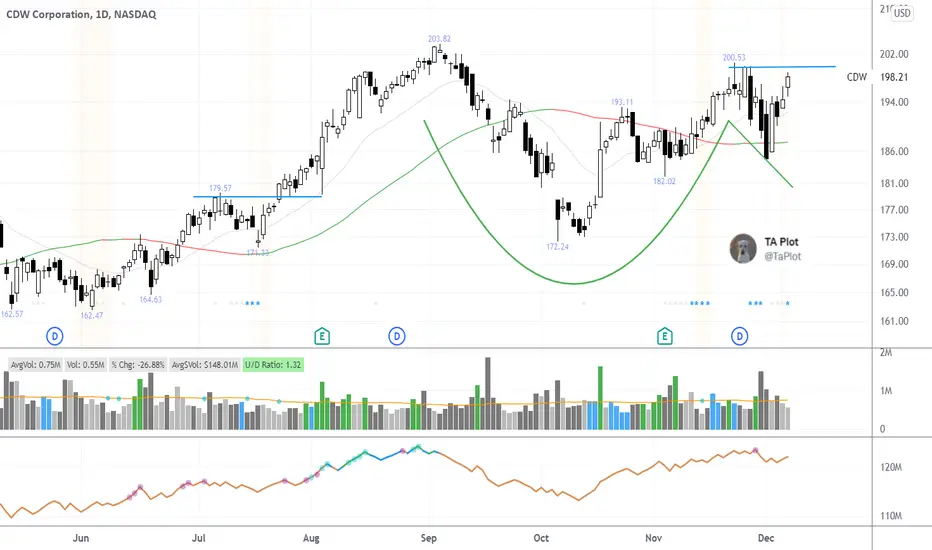
CDW - Cup / Bowl Structure A rounded structure that is looking to form due to the result of a higher low on chart
This will lead to continuation on different timeframes

CDW Long Target 280...STOP close below 208.71CDW Long Target 280...STOP close below 208.71...Good R/R ratio

CDW - Channel UpCDW is attempting a reversal at the bottom of this up channel
The vertical lines in green show the middle of the recovery in each situation
Bullish while within the channel

$CDW with a Bullish outlook following its earnings #Stocks The PEAD projected a Bullish outlook for $CDW after a Negative over reaction following its earnings release placing the stock in drift C with an expected accuracy of 100%.
$CDW with a Bullish outlook following its earnings #Stocks The PEAD projected a Bullish outlook for $CDW after a Positive Under reaction following its earnings release placing the stock in drift A with an expected accuracy of 87.5%.

CDW breaking out of a 5 month base with volume!* Perfect earnings
* Very strong up trend since inception
* High 3-month relative strength of 1.65 in the Tech sector
* Pays out quarterly dividends and just last quarter it increased its dividends!
* Broke out of a ~5 month base with volume
* Broke out late December and has been consolidating since then right above the breakout point
* Even with the uncertain market conditions it's managing to stay above the broken base.
Trade Idea:
* You can enter at today's closing price if you don't mind a little volatility.
* If you're looking for the perfect entry, you may wait for the price to turn a bit lower and enter near the $203.30 area
* Due to current market conditions it's better to wait and see what may happen.
* If you're a bit more conservative you may wait for a break above this current range and look for an entry near $207.72
Caution:
* A daily close below $198.14 would negate the idea.

$CDW 3 Months Cup with Handle$CDW putting in a 3 months cup with handle base.
Don't like that angle of attack the last 3 days so want it to see it quiet down here. For now, its on my secondary watchlist to keep an eye on it this week.
CDW BreakoutVery decent uptrend
Price well above 200 DMA
SUpported by high volume
Dividend paying stock


$CDW Inverse (Continuation) Head and ShouldersCDW setting up a nice head and shoulders continuation pattern with a possible breakout into All Time Highs (ATHs)
CDW (CDW)- PROVIDES INFORMATION TECHNOLOGY HARDWARE AND SOFTWARE PRODUCTS TO CUSTOMERS IN THE U.S., U.K. AND CANADA.

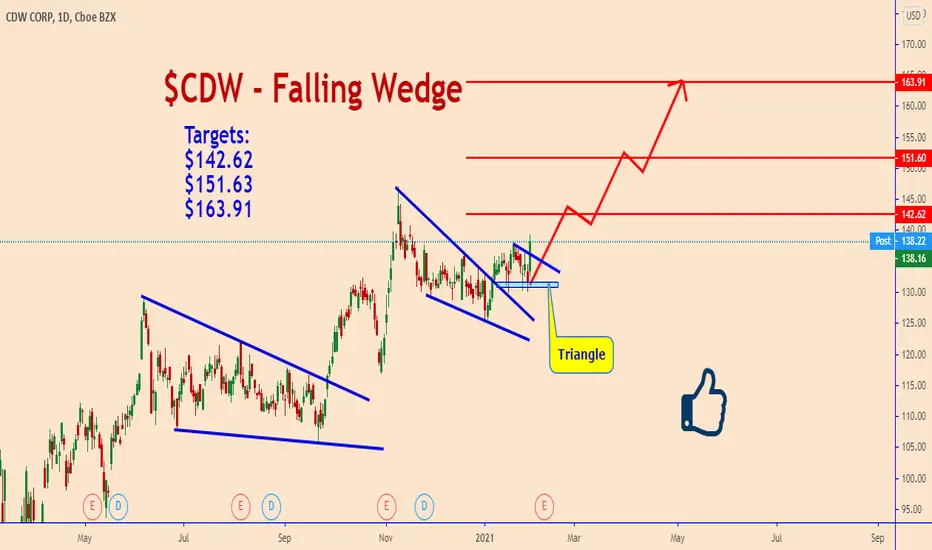
CDW: A Bunch Of Classic Patterns$CDW - Falling Wedge
Targets:
$142.62
$151.63
$163.91
Thank you and Good Luck!
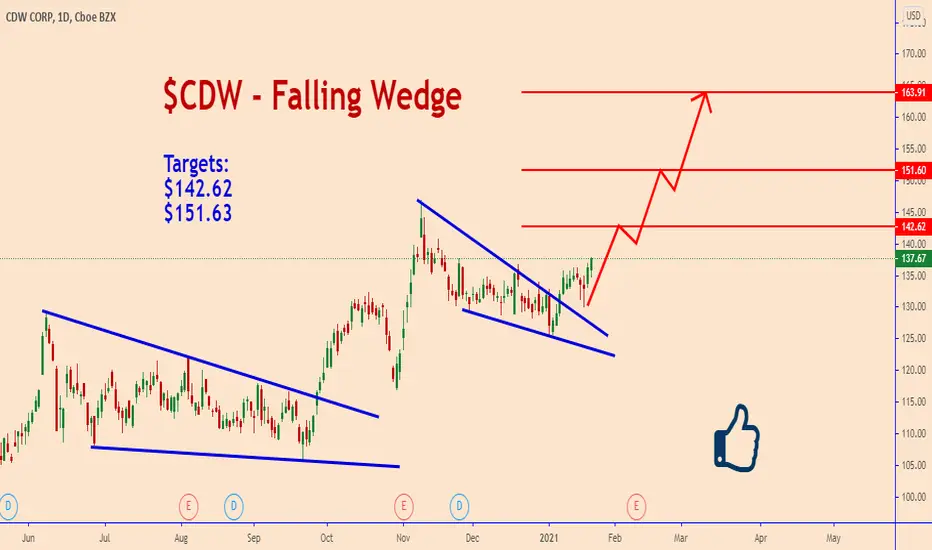
CDW: Look At The Price Reaction - BUYCDW - as we can see from the previous pattern the price did a very nice move after the pattern completion.
Targets:
$142.62
$151.63
Thank you and Good Luck!
CDW CORP CHART DailyHello traders, CDW CORP is in a fake bearish configuration with stable buying volume and a shadow of sellers. In the TIMEFRAME 1Min shows us a bull line that says the price is going to go up. Great likelihood of going to the last previous high point and pass the two following supports. View the TIMEFRAME 4 H or sellers will leave it artificially mounted to collapse the price. And since we have several purchase volumes, there is a good chance that the sellers will make their comebacks.
Please LIKE & FOLLOW, thank you!
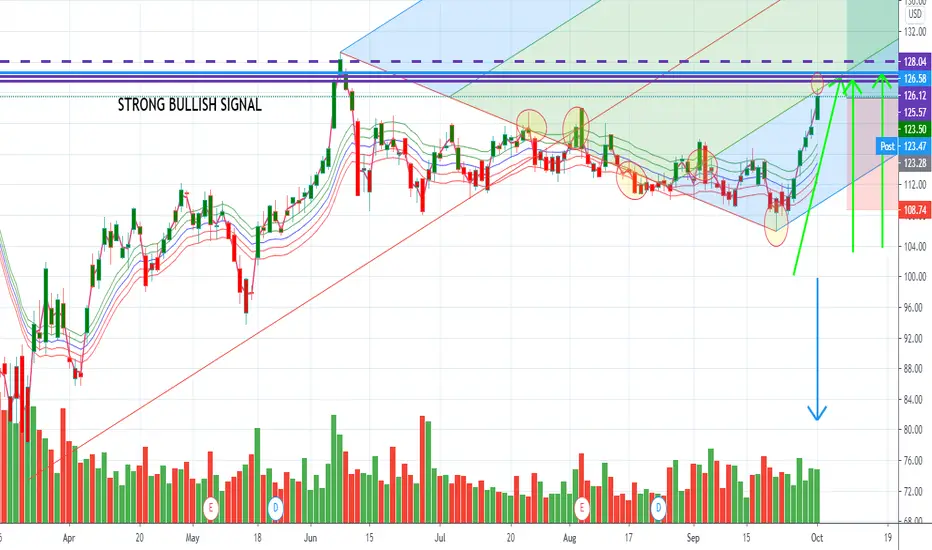
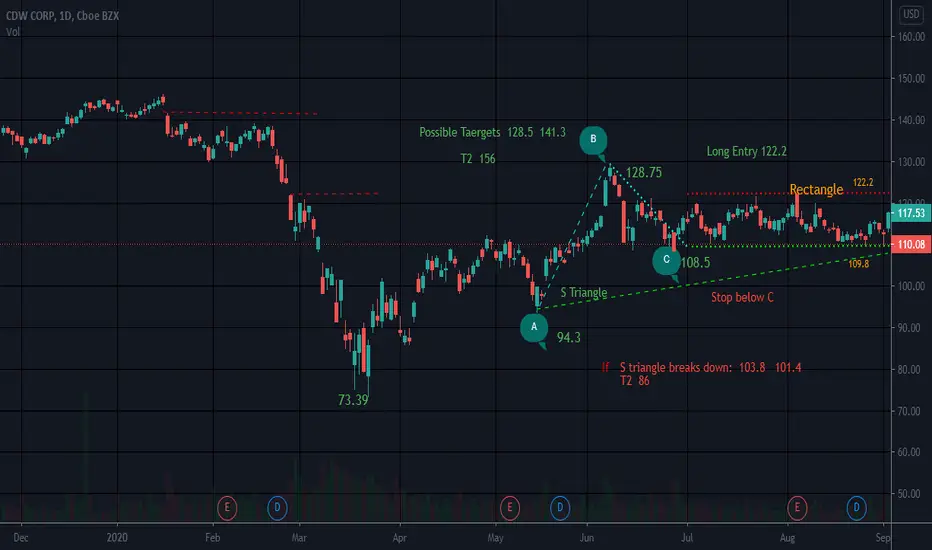
Rectangle S Triangle ABC BullishBB contracting..Looks like it will bust a move soon..in a squeeze
NV is high short interst low
A lot going on in this chart//there is also a falling wedge and if price breaks over 166.6 it will be out of falling wedge..but needs to be an uptrend in place when price breaks up from falling wedge. Falling wedges are often bullish close to the bottom and can signal a reversal
A lot of work to do for this stock due to R above price. Guess it depemds on if you want it or not as it may be a struggle. S at 109.4
If it breaks up or down from rectangle..then mid rectangle is your stop either way it breaks
Not a recommendation