Target 204 for a reversal or above 200 before it breaks downIt is at a pivotal moment once again as resistance approaches, with indicators moving into overbought territory this looks certain for a swing and reversal.
CEG trade ideas

Death cross on the Stochastics 170 and that's conservativeI like the way this has positioned itself and would like to see a follow-through as a death cross on stochastic at an all-time high of 93, with a head-and-shoulders pattern formed; I personally don't see a breakout but rather a decline.

CEG has broke out of the pennant and is ready to RISEEThe pennant after the price run has broken out and is ready to rise

Just not there yet, close in the shadeSix pivots on resistance to 3 on support, very nervy, especially with 100 turning over to go on the downside. That being said, indicators are ready to rise, except on the Bollinger, we may have some more downside. The crossover could prove vital at this stage.

200 very close to the next level of supportIt will continue to go down due to the room at RSI and stochastic, but it will have potential. One piece of the puzzle is the EMA 100, which seems to be creeping up to 200; it is currently at 195.

$CEG Breaking out? Likely CEG attempting to break out of wedge trendline. Looking at the last candle, it closes marginally higher with an engulfing candle and more importantly a lower volume than previous day. Boom!

ConstelayshThinking about CEG, Thinking it should break my line. Looks like its above the 20. Thinking we may or may not have something here...

indicators headed one way up 220This is a chart that has been following the rules of support and resistance. With the current state of affairs, there is room to run on the stochastic, and the RSI and MACD still have room to go. The SMAA 100 at 189, getting closer to 200, may retrace to that level once it is time for a reversal.

The Bullish Case for CEGThere's been and could still be good buying opportunities for CEG here as we see an uptrend occur. In addition, FV gaps are being respected as seen with the purple rectangle (Wicks have entered into the triangle but price then bounce up & out). I think we could continue to see a steady increase in CEG stock price

still bullish to test highIt seems like it will go higher or maybe retrace from the 233 region unless it goes higher than the last high before a correction is seen.

$CEG A nice break out after 1 month rangeSimilar play with NYSE:VST and NYSE:NRG
Looks like AI utility names are not going to stop.

$CEG Reversal on its wayI like this stock for it's unique offer of sustainable utilities services and supplies 10% of US market. Increasing volume as it reverses and sitting on 8 EMA.
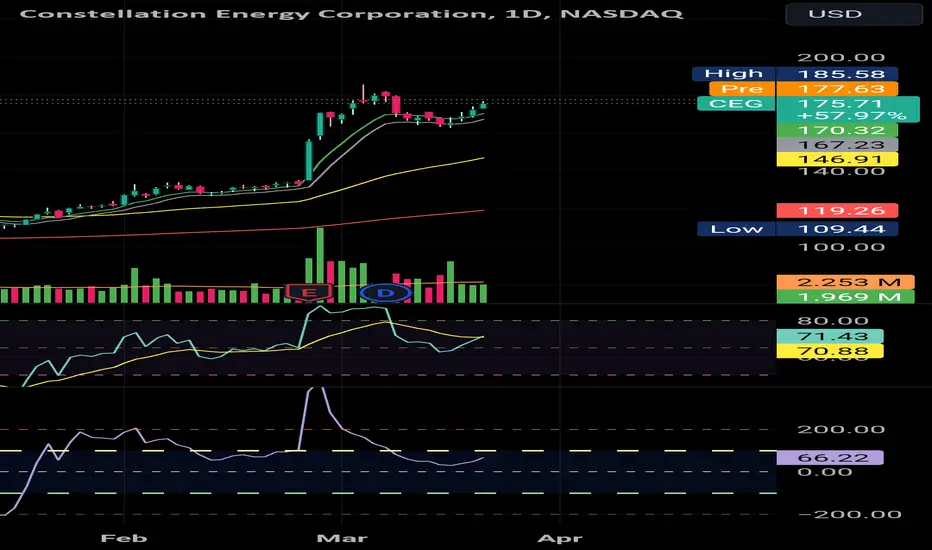
CEG Entry, Volume, Target, StopEntry: with price at or slightly above 110.26
Volume: with volume greater than 1.5M
Target: 119.60 area (this is an area, no guarantee it reaches this price, but you should be selling on the way up)
Stop: Depending on your risk tolerance; Based on an entry of 110.26 & target of 119.60, a stop at 107.15 gets you 3/1 Reward to Risk Ratio.
This LONG swing trade idea is not trade advice and is strictly based on my ideas and technical analysis. No due diligence or fundamental analysis was performed while evaluating this trade idea. Do not take this trade based on my idea, do not follow anyone blindly, do your own analysis and due diligence. I am not a professional trader.

$CEG Constellation Energy Corporation ( NASDAQ:CEG ) experienced a slight decline of -0.299% on the last trading day, Friday, 21st Jul 2023, with the stock price dropping from $96.89 to $96.60. Throughout the day, the stock fluctuated 1.79%, reaching a low of $96.42 and a high of $98.15. Over the past two weeks, the stock has shown a 5.77% gain, indicating periods of both upward and downward movement. However, it's worth noting that on the last day, trading volume increased by 1 million shares, despite the falling prices, which could be an early warning sign, leading to a slightly increased risk over the next few days. The total number of shares bought and sold amounted to approximately $291.72 million.
Currently, the stock is positioned in the middle of a narrow and strong rising trend in the short term, signaling the possibility of further upward movement. Based on the current short-term trend, the stock is expected to rise by 28.23% in the next 3 months, with a 90% probability of holding a price between $121.66 and $126.07 at the end of this 3-month period.
Signals and Forecast for CEG:
The Constellation Energy Corporation stock shows buy signals from both short and long-term Moving Averages, indicating a positive forecast for the stock. Additionally, there is a general buy signal based on the relationship between the short-term and long-term averages, with the short-term average above the long-term average. On price corrections downward, there may be some support levels at $95.72 and $92.40. However, a breakdown below any of these levels could issue sell signals. Furthermore, the 3-month Moving Average Convergence Divergence (MACD) also indicates a buy signal. While some negative signals were also issued, they may influence the near short-term development of the stock. A sell signal was previously issued from a pivot top point on Thursday, July 20, 2023, and so far, the stock has experienced a decline of -0.299%. This suggests the possibility of further decline until a new bottom pivot is established. The fact that volume rose on falling prices yesterday could be an early warning, indicating that the stock should be monitored more closely.

$CEG NASDAQ:CEG , Weekly cup , looking
for break of hod 95.53 ,
to swing some 96 calls
into a possible move to
98 , slow mover buy if
XLE is fire! we get it !
risking , 95

CorrectingAfter the outbreak at the beginning of May we've seen a straight upward move without any major correction. Now that the overall mood turns to the downside Costellation may want to follow this mood. A healthy correction may be needed to continue a possible rise. But as long to many people are sitting on profits there is always a danger of a correction to take profit to avoid losing parts of it.

CEG , LONGThis is from my TT's list , these stocks must meet the following 4 things :
Gaps from their highs to their lows
Exceptional RS vs SPY and QQQ
Tight moves no "loosey goosey stuff"
Above last GLB
TT's stands for "Top Trender's" , who doesn't like TT's ;)
Did not give us the best risk vs reward setup ( unless one was quicker at entering of-course) , stop is farther than I would like vs entry , but I anticipated and planned it in advance as one of my favorite of the bunch , it was this , ENPH or TH . I decided on this one . I only take entries in the final 30 min of the day so sometimes a stock moves a little more than I like in the day but that is one of the cons of my strategy , on the pro side , this method does a great job of filtering out false signals
Trade management -
Standard procedure ...

Constellation Energy $CEG leading the energy transition?Constellation Energy provides power, natural gas, renewable energy, and energy management products and services. They are the largest producer of carbon-free and low-emissions energy in the US.
NASDAQ:CEG is in a clear uptrend with great relative strength against its benchmarks. Just look at AMEX:XLE and NASDAQ:QCLN .
NASDAQ:CEG is clearly leading.
I see an actionable first buy at yesterday's high as that would cancel the outside reversal. It would be very bullish.
A second buy point is at $90.20, which would be an ATH.
Lets see if the MAs can hold the price.

Follow up to Constellation Energy CorporationVery interesting IPO, it has growing 140% this year and now is in ATH, It bounced on MA50 y just broken a Triple Top (3T). It belongs to a strong sector, can go up for the next weeks. The better way is waiting for a pullback NASDAQ:CEG

10/5/22 CEGConstellation Energy Corporation ( NASDAQ:CEG )
Sector: Utilities (Electric Utilities)
Market Capitalization: $29.200B
Current Price: $88.17
Breakout price: $89.45
Buy Zone (Top/Bottom Range): $86.80-$82.45
Price Target: $93.20-$95.00
Estimated Duration to Target: 21-23d
Contract of Interest: $CEG 11/18/22 95c
Trade price as of publish date: $3.00/contract

OutbreakWe have exceeded a rising wedge today within a clearly favourable market. It had looked like a banner stick until mid August but instead a correction we got this rising wedge from which we've been broken out today.

CEG - LongI did buy into CCEG on the breakout yesterday - frustratingly I couldn't post this as I was at an Expo.
Its breaking out from an area of very tight consolidation (and has previously had a very sharp move up!)
Tight stop + High RR

$CEG IPO Possibly Setting Up$CEG that i've posted about previously is now making it from my larger watchlist to my secondary WL.
Would be ideal if it puts an inside day tomorrow and come out Thursday (orange bars).
Will be watching it.
