COINBASE Bearish RSI Divergence Signals Impending ABC CorrectionCoinbase Global has completed a full wave cycle and is now positioned for a corrective leg toward the base of Wave 4, following a classic Elliott Wave structure. The unfolding scenario aligns with a potential ABC corrective move, with Wave A currently in development.
A strong bearish RSI divergence has also emerged price continues to make higher highs while RSI prints lower highs indicating underlying weakness and increasing the probability of a deeper retracement.
The strategic plan is to monitor for short opportunities or pullback zones as the market unfolds this corrective leg, with the base of Wave 4 serving as the target zone. All eyes on the momentum breakdown and support reaction.
💬 Share your views on this setup in the comments.
COIN trade ideas

Coinbase to fill the gap and touch 380 againCoin is still on the trend line and will get back to 380 again

COIN completed vawe 4I believed that vawe 4 completed and we will move up. Price turned from Ema 100 as well. I am Bullish in COIN

COIN Gamma Strom Incoming!!!🚀 COIN Weekly Swing Setup (2025-08-09) 🚀
**Bias:** 📈 **Modestly Bullish** — strong call flow + low VIX, but weak volume tempers confidence.
**🎯 Trade Plan**
* **Ticker:** \ NASDAQ:COIN
* **Type:** CALL (LONG)
* **Strike:** \$350.00
* **Entry:** \$0.90 (open)
* **Profit Target:** \$1.70 (+89%)
* **Stop Loss:** \$0.45 (-50%)
* **Expiry:** 2025-08-15
* **Size:** 1 contract
* **Confidence:** 65%
**📊 Key Notes**
* Call/put ratio 2.83 → strong bullish options flow ✅
* RSI mixed but recovering from oversold ⚠️
* VIX low → low gamma risk, favorable for option buyers ✅
* Watch volume closely at open for confirmation 🔍

COIN Gamma Storm Incoming!!!## 🚨 COIN Weekly Options Setup (Aug 7, 2025) 🚨
**Massive Call Flow vs. Bearish Momentum — Who Wins?**
> 🔍 Multiple AI models conflicted. Gamma risk rising. One day to expiry. Here's the trade...
---
### 🧠 Key Model Consensus (Across Grok, Claude, Llama, DeepSeek, Gemini):
✅ **Bullish Options Flow** from institutional players
📉 **Bearish Price Momentum** and RSI
⚠️ **High Gamma Risk** into expiration
🤔 **Signal Divergence** = Uncertainty + Volatility
---
### 🟩 **Bulls’ Case (Grok, Claude, Llama):**
* Oversold conditions + call buying = Rebound Setup
* Volume spike confirms institutional interest
* Moderate bullish lean with upside potential
### 🟥 **Bears’ Case (DeepSeek, Gemini):**
* Price action still weak
* Distribution pressure detected
* Recommending no trade or puts
---
### 📊 Trade Setup Summary
| Parameter | Value |
| -------------------- | ----------------- |
| 🎯 **Strike** | \$322.50 |
| 📅 **Expiry** | 2025-08-08 (1DTE) |
| 📈 **Direction** | CALL (LONG) |
| 💵 **Entry Price** | \$0.96 |
| 🎯 **Profit Target** | \$1.44 |
| 🛑 **Stop Loss** | \$0.57 |
| 📏 **Size** | 2 Contracts |
| 🔁 **Entry Timing** | Market Open |
| 🧪 **Confidence** | 65% (Moderate) |
---
### ⚠️ Risks to Watch:
* 1DTE = High volatility swings ⚡
* Momentum still leaning bearish 📉
* Gamma moves could trigger sharp reversals
---
📌 **Final Take**:
**Trade if you’re aggressive. Sit out if you’re cautious.**
This is a classic high-risk/high-reward setup driven by **options flow vs. price action divergence**.

CoinbaseLast week, on Friday, I re-entered my position on the long side of COIN. I bought 40 shares @ an average price of $301. Looking at the extended hours trading tonight, price is currently changing hands for $333.50/share. This means in my little position, I am up $1300 on a trade I was risking $200 for. I am always very picky with my trades, and it is for this reason. I don't need to trade every move the market makes. I only need to trade the high risk/reward ones. Things could change by the time market opens tomorrow, but as of now, I am already up almost 30% this year. That is by only making a handful of trades in only half of the year. As I constantly stress, patience is key in this game. Imagine 30% profits year-over-year. This is generational wealth when done for long enough. That is taking a $40k account to about $105 million in 30 years. If done for 40 years that equates to $5.2 BILLION. Do you have the patience to make 30% per year for 40 years?
My analysis currently suggests we are on the way up to the next target box that goes from $386-$422. This is the 0.618-0.854 of the minor A wave. The box is where I intend on exiting this position. If I can manage to hold onto these shares, and if price makes it to the target box, I am looking at a profit of about $3500 or 29%.
Minor A wave took about two weeks to complete. If minor B lasts for the same duration, we should conclude this move by the end of August. Don't forget, this is minor B wave according to my count, and thus, can last much longer and become very complex. Time will tell, for now though, I will concentrate on the upcoming week.

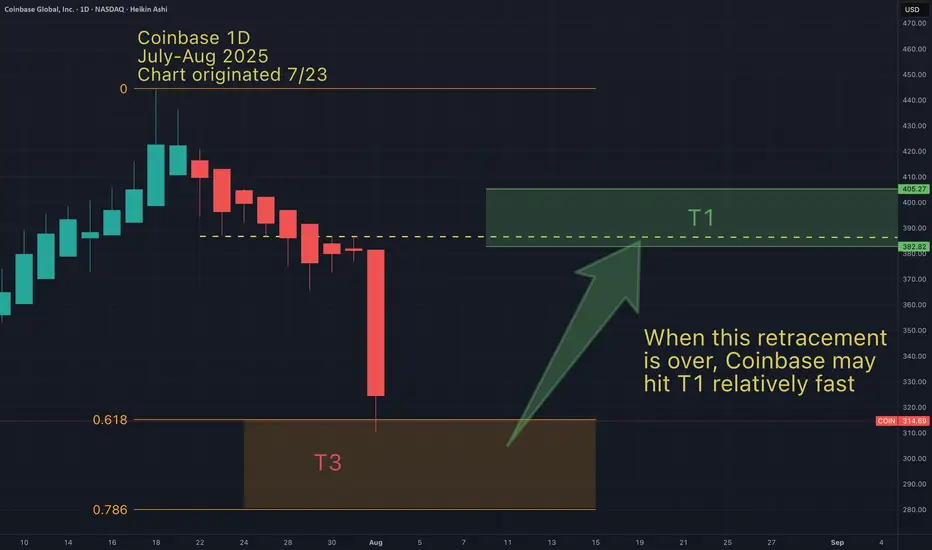
Coinbase dumped to my T3 range. Here is my Bullish targetCoinbase is in my range for a big bounce soon.
Could go a little lower, but I expect around a 25% bounce as soon as the retracement is done.
I anticipate Coinbase to go straight up to my bullish T1 target (around $400 +/- $10).
May the trends be with you.
COIN: Retesting Broken Resistance - Decision Point IncomingCOIN (Coinbase) has pulled back sharply after its breakout run to ~420 and is now retesting the prior resistance zone near 310–315, which previously acted as a lid during Q1.
This area now becomes a classic support-turned-resistance flip and serves as a major decision point for price:
Technical Levels & Setup:
310 horizontal zone = former resistance from February/March → now being retested
Buyers stepping in here would confirm a bullish retest, keeping the breakout structure intact
Failure to hold opens the door for a deeper flush toward 220-250
Price currently sitting on the zone with indecision - watch for confirmation candle (hammer / bullish engulfing)
Measured breakout continuation still targets 450+ if support holds
Is COIN simply back-testing the breakout before another leg higher - or is this the start of a larger reversal?

TA $COINOn the NASDAQ:COIN Daily Chart, a clear fractal 8-count Elliott Wave sequence has formed with each peak aligning with RSI overbought conditions with the 3rd peak confirming resistance and retracements aligned with RSI oversold levels, confirming support. Volume patterns supported the sequence, showing strong participation during rallies and fading volume on pullbacks. A Golden Cross printed on June 24th, adding further bullish confluence before the recent retracement phase.
On the 15-minute chart, price is testing support while forming an inverted Head & Shoulders pattern. This setup is reinforced by bullish divergence on both Volume and RSI. A decisive breakout above the $317 neckline would invalidate the retracement structure and open the path toward the next major target at $400. A drop below $302 would invalidate the bullish setup.

$COIN Price Action playing out exactly as expected!NASDAQ:COIN price action is following the plan laid out a few weeks ago.
After the momentous rally into all time high I was expecting price to have a deep retracement to the weekly pivot point also the golden pocket Fibonacci retracement $240. That is what we got! This values would correspond with a swing below the major High Volume Node support resetting daily and weekly RSI. Daily RSI is already oversold so I am expecting a bounce for wave B of this wave 2 corrective wave with a target of the $350 High Volume Node major resistance.
The weekly 200EMA is ascending and may meet us in the same area adding confluence but this would take a lot longer to play out.
Alternatively, there is also a gap at $215-230 that never got filled at the larger degree golden pocket which would have me upgrade this pullback to wave 2 instead of wave 4.
Bitcoin stocks have all had a decent retracement causing me to upgrade my Elliot Wave count to a completed macro wave 1 with wave 2 now underway, suggesting the best returns are still to come over the next months for this category asset class in wave 3!
Analysis is invalidated if we go to new highs or lose $140. New long signals are certainly building in the DEMA PBR and Price Action strategies so keep an eye out on the Trade Signals Substack as we have made very food profits lately in these markets!
Safe trading

COIN Don't Miss Out
## 🚨 COIN WEEKLY TRADE IDEA (Aug 4–8)
**Bullish Setup Despite Mixed Signals — \$330 CALL ON WATCH**
---
### 🧠 Model Consensus:
* **📈 Weekly RSI** = bullish recovery potential
* **📉 Daily RSI** = bearish pressure, short-term caution
* **📊 Volume** = Institutional activity spotted
* **🧠 AI Models**:
* **Grok & Claude** = Bullish bias ✅
* **Gemini** = Bearish, sees distribution ❌
* **Meta & DeepSeek** = Neutral, sit-tight ⚖️
🧭 **Net Bias: MODERATE BULLISH** (But choppy daily tape)
---
### 🔍 Trade Setup:
| 🎯 Strike | 🎯 Entry | 🎯 Target | 🛑 Stop | ⏳ Expiry | 🎯 Confidence |
| ---------- | -------- | --------- | ------- | -------- | ------------- |
| \$330 CALL | \$4.00 | \$5.00 | \$2.50 | Aug 8 | 65% ✅ |
📍 **ENTRY TIMING:** At open
📍 **VIX Conditions:** Supportive (low-vol = favor gamma grind)
📍 **Risk Trigger:** Exit on close under \$315 or stop hit
---
### ⚠️ Key Risks:
* Daily RSI → 🟥 still bearish = choppy path
* Sector-wide pressure (crypto news, SEC)
* Negative macro or earnings = fast invalidation
---
### 🔥 Tags:
`#COIN #Coinbase #OptionsTrading #CallOption #BullishBias #GammaSqueeze #AITrade #TradingView #WeeklySetup #MomentumPlay`

Coinbase long potential Price is currently sitting at the first buying zone. Accumulating 50/50% in each. In case of price reversal after the 1st support zone, other 50% will be added when price will fix above 358$ at least with one full candle.
Target is on chart.
NFA
DYOR

COIN - Topped at Supply TopPlease refer to our previous post:
In this post we were looking for sellers to come in at our red box between $350-$370. This did originally happen but as soon as we breached the red box price started pumping towards the top of our white box.
The top of our white box was around $430 (First day trading price) and once price reached that level we could not close a candle above. We reached a high slightly higher around $444 but as soon as we close a weekly below the top of the white box we have seen downwards momentum ever since.
We are getting close to our first level of support around $270-$280 and want to see that hold if we want to see a retest of high.
Right now COIN is not in a good spot on the weekly as we have a macro double top (around $430) as well as a bearish divergence forming on the weekly.
So although in the short term we are nearing some key support levels be aware that on the weekly we might be seeing the start of a bear trend. Coinbase's stock did skyrocket 1,300% in the last 2 and half years so a strong pullback to normal valuations would not be out of the picture.

Coinbase - T2 hit (but stopped out)We can't win them all, but I can limit my losses by knowing where are the best entry points, and quickly understanding how/when my strategy gets invalidated. So I know where to set my stop losses and minimize risk. Proper risk management is key.
I'm more focused on Btc and alts, but if anyone is interested in more of my Coinbase trading ideas let me know.

Coinbase Stock Chart Fibonacci Analysis 080125Trading Idea
1) Find a FIBO slingshot
2) Check FIBO 61.80% level
3) Entry Point > 310/61.80%
Chart time frame:C
A) 15 min(1W-3M)
B) 1 hr(3M-6M)
C) 4 hr(6M-1year)
D) 1 day(1-3years)
Stock progress:C
A) Keep rising over 61.80% resistance
B) 61.80% resistance
C) 61.80% support
D) Hit the bottom
E) Hit the top
Stocks rise as they rise from support and fall from resistance. Our goal is to find a low support point and enter. It can be referred to as buying at the pullback point. The pullback point can be found with a Fibonacci extension of 61.80%. This is a step to find entry level. 1) Find a triangle (Fibonacci Speed Fan Line) that connects the high (resistance) and low (support) points of the stock in progress, where it is continuously expressed as a Slingshot, 2) and create a Fibonacci extension level for the first rising wave from the start point of slingshot pattern.
When the current price goes over 61.80% level , that can be a good entry point, especially if the SMA 100 and 200 curves are gathered together at 61.80%, it is a very good entry point.
As a great help, tradingview provides these Fibonacci speed fan lines and extension levels with ease. So if you use the Fibonacci fan line, the extension level, and the SMA 100/200 curve well, you can find an entry point for the stock market. At least you have to enter at this low point to avoid trading failure, and if you are skilled at entering this low point, with fibonacci6180 technique, your reading skill to chart will be greatly improved.
If you want to do day trading, please set the time frame to 5 minutes or 15 minutes, and you will see many of the low point of rising stocks.
If want to prefer long term range trading, you can set the time frame to 1 hr or 1 day.
COINGetting interesting!! miss on earnings and maybe a little lower in short term lets see if 300 holds as support if not looks as if we might see 250-260 again... lower while probably a good buy long term but probably says something has gone wrong in the economy and a weekly close under could spell doom for awhile

COIN 0DTE Trade Breakdown – July 25, 2025
📉 COIN 0DTE Trade Breakdown – July 25, 2025
Put Play or Pass? Let’s break it down 👇
📍 Price: $392.34
🧠 Sentiment: Neutral → Bearish
📊 Call/Put Ratio: 1.08 (Balanced flow)
⚠️ Gamma Risk: HIGH
⌛ Time Decay: Accelerating (0DTE!)
⸻
🎯 TRADE IDEA: 0DTE PUT
✅ Strike: $380.00
💵 Entry Price: $0.69
🎯 Profit Target: $1.00
🛑 Stop Loss: $0.37
📆 Expiration: Today (Jul 25)
📈 Confidence: 65%
📍 Entry Timing: At Open
⸻
⚠️ Why This Trade?
🔻 RSI trending down
🚫 Weak institutional volume
⚠️ High volatility expected from gamma squeeze
🕒 Tick. Tock. Time decay’s your biggest enemy here.
📌 Strategy:
➡️ Naked PUT (speculative short-term play)
⛳ Goal? Quick move → quick exit
⸻
🚨 Risk Warning:
❗ 0DTE = Massive swings
❗ One wrong move = rapid premium decay
❗ Stay nimble. Know your exit.
⸻
💬 Drop a 🔥 if you’re watching COIN today
#OptionsTrading #0DTE #COIN #DayTrading #PutOption #TradingView #StockTok #GammaRisk #TradeSetup

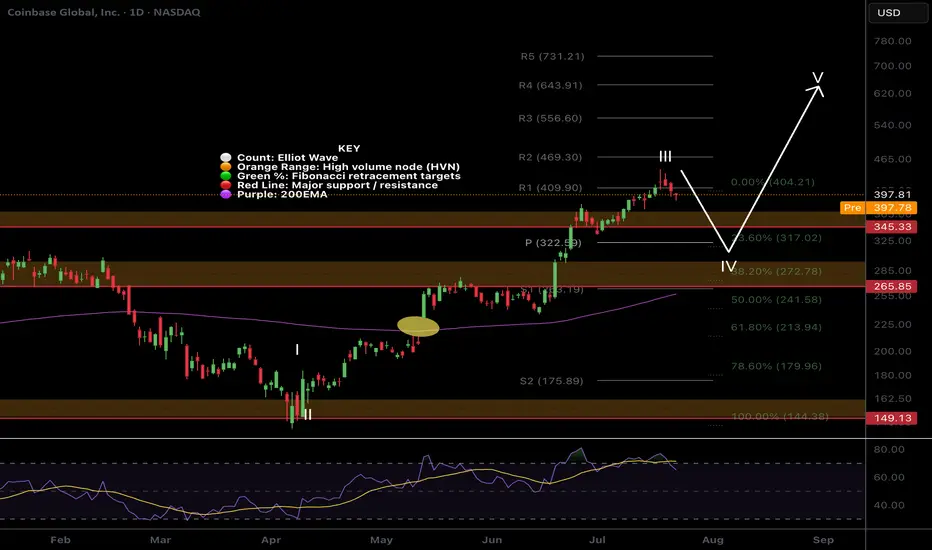
$COIN Wave 4 pullback?NASDAQ:COIN had a tremendous run, a text book Elliot wave 3 but has confirmed bearish divergence on the daily RSI.
The trend is strong so wave 4 could be shallow, only reaching the previous all time high, High Volume Node and 0.236 Fibonacci retracement and daily pivot point between $322-345
Further decline brings up the High Volume Node support at 0.382 Fib retracement and ascending daily 200EMA! Also a highly probable scenario!
Long term outlook remains around $600 target
Safe trading.
Coinbase targetsI'm confident that coinbase has more upside after this recent retracement. I have zoomed in (on 15 min timeframe), on what I believe may be the bottom of this dip. As Coinbase dips, we note that Alt coins are also retracing. I believe Alts and Coinbase will soon see a reversal to the upside. This chart shows my entry points and how I anticipate price action to unfold.

Coinbase next targetCoinbase may have a small pump to my bullish target (+7-10%) up from this recent low.
After that I expect a breakout retest and probably a retrace to the golden pocket of that move.

COINBASE - My rules say: Down with high probabilityI don't elaborate too much here, because I want to give you a chance to learn something!
As for the Trade, my rules say that it is a good Short.
The Short is not valid anymore, if price open and close above the Upper Extreme!
So, what are the rules?
Well, that's exactly what you will learn today ;-)
Go to my previous post which I will link, and you find everything you need to jump on the Steam-Train if you like.
As my old Mentors always said: "Larn To Earn"
Happy Profits Guys & Gals §8-)
COIN Shares Buy at 404 Take Profit at 425NASDAQ:COIN Shares Buy at 404 Take Profit at 425
Stocks SPOT ACCOUNT:
NASDAQ:COIN shares: my buy trade with take profit.
This is my SPOT Accounts for Stocks Portfolio.
Trade shows my Buying and Take Profit Level.
Spot account doesn't need SL because its stocks buying account.
Looks good Trade.
Disclaimer: only idea, not advice

COINBASE I Strong Bearish Outlook (Take Action Now)Welcome back! Let me know your thoughts in the comments!
** COINBASE Analysis - Listen to video!
We recommend that you keep this stock on your watchlist and enter when the entry criteria of your strategy is met.
Please support this idea with a LIKE and COMMENT if you find it useful and Click "Follow" on our profile if you'd like these trade ideas delivered straight to your email in the future.
Thanks for your continued support!
