$COP with a bullish outlook following its earnings #StocksThe PEAD projected a bullish outlook for NYSE:COP after a positive under reaction following its earnings release placing the stock in drift A with an expected accuracy of 20%.
COP trade ideas

O&G on the up todayThere are many names in the O&G that I could consider opening long positions today. NYSE:COP is one of them, others being NYSE:CNQ NYSE:DINO , NYSE:VLO among others. Note however that many of these tickers are still in a long term down trend so it would be prudent to start off with a small position and see how the merket behaves and react accordingly. I set support and resistance based on higher timeframes and based on the NYSE:COP weekly chart, I have set temporary resistance at around $108.

$COP with a Bullish outlook following its earnings #Stocks The PEAD projected a Neutral outlook for $COP after a Negative Under reaction following its earnings release placing the stock in drift D with an expected accuracy of 50%.

COP - Horizontal Resistance Breakout COP has formed this nice structure above a horizontal resistance, it is now finding support above this resistance which is now support
Resistance / Support analysis
Price is within a triangle / wedge like structure above this resistance
Bullish expectations

#COP idea -20%?Hello dear Traders,
Here is my idea for #COP
Price closed below yellow line (previous month low)
Price closed in 15 Minute chart below purple trigger line -> Enter Trade.
Targets marked in the chart (black lines)
Invalidation level marked with red line
Good luck!
❤️Please feel free to ask any question in comments. I will try to answer all! Thank you.
Please, support my work with like, thank you!❤️

$COP with a Neutral outlook following its earnings #Stocks The PEAD projected a Neutral outlook for $COP after a Positive over reaction following its earnings release placing the stock in drift B with an expected accuracy of 100%.

$COP - shortCOP is in triangle position for searching end and breakout. Expect one more upside with throw over and in case of that between 126-130 to a short entry.

Bearish on ConocoPhillips. COPWe are not in the business of getting every prediction right, no one ever does and that is not the aim of the game. The Fibonacci targets are highlighted in purple with invalidation in red. Confirmation level, where relevant, is a pink dotted, finite line. Fibonacci goals, it is prudent to suggest, are nothing more than mere fractally evident and therefore statistically likely levels that the market will go to. Having said that, the market will always do what it wants and always has a mind of its own. Therefore, none of this is financial advice, so do your own research and rely only on your own analysis. Trading is a true one man sport. Good luck out there and stay safe.

COP daily signs of reversal near all time highCOP daily signs of reversal near all time high no clean candle entry. However so close to all time high and we go lower, it's probably the beginning of waver 3 down trend. Stop above all time high.

COP nice little hammer on dailyCOP bearish set up hammer on daily plus wave C on daily / weekly and wave A on monthly.
Target can be moved down to $70 once we see an action dynamic around point of control and MA 100 and 200.

COP bearish hammer at local high on dailyLove the hammer, love the position, love next day bearish hammer.

COP - Energy stock resilient and on the moveConoco Phillips on the move. Two week minor pullback and breaking out.
IQ has always and will always, get all the praise; but discipline gets the job done ~Mark Ritchie
Lose like a pro and keep trading, or lose like a novice and quit ~Mark Ritchie

COP daily frame toward 107 (possible retest of ATH?)8/22/22 = 100% fib time ext with price target near 107.
short term top or corrective subwave & ATH possibly in the picture?


$COP with a Bullish outlook following its earnings #Stocks The PEAD projected a Bullish outlook for $COP after a Positive Under over reaction following its earnings release placing the stock in drift A with an expected accuracy of 22.22%.
COP - Up Channel Breakout COP has formed a large up channel (white lines)
Price has broken out of this channel, the top channel band will now likely act as support for price
This will ultimately lead to continuation upwards for price, in a more aggressive manner (shown with green bars pattern)

Someone call the COPs ConocoPhillips
Short Term
We look to Buy at 87.72 (stop at 84.15)
Preferred trade is to buy on dips. We are trading at oversold extremes. Previous support located at 87.50. We have a 61.8% Fibonacci pullback level of 87.61 from 65.06 to 124.08. We therefore, prefer to fade into the dip with a tight stop in anticipation of a move back higher.
Our profit targets will be 101.19 and 108.19
Resistance: 105.00 / 124.00 / 150.00
Support: 87.50 / 68.00 / 51.00
Disclaimer – Saxo Bank Group. Please be reminded – you alone are responsible for your trading – both gains and losses. There is a very high degree of risk involved in trading. The technical analysis, like any and all indicators, strategies, columns, articles and other features accessible on/though this site (including those from Signal Centre) are for informational purposes only and should not be construed as investment advice by you. Such technical analysis are believed to be obtained from sources believed to be reliable, but not warrant their respective completeness or accuracy, or warrant any results from the use of the information. Your use of the technical analysis, as would also your use of any and all mentioned indicators, strategies, columns, articles and all other features, is entirely at your own risk and it is your sole responsibility to evaluate the accuracy, completeness and usefulness (including suitability) of the information. You should assess the risk of any trade with your financial adviser and make your own independent decision(s) regarding any tradable products which may be the subject matter of the technical analysis or any of the said indicators, strategies, columns, articles and all other features.
Please also be reminded that if despite the above, any of the said technical analysis (or any of the said indicators, strategies, columns, articles and other features accessible on/through this site) is found to be advisory or a recommendation; and not merely informational in nature, the same is in any event provided with the intention of being for general circulation and availability only. As such it is not intended to and does not form part of any offer or recommendation directed at you specifically, or have any regard to the investment objectives, financial situation or needs of yourself or any other specific person. Before committing to a trade or investment therefore, please seek advice from a financial or other professional adviser regarding the suitability of the product for you and (where available) read the relevant product offer/description documents, including the risk disclosures. If you do not wish to seek such financial advice, please still exercise your mind and consider carefully whether the product is suitable for you because you alone remain responsible for your trading – both gains and losses.

COP Oil names still leadersPost breakout shakeout makes this setup interesting. Oils stocks are leaders and we may be finding a bottom on the market for now. Even tho my personal opinion tells me this stocks already had their run, price and volume action tells me otherwise. I will be disciplined with my methodology and buy a small position as a toe in water.

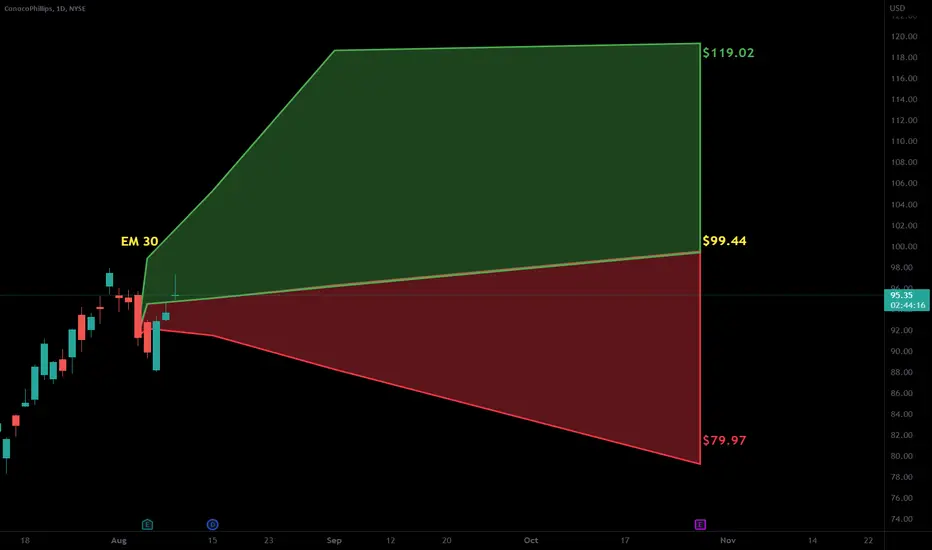
4-6 week opportunity with 20% gain opportunity..!Entry: at the market opening
Stop loss: closing below 95
Reward/Risk: 2
Target range: 120
Time Frame: 4-6 wks
Possible gain: 20%%
Possible loss: 5-10%%
Position size: 5 % of trading capital
You can see the most important support(green line) and resistance (red line) levels.
Best,
Dr. Moshkelgosha M.D
DISCLAIMER
I’m not a certified financial planner/advisor, a certified financial analyst, an economist, a CPA, an accountant, or a lawyer. I’m not a finance professional through formal education. The contents on this site are for informational purposes only and do not constitute financial, accounting, or legal advice. I can’t promise that the information shared on my posts is appropriate for you or anyone else. By using this site, you agree to hold me harmless from any ramifications, financial or otherwise, that occur to you as a result of acting on information found on this site.

$COP ATH Blue Sky BreakoutConoco Phillips nice blue sky breakout after healthy VCP pattern, looking for $120 Magnet
I'm long JUN 117 calls up 95% , might sell some calls against it but chart looks strong IMO and looking for more upside first

$COP - Breakout Target 127$$COP breakout on good volume out of a nice consolidation phase - Target 127$

$COP More OIL SetupsOne more #Oil stock that is looking setup.
Did I say #Oil stocks setting up?
$COP one with a shakeout.

$COP with a Bullish outlook following its earnings #Stocks The PEAD projected a Bullish outlook for $COP after a Positive Under reaction following its earnings release placing the stock in drift A with an expected accuracy of 25%.
