COSTCO BULLISH ON EARNING REPORTCOSTCO BEAT EARNING EXPECTATION. view turn bullish from reports . a break of previous resistance and expose new highs.
COST trade ideas

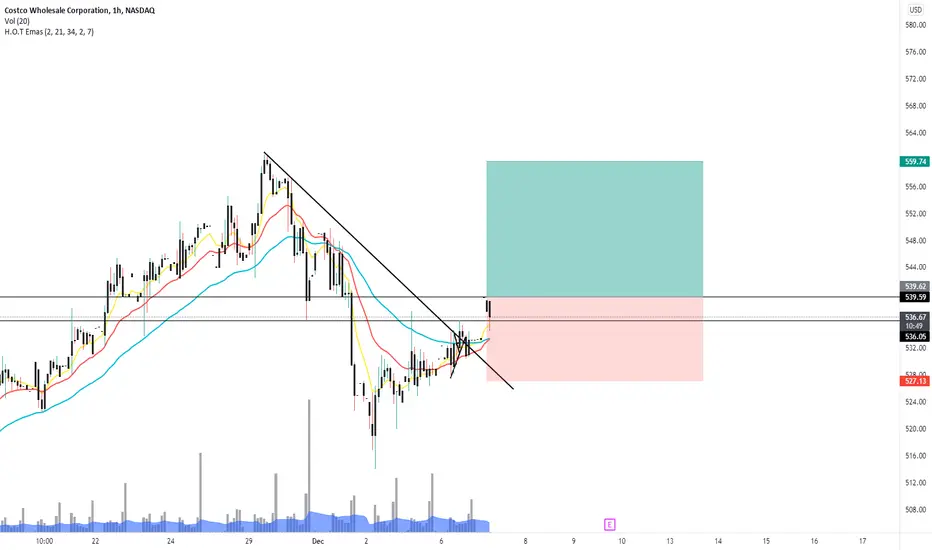
Cost Short when reached 550.98-556.25Cost Put when reach 550-556, Stop loss 567, Target 1 =537.25, Target 2= 528.53

Costco May Witness A Big Jump After Earnings
Costco Wholesale COST is set to give its latest quarterly earnings report on Thursday after the closing bell, Costco will likely report an Earnings Per Share (EPS) of $2.61.
Costco bulls will hope to hear the company to announce they've not only beaten that estimate, but also to provide positive guidance, or forecasted growth, for the next quarter.
Last quarter the company beat EPS by $0.33, which was followed by a 3.31% increase in the share price the next day.
The stock is currently forming a potential continuation pattern (Symmetrical Triangle) to be confirmed by the violation of the $543.00 resistance point. After the pattern being confirmed supported by a probable earnings beant, the price will likely hit the pattern's minimum target around $572.00 point.

costco bearish bias update.Market has not followed thru with a close below 550 . seems the bulls and bears are in a tussle.

COST - 950 by July 2022Please see chart and curve line taking us to top of channel after the impulse move above middle channel.

costco update bearish biasCostco didnt close above the 560 handle required. sellers found supply there.


COSTco is a winnerCostco made a classic buy the uptrend support on Friday. With that boost this looks really good and ready for breakout again for another big run. All indicators are bullish. If Monday holds that $550 support and breakout above $561 it will continue to run. High trend breaking ATH with RSI 66. Explosive, one of my favorite setups.
If you want a slow moving but will continuously go up stock, then Costco can’t be beat for long term hold either.
$COST
Like and follow for more, comment to discuss

$COST... another beautiful breakout...We sold premium into earnings on this one for about 90% profit!


COSTCOOverbought on the weekly
It won't continue at this pace
Correction bellow the $500 level
Long entry at $470

COST breakoutI will be waiting for a break of $539.60
Good chances we retest ATH.
Market has been very volatile, keep that in mind.
COST - STOCKS - 26. OCT. 2021Welcome to our Weekly V2-Trade Setup ( COST ) !
-
4 HOUR
Closure above main sr level.
DAILY
Looking for more bullish pa
WEEKLY
Expecting another turnover
-
STOCK SETUP
BUY COST
ENTRY LEVEL @ 306.89
SL @ 299.28
TP @ Open
Max Risk: 0.5% - 1%!
(Remember to add a few pips to all levels - different Brokers!)
Leave us a comment or like to keep our content for free and alive.
Have a great week everyone!
ALAN

COSTCO Bearish PatternCOST formed a bearish AB=CD on the 15 min, T1 was achieved and might get to T2 Monday/Tuesday.

COMING END OF THE BULLMARKET for COSTCOI am moving to a net short COSTCO USING PUTS AT THE MONEY AT a 85 % net short now . WAVE structure has wave 1 and 5 being equal and wave 3 extended LOOK for a very large decline min .236

COST 50COST started trading in an up channel and has been using the purple trend line as resistance. It formed a double bottom and reached an ATH. With indicators in the overbought and bearish momentum COST might be looking for support at the 50 EMA. Previous support levels will act as price targets but COST could very well fall straight to support. On the daily chart COST is trading within an uptrend and has a breakout. It could fall to retest that line which is at $523 November 17th which would make $522 a price target, consolidate and find support at the 50 EMA.

COST - CostCo - PARABOLIC CURVE COMING TO AN END?Interesting to hear peoples thoughts on this. If you know what I am talking about it will become obvious that this arc might/could end soon. Hard to say with stocks like costco because of their obvious growth nature. In fact, might be more positive during these financial times using costco for bulk/saving money vs others. In general some studies show that parabolic arcs typically retrace 62%.
Of course CostCo is a great/money saving company. However, what goes up must come down. The best stocks/ BTC all do at some point. Any news or bad PR I could see COST getting demolished due to the parabolic nature on the monthly cart.
Let me know your thoughts.

COST 11/8 AnalysisBroke out of the weekly channel, retested & bounced off the daily trendline. Rallied 25 points, creating a gap and finally rejecting off 520.
Ideally, we want 509 to hold in order to see 530 PT. Under 509 we can flush to 503 gap fill. BTD here if buyers step in.

PFE COST11.7.21 PFE COST accurate reversal at support for PFE Costco moves higher...time to take profit or some profit?

COST potential Bull TrapCOST attempted to break through resistance post FEDS conference but was rejected. Indicators still show bearish momentum. A price drop to $498, reversal, and a rejection at $502 would serve as a entry point for puts.
Price Target One: $496.70
Price Target Two: $492.21

COST 11/1 AnalysisNear ATH with a recent WEEKLY breakout over 472. Currently sitting at 491.50. Daily bull pennant w/ 30 point pole

COST10.31.21 COST the lines and the tools suggest that Costco is at a reversal point although there is no sign of sellers yet. I am sorry for my in inability to articulate some of my points clearly. Here are some references so that you can do your own research: A: Force majeure is a contract clause that removes liability for catastrophic events, such as natural disasters and warfare. B: (from Google search) Your Bank Deposits are Unsecured Loans to the Bank and Subject to Confiscation C: ShadowStats :http://www.shadowstats.com/article/hyperinflation

COST pullback before $500?COST has been on a strong uptrend all week with no pullback. October 22nd there was a strong rejection at the 2.618 and the whole bearish pin is outside of the BB. Looks bearish for the next week, bulls could be waiting for one last push to $500 before bearish reversal. Looking for conformation October 25th.
Price Target One: $469.80
Price Target Two: $459.97
