COST waiting for a breakout8 month long base, price started consolidating under previous high 393.15
COST trade ideas

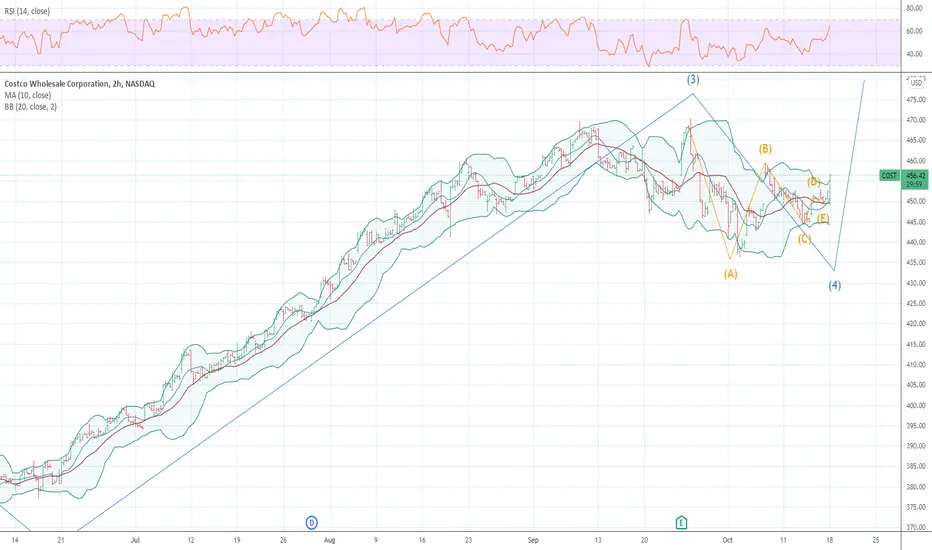
COSTCO TIME TO BUY AGAIN 4th wave triangle IT SEEMS THAT RETAIL IS GOING TO RUN .We have just ended a nice but tight abcde triangle I moved to calls for jan this morning open as we also hit the trendline
Waiting for Bullish MoveI like COST a lot for its steady growth and non volatile movement.
I expect that this stock will be bullish soon for the upcoming holidays.
Ideally I want the price to raise above the orange line to create a clear breakthrough, from there I can just buy and hold until the trend ends.

Cost analysisLook at each section for buy & sell interval.,
When it's dropping do an opposite chart besides your Buy-in price
to avoid losses

Costco's loses weekly channelLong time coming correction for this stock. up over 35% for this year alone. Target is 200ma or 387. Jan Exp

COST next leg up?Pulling back from a strong move to ATH last week,
Support at $443 and price squeezing inside a descending triangle.
I am watching this one closely tomorrow

$COST with a Bullish outlook following its earnings #Stocks The PEAD projected a Bullish outlook for $COST after a Positive under reaction following its earnings release placing the stock in drift A with an expected accuracy of 66.67%.
If you would like to see the Drift for another stock please message us. Also click on the Like Button if this was useful and follow us or join us.

COST on WatchLike the looks of the Friday candle post earnings. Hoping for a pull back into the green box be for a move back up. Really want see price hold the upper 30% of the big candle. Targets would be ATH and then fib extension. Pretty much an inflation play as it's hard to find lower prices than Costco anywhere.

ContinuationCOST – Continuation play with potential breaking ATH. Over 469.8 or if it comes down to $467 or $465.3 for bounce levels for calls.

COST looks to hit $500 before taperingCOST has been on a strong uptrend this past year, reaching $500 would be such a milestone, and it nearly had a breakout September 24
- COST double bottomed
+ rounded volume is a good indication
+ high levels volume after earnings changing the momentum
- Stochastic Slow plot line crossed signal line
A close above $468 would be official conformation of a breakout; which looks to happen September 27.
** the arrow was showing curve in volume


COST looking to continue its trend* Good earnings quarter over quarter
* Very strong up trend since inception
* Breaking out of almost a month long consolidation with higher than average volume
* Recently had great earnings report causing volume to come in and push higher
Target: $542.67

Costco earningsCostco short term prediction, max of $515 but might correct down depending on the numbers to T2 and T3.

Cómo funciona EP TREND HEATMAPHola a todos, en esta ocasión explico el funcionamiento de un nuevo indicador, EP Trend Heatmap (mapa de color de tendencia).
Es un indicador que muestra de forma simultánea la tendencia en varios timeframes, de forma que nos da una visión de conjunto de la situación del activo, ayudándonos a tomar decisiones con más seguridad.
Se relaciona estrechamente con otro indicador, EP PRISM, que se basa en las mismas medias.
EP Trend Heatmap muestra algunos patrones muy interesantes que nos ayudan a encontrar zonas de entrada en compra bastante seguras. Muy interesante el patrón "cielo despejado" que comentamos en el vídeo.
Este indicador puede tomarse también como filtro adicional para las llamadas a compra del indicador EP PRISM. A pesar de que estas señales son por si mismas muy eficaces, nunca bien mal una "segunda opinión" que nos permita tomar decisiones con más seguridad.
Espero que os guste!


$COST Bull$COST beat earnings and broke out of the 4 hour resistance level. I speculate that it will run to the daily resistance level of 388.09. If it breaks this daily level over the week it will move to the blue box which is my target area.

COST moving to $500?COST has been on a mission and has been trending up strongly over the past few months, but will that trend reverse soon?
- AUG 27 COST bounced off my pitchfork's support level ($446.41) and is trended up since
- Using fibonacci extensions, $466.68 seems to be the support level - that aligns with my pitchfork's support level
As for a longer term move, it is best to keep an eye on COST and see how it falls and recover. COST has a tendency to move along its support - it'll try to bust through come to resistance level and continue its trend. COST might make a strong move in the next week or two to bust through my pitchfork's support level (mid line, blue line) and use that as its new resistance level. If it does that, COST might head to $500 around early October.

COSTCO THE MOST DAYS DOWN IN OVER 6 MONTHS BUY OR BREAKDOWN Costco COST has now the most days down in a row since the UPTREND began which I post a major low at march low . THE markets all will be rolling over after the last wave up is nearing The CARES money runs out and inflation will then cause a rather slowdown due to an increase to ALL as the FREE MONEY COMES TO AN END !

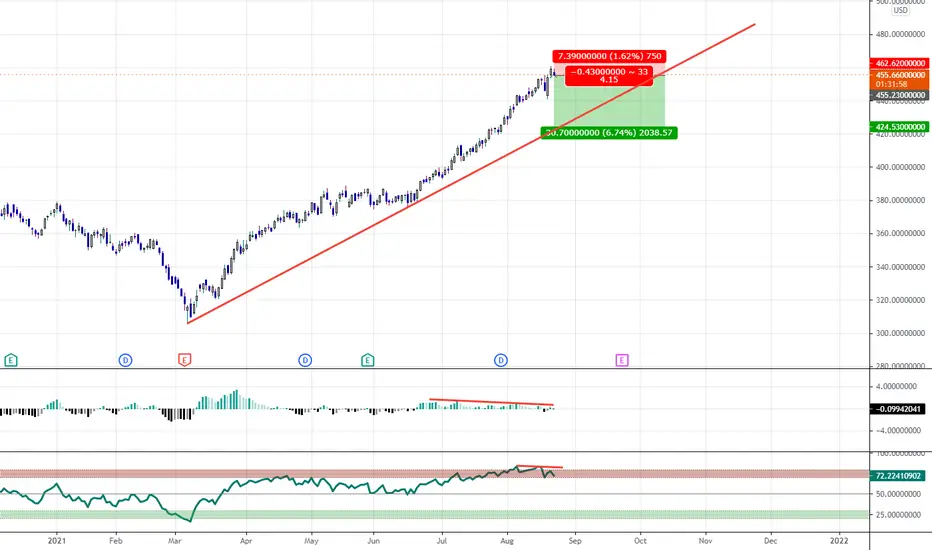
Quick Minimum Pullback to the Trendline LikelyWill be shorting this one through the buying of puts as i'm bearish on retail.
COST UpdateTarget hit, looks for a reversal next week, maybe even Monday
Probably only a one or two day trade after the reversal. Expect it to whipsaw until earnings like last quarter
Way overbought

Costco: Finally Starting To Look OverboughtCOST is an above average company with great execution on it's business plan. However, the stock, which now trades at a RICH 44x FWD earnings, is beginning to look expensive - given that's a premium to the market's long term average of 15x earnings, and even still a 30% premium to COST's average valuation over the last 5 years.
Combined with the recent UMCSI readings which are bearish for consumer facing businesses, and the overbought RSI & ADX readings, it's time, at the very least, to take some profits in this name. We don't like outright shorting good companies unless they go parabolic though, so we're looking to pair a short here with something that we think is well positioned -- CTLT or COO. Well positioned names in a well positioned sector - this comes from our proprietary capital flows model.
Cheers all!

Good Trade Idea for next breakoutThis consistently tests resistance after breakout. So watch for pattern next time and buy the breakout.

$COST what a crazy recovery...Somehow I pull out a small profit on next week $435 puts by closing them at open. Going to let Costco do it's thing now, it tested a pull back and was bought with a vengeance.
