Remains bullish in and above box.COST showing relative strength.. Must be the sale of all that toilet paper.
Like it if it holds inside the box and above.
COST trade ideas
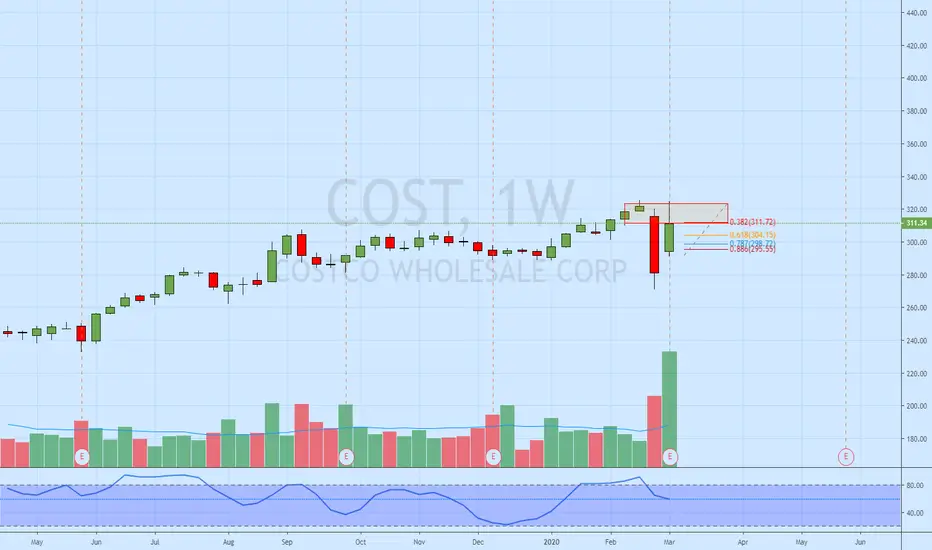


levels that COST must holdCostco must hold these levels. Else further correction into the weekly 50ma is likely.


Buy now costMy strategy is to combine several techniques at once:
+ Price channel and trend line: help me identify the direction of the price,
+ Supply - demand: help me identify the reversal position,
+ Elliott wave: help me determine the cycle of price,
+ Candlestick pattern and price action: Help me correct the position to the order.
...

$COST looks set for a breakout$COST showed strength last Friday when market was selling off and it looks primed to break all-time high resistance of 314.28. The stock has been accumulating heavily since last earnings and has broken out of the consolidation range of 290-300 recently. Investors are looking to add to value names due to current market sentiment and stocks like COST, WMT, etc. fit the criteria especially since they are household names and have been lagging spy. I'm looking for COST to break resistance this week and possibly run to 325+ leading to ER.

COST long opportunityCOST being accumulated over past 6 months. What may have looked like a failed breakout turned out to be a buying opportunity. Bullish setup here.


COST Looks Ready For a 5%-10% RunCOST seems to be about to break past resistance at 307.50 and make a run to $320-$330. Jan 1st $310 calls are only about $1. I think they will get up to $5-$10 by expiration.


COST Heading to Double topExpecting at least a double top, look at the accumulation. Looks to me like the giant bull flag is now over.


COST - Don't do this close to earnings report unless...I don't recommend taking a trade days before earnings report unless you're sure what you're doing. In this case the buyers are stopping out the sellers at the 292.50 level, you can see the previous hammer candle and the more recent gap up. Does it mean anything though especially after the report comes out?
LONG - COST
SL: 290.58 (Suggested by our algorithmic system)
TP: 303.51 (Suggested by our algorithmic system)
Reasons behind this idea:
1. Bullish OBV divergence detected
2. Accum/dist indicator still looks positive
CAUTION: Support trendline was broken
---------- Chart Drawings ----------
Blue Dotted Line: Broken Support Trendline
Red Dotted Line: Broken Resistance Trendline
Blue Solid Line: Support Trendline
Red Solid Line: Resistance Trendline
Blue Rectangle Box: Support Level
Red Rectangle Box: Resistance Level
Blue Arrow Line: Bullish Divergence
Red Arrow Line: Bearish Divergence
Purple Vertical Line: Suggested Stoploss by our algorithmic system
Green Vertical Line: Suggested Stoploss by our algorithmic system
Trade idea from our mobile app: ibb.co (Timestamp is in Australian Sydney Time UTC+7)
Please trade responsibly and good luck!


$CIST - long, 1-year parallel channel trend bounceNASDAQ:COST - long for a quick $5-8 pop, good risk/reward IMHO

Double inside weekly candlesBeen patiently waiting on this one, not sure which way it goes but just follow it, big move coming

