The West Innovates, but China COPY/PASTES Better...From Instagram/Youtube to Tik-Tok
From OpenAI (closed AI) to China Free AI ...
''🇨🇳📋 China Doesn't Just Copy, They Paste Better! 🚀🤖''
What Just Happened?
The DeepSeek AI shockwave just sent the US stock market into panic mode – wiping out hundreds of billions in value.
Here’s the breakdown:
Key stats
About INVESCO CHINA TECHNOLOGY ETF
Home page
Inception date
Dec 8, 2009
Structure
Open-Ended Fund
Dividend treatment
Distributes
Distribution tax treatment
Qualified dividends
Income tax type
Capital Gains
Max ST capital gains rate
39.60%
Max LT capital gains rate
20.00%
Primary advisor
Invesco Capital Management LLC
Distributor
Invesco Distributors, Inc.
CQQQ provides broad, vanilla exposure to Chinese tech firms. It includes A-shares (firms listed on the mainland), N-shares (firms with primary listings in New York) and other share classes. N-share coverage is particularly helpful in the tech space. The index includes all companies in the tech sector based on its underlying ICB industry classification system, which can vary materially from its main sector scheme rival, GICS. The selection process does not apply any factor-based screens. Stocks are market-cap weighted, subject to some position limits. Individual positions are capped at 10% for largest stock, 9% for second, etc. on through the top six names, subject to a cap of 40% total for individual positions greater than 5%. Prior to June 24, 2019, the fund tracked an AlphaShares China tech index. The fund and index are rebalanced quarterly.
Classification
What's in the fund
Exposure type
Technology Services
Electronic Technology
Stock breakdown by region
Top 10 holdings

Bullish China Tech in Short TermChina theme seems too beaten down but looks like Chinese Tech will pop up in short to medium term.
Entry : 36
Stop Loss: 34.50
Exit: 48 to 54 Range (Depending on how the trade unfolds)
Time: End of Feb 2025
This could be a good 25-30% gain.
All the best.
Marketpanda
Disclaimer: The information

New Setup: CQQQTQQQ: I have a green setup signal(dot Indictor). It has an excellent risk-to-reward ratio(RR:). I'm looking to enter long near the close of the day if the stock can manage to CLOSE above the last candle highs(white line). If triggered, I will then place a stop-loss below(SL) and a price target above

CQQQ May 7th TTR UpdateTheTradersRoom is very long #CQQQ from much lower levels and looking to hold this one till at least we see 2-3x gains on it.
We have entered it first days of Feb and very happy with the result.
China is recovering and Im expecting a perfect inversion alignment to QQQ here into the end of the next

CQQQ Long 12/4/23AMEX:CQQQ
The five wave thrust through the wave (iv) of ((c)) of Y of (B) high should confirm the completion of the entire double three corrective pattern that began in January. Any downside should remain corrective against the wave (B) low of 33.50 as wave (C) begins to develop higher towards t

China Technology Invesco ETFThere have been concerns about China's economic health after COVID. China's economy was the hardest hit by the zero covid policy which resulted in prolonged shutdowns. This had a major impact on their economy and the future outlook.
However, there is a probability that China's economy will make a c

CQQQ: Falling wedge reversal patternlooks like short term bullish as we can see the falling wedge formed here.
Also RSI divergence looks positive.
Might be a short upwards run.
happy investing
Cheers

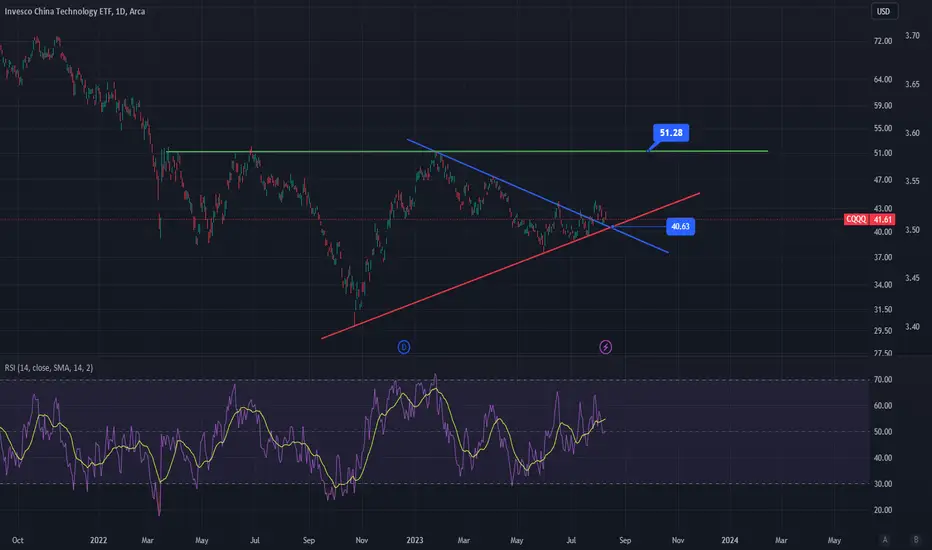
CQQQ: Looks goodCQQQ boke out of that resistance and gaining strength.
It might breakout anytime and might reach $51.
I think this is a good long play.
But remember, when US goes into recession Chinese stocks will also dump.
Looks for yield curve inversion for possibility of recession.
China stocks on chains ? It is always particularly important to look at the ETFs to get a certain overview of several individual values. In this case, I wanted to take a look earlier at the China ETF as there are several notoriety stocks incorporated there.
As you can see charttechnically, we are at a junction. This fork is

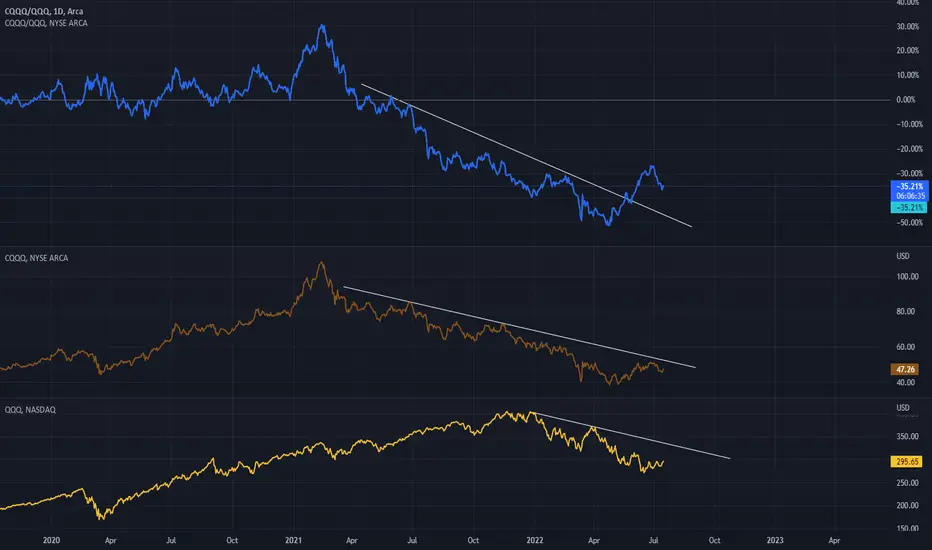
Observation China's CQQQ is beginning to outperform QQQ Top pane - Chinas CQQQ vs QQQ ,as you can see, we have entered a "potential" period of outperformance...This is more of an early hint I would say and not yet conclusive/confirmed.
Middle pane- individual chart CQQQ
Bottom pane- individual chart QQQ
I would like to also see CQQQ break above
See all ideas
Summarizing what the indicators are suggesting.
Oscillators
Neutral
SellBuy
Strong sellStrong buy
Strong sellSellNeutralBuyStrong buy
Oscillators
Neutral
SellBuy
Strong sellStrong buy
Strong sellSellNeutralBuyStrong buy
Summary
Neutral
SellBuy
Strong sellStrong buy
Strong sellSellNeutralBuyStrong buy
Summary
Neutral
SellBuy
Strong sellStrong buy
Strong sellSellNeutralBuyStrong buy
Summary
Neutral
SellBuy
Strong sellStrong buy
Strong sellSellNeutralBuyStrong buy
Moving Averages
Neutral
SellBuy
Strong sellStrong buy
Strong sellSellNeutralBuyStrong buy
Moving Averages
Neutral
SellBuy
Strong sellStrong buy
Strong sellSellNeutralBuyStrong buy
Displays a symbol's price movements over previous years to identify recurring trends.
Related funds
Frequently Asked Questions
An exchange-traded fund (ETF) is a collection of assets (stocks, bonds, commodities, etc.) that track an underlying index and can be bought on an exchange like individual stocks.
CQQQ trades at 817.58 MXN today, its price hasn't changed in the past 24 hours. Track more dynamics on CQQQ price chart.
CQQQ net asset value is 797.76 today — it's fallen 0.49% over the past month. NAV represents the total value of the fund's assets less liabilities and serves as a gauge of the fund's performance.
CQQQ assets under management is 18.76 B MXN. AUM is an important metric as it reflects the fund's size and can serve as a gauge of how successful the fund is in attracting investors, which, in its turn, can influence decision-making.
CQQQ price has fallen by −1.14% over the last month, and its yearly performance shows a 39.28% increase. See more dynamics on CQQQ price chart.
NAV returns, another gauge of an ETF dynamics, have risen by −0.49% over the last month, have fallen by −0.49% over the last month, showed a −19.31% decrease in three-month performance and has increased by 34.74% in a year.
NAV returns, another gauge of an ETF dynamics, have risen by −0.49% over the last month, have fallen by −0.49% over the last month, showed a −19.31% decrease in three-month performance and has increased by 34.74% in a year.
Since ETFs work like an individual stock, they can be bought and sold on exchanges (e.g. NASDAQ, NYSE, EURONEXT). As it happens with stocks, you need to select a brokerage to access trading. Explore our list of available brokers to find the one to help execute your strategies. Don't forget to do your research before getting to trading. Explore ETFs metrics in our ETF screener to find a reliable opportunity.
CQQQ invests in stocks. See more details in our Analysis section.
CQQQ expense ratio is 0.65%. It's an important metric for helping traders understand the fund's operating costs relative to assets and how expensive it would be to hold the fund.
No, CQQQ isn't leveraged, meaning it doesn't use borrowings or financial derivatives to magnify the performance of the underlying assets or index it follows.
In some ways, ETFs are safe investments, but in a broader sense, they're not safer than any other asset, so it's crucial to analyze a fund before investing. But if your research gives a vague answer, you can always refer to technical analysis.
Today, CQQQ technical analysis shows the strong sell rating and its 1-week rating is sell. Since market conditions are prone to changes, it's worth looking a bit further into the future — according to the 1-month rating CQQQ shows the buy signal. See more of CQQQ technicals for a more comprehensive analysis.
Today, CQQQ technical analysis shows the strong sell rating and its 1-week rating is sell. Since market conditions are prone to changes, it's worth looking a bit further into the future — according to the 1-month rating CQQQ shows the buy signal. See more of CQQQ technicals for a more comprehensive analysis.
Yes, CQQQ pays dividends to its holders with the dividend yield of 0.26%.
CQQQ trades at a premium (0.76%).
Premium/discount to NAV expresses the difference between the ETF’s price and its NAV value. A positive percentage indicates a premium, meaning the ETF trades at a higher price than the calculated NAV. Conversely, a negative percentage indicates a discount, suggesting the ETF trades at a lower price than NAV.
Premium/discount to NAV expresses the difference between the ETF’s price and its NAV value. A positive percentage indicates a premium, meaning the ETF trades at a higher price than the calculated NAV. Conversely, a negative percentage indicates a discount, suggesting the ETF trades at a lower price than NAV.
CQQQ shares are issued by Invesco Ltd.
CQQQ follows the FTSE China Incl A 25% Technology Capped Index. ETFs usually track some benchmark seeking to replicate its performance and guide asset selection and objectives.
The fund started trading on Dec 8, 2009.
The fund's management style is passive, meaning it's aiming to replicate the performance of the underlying index by holding assets in the same proportions as the index. The goal is to match the index's returns.