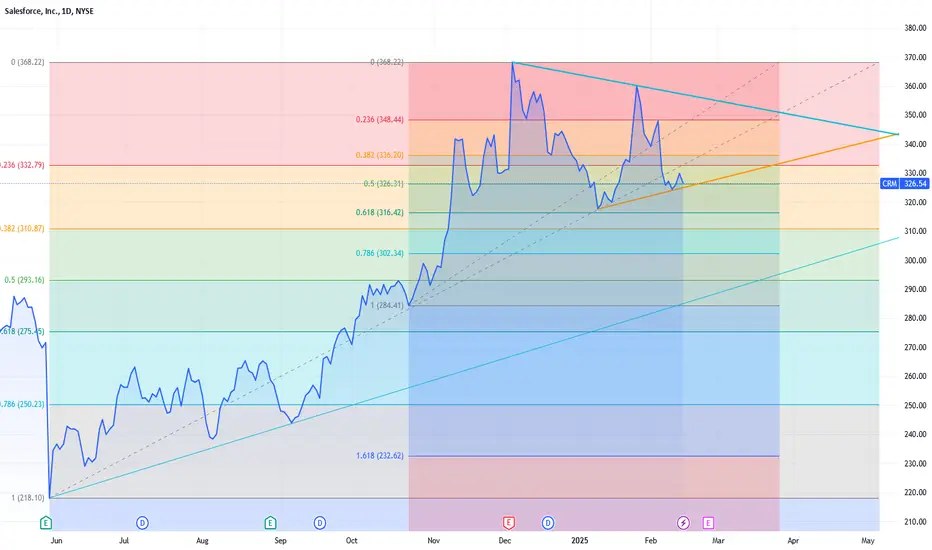
CRM-Uptrend and Fibbo Retrace?It appears when looking at the weekly, CRM began an uptrend starting Dec '22. On the daily, the Fibbo retracement looks to have pulled back to the bottom of the golden retrace range. With both of these being touched, along with the 80 DMA on the daily, is CRM ready to run again?
If so, it looks to be able to run to $400 before topping out in the channel.
CRM trade ideas

SALESFORCEWe are going to invest in Salesforce shares, aiming for a 25% gain before the end of April. Good luck to everyone!

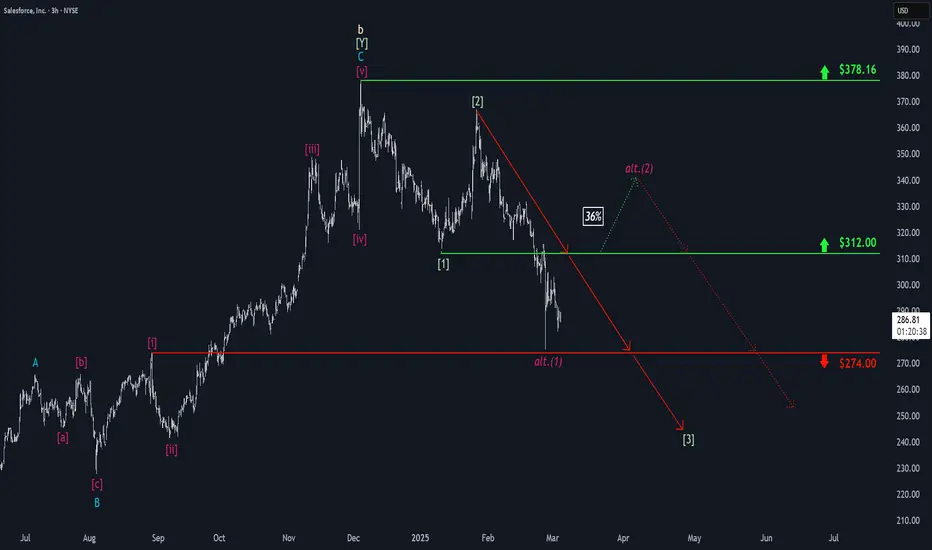
Salesforce: Further ProgressDue to continued downward pressure, Salesforce has made further progress in realizing our primary scenario. During the ongoing green wave , we still expect the stock to sell off below the support at $274. However, if the price imminently climbs above the resistance at $312, we will have to reconsider the structure of the ongoing decline and reckon with a magenta five-wave downward move. We currently assign this alternative scenario a 36% probability.
Another bullish continuation for salesforceNYSE:CRM is looking at a potential strong bullish continuation after the stock has broken out of the bullish flag with a huge bullish bar with the support of a spike in volume. Furthermore, the stock has been in an uptrend channel since Dec 2022 and it is likely to continue higher. Hence, we are adding on to a buy position on CRM with near-term target price of 408. Should correction happens, the next support will be at 297 and 316.
Momentum is stable in the mid-term after stochastic may potentially cross right above the mid-point line. 23-period ROC has been rising and has broken past the 50-line. Directional movement index is showing early signs of the rise in bullish strength.

Salesforce CRM - PEAD (Post Earnings Announcement Drift)Salesforce CRM
PEAD (Post Earnings Announcement Drift)
This is a swing trading strategy.
You buy on a positive surprise in the quarterly or annual report. It has been shown that this surprise impacts the stock price for some time. This refers to Brandt and Kishore from the Fuqua School of Business at Duke University in the USA.
Points in the algorithm I follow:
03.12.2024: Q3 after market open.
The first trading day where Q3 results are known should see the price rise by more than 4.15%.
04.12.2024: 367.87$ - 331.43$ = 36.44$, which corresponds to 10.99%.
Buy on the 4th trading day, Monday 09.12.2024, and hold for 83 trading days until Wednesday 09.04.2025.
For the relevant index, the MA (Moving Average) should be above 87 at the time of trade. You can choose what suits you best, but:
Nasdaq index > MA 87
NYSE > MA 87
S&P > MA 87
The trade is only made when the general stock market is positive.
You can supplement with technical and/or fundamental analysis: CRM is in an upward trend and well above a green cloud in Ichimoku.
Buy at market open Monday 09.12.2024 at the price of 360$. I could have bought at a better price later in the day, but the idea is not to spend the whole day in front of the computer, and to execute the trade. However, this can be adjusted to fit personal preferences.
Set stop loss at 324$, which corresponds to 10%.
The strategy works best with large, liquid companies, value stocks, and smaller with growth companies. But for me, it has also worked on the latter.
I have tested the strategy a bit over the first half of 2024 with up to 5-6 companies at a time from NYSE. I’ve made a gain of 50% of the invested capital. But the strategy doesn’t generate profits every time!
Remember, you must do your own research and evaluation before buying or selling.

$CRM short setup part two. $280 target.Check out my recent post on $CRM. This name is down from it’s highs already 11% or so but 20% is correction territory so I can see this name hitting $280 area. $280-$285. Multi day put swing.
WSL

$CRM lower guidance, weak numbers, AI poopieNYSE:CRM should see sell pressure into the $285 zone and if it doesn’t hold expect $270’s.
WSL

Salesforce - Integration of AI with great earnings = growth!Hi guys today we would be looking into Salesforce - with the upcomming Q4 earnings report it's expected for some great growth : Fundamentals below -
Salesforce is poised for a promising earnings report, reflecting its robust performance and strategic advancements. In the third quarter, the company reported an 8% year-over-year revenue increase to $9.44 billion, surpassing analysts' expectations. This growth is attributed to strong client spending on its enterprise cloud services and data cloud, driven by the integration of artificial intelligence to streamline corporate workflows.
The introduction of Agentforce 2.0, an advanced version of its AI agent program, allows users to deploy AI agents within the Slack app and includes enhanced features such as improved reasoning, integration, and customization. The full release is expected in February 2025. Wall Street has responded positively, with analysts maintaining optimistic projections. Salesforce plans to hire 2,000 people to promote its AI software, countering the industry trend of layoffs due to the high costs of AI projects. Salesforce's stock surged by 11% after the initial announcement and has risen 33% year-to-date, outperforming the S&P 500. Analysts anticipate continued investor enthusiasm and potential gains of up to $80 per share as more businesses adopt the platform.
Analysts are optimistic about Salesforce's financial outlook. Wedbush analyst Dan Ives has raised the Q1 2026 earnings estimate to $1.90 per share, up from the prior estimate of $1.88, maintaining an "Outperform" rating with a $375 price target.
The consensus estimate for Salesforce’s current full-year earnings is $7.48 per share.
The company's stock performance has been strong, with shares trading at $361.99 as of the latest report. The stock has a market cap of $346.06 billion, a price-to-earnings ratio of 59.54, and a beta of 1.30. The business has a 50-day simple moving average of $309.97 and a two-hundred day simple moving average of $272.88.
In summary, Salesforce's strategic focus on AI integration, strong financial performance, and positive market reception position the company for continued success in the upcoming earnings report.
Target: 365 - Just below the ATH so we can have some protection of the trade
SL: 294 - just below the formulated GAP which we covered

CRM .. Salesforce Levels for all to enjoyHere is a level for you to enjoy...pick which one you want. But don't forget to hit the Log "L" on the bottom right..
more precise look at the 10 min here:
A view from far out.. the Daily Rainbow Railroad in its glory:

$CRM Bearish outlookSimple Support and Resistance... Whats your thoughts
Salesforce is a company that creates cloud-based software to help businesses manage their relationships with customers. They offer a range of solutions, including tools for sales, customer support, marketing, and more. The company was started by Marc Benioff and Parker Harris back in 1999 and is based in San Francisco, CA.

Salesforce (CRM) – Bullish Setup AnalysisWeekly Chart – Cup and Handle Formation
• The stock has formed a classic cup and handle pattern on the weekly timeframe.
• Moving Averages (20 & 150) are trending upwards, supporting bullish momentum.
• After breaking out, CRM retested the breakout level as support and is now showing signs of continuation.
• The potential long-term target stands at +60% upside, aligning with the measured move projection.
Daily Chart – Consolidation & Breakout Retest
• The stock is currently trading within a converging channel, stabilizing near the breakout level.
• A wick rejection at the breakout price suggests strong demand at this level.
• Stochastic oscillator is turning upwards, indicating the start of a potential bullish cycle.
Final Thoughts
If momentum continues, CRM has the potential for a strong bullish move. Watching for confirmation and volume increase on continuation.
What’s your take on this setup? Let me know in the comments!

Salesforce: triangle on a upwards channelSalesforce is now moving on an upwards trendline parallel to a previous one.
At the same time, the trend is Bearish, which makes room for a Triangle formation.
Overall, it looks Bullish on the short-term, while keeping an eye on which side of the triangle it will break out.
By instinct, I would say upwards, but let's wait to have data before taking a decision.
Salesforce May Be OversoldSalesforce broke out in November. Now, after a period of consolidation, some traders may see potential for more upside in the software giant.
The first pattern on today’s chart is the March 2024 high of $318.71. CRM probed that level after the election and again in January. Prices have returned to it this week. Will old resistance become new support?
Second, the 100-day simple moving average (SMA) crossed above the 200-day SMA in late November and has approached the stock from below. Those signals may be consistent with a new uptrend that has potential for continuation.
Third, stochastics have dipped to an oversold condition. Investors may now watch for a crossover to signal a potential turn.
Finally, earnings are due after the closing bell on February 26.
TradeStation has, for decades, advanced the trading industry, providing access to stocks, options and futures. If you're born to trade, we could be for you. See our Overview for more.
Past performance, whether actual or indicated by historical tests of strategies, is no guarantee of future performance or success. There is a possibility that you may sustain a loss equal to or greater than your entire investment regardless of which asset class you trade (equities, options or futures); therefore, you should not invest or risk money that you cannot afford to lose. Online trading is not suitable for all investors. View the document titled Characteristics and Risks of Standardized Options at www.TradeStation.com . Before trading any asset class, customers must read the relevant risk disclosure statements on www.TradeStation.com . System access and trade placement and execution may be delayed or fail due to market volatility and volume, quote delays, system and software errors, Internet traffic, outages and other factors.
Securities and futures trading is offered to self-directed customers by TradeStation Securities, Inc., a broker-dealer registered with the Securities and Exchange Commission and a futures commission merchant licensed with the Commodity Futures Trading Commission). TradeStation Securities is a member of the Financial Industry Regulatory Authority, the National Futures Association, and a number of exchanges.
TradeStation Securities, Inc. and TradeStation Technologies, Inc. are each wholly owned subsidiaries of TradeStation Group, Inc., both operating, and providing products and services, under the TradeStation brand and trademark. When applying for, or purchasing, accounts, subscriptions, products and services, it is important that you know which company you will be dealing with. Visit www.TradeStation.com for further important information explaining what this means.

What's in the Cup?Salesforce completed a classic cup and handle pattern. I'm anticipating a rally from here as it's testing the SR Flip level or the cup top.

is SALESFORCE making a classic breakout and support testing?Salesforce CRM is looking very good.
It already had a retracement after a double top, broke out of the ATH and now is looking to test that zone again. In my opinion the price is a little bit high right now, so I would prefer to wait for it under the 312 dollars (hoping the support doesn't resists) but is a great addition to your portfolio nonetheless

Bearish on Salesforce. CRMA very nice confluence here as well. The most glaring is the green MIDAS line cross on the background of downgoing vWAP, US lines, which are above the candlesticks. Looking below, the picture adds more confidence in crossing of the midline for both VZO and Ehlers Stoch/RSI indicators. Price action alone is very bearish. Good luck out there.

CRM: Sell ideaOn CRM we have a sell idea as you can see on the chart because we have the breakout with force the support line and the vwap indicator by sellers.

CRM on the way upSimilar to DIS ... breaking drowntrend .. recaptured 50 dma and moving up towards prev highs of 370. There is atleast 5% in this trade from here.

$CRM $340 lagger in AIHello, I like this name for a pickup speed off the new presidency, CEO love and support for Trump and I personally like the technical setup here. $340c short term, 1/31 or out further.
In $2.07.
WALL ST. LOSER

$CRM Cup and handle neckline check backNYSE:CRM Checked back on the cup and handle neckline. If you are a bull, this is where you get in with a TIGHT STOP below the neckline.
The full measured move of this cup and handle breakout is the $450 area. If it breaks down below the neckline, a pullback to the $280 area is not impossible.
As always, I share my opinions and trades. I'm not suggesting anyone follow my trades. You do you.

crm looking ewwwe have a failed auction at resistance and now are testing the rising support here. unfortunately there is another technical issue that i cannot show you duo to me needing another chart, our long term trendline was broken on the failed auction and the retrace to 347 was a retest of the once support trendline as resistance.
we have another failed auction in the making if we cannot hold value and the 335 support we will test vwap most probably and lower vwap at 292 which are all decent support areas.

Salesforce: Wave b Top Established!On December 4, CRM peaked briefly, hitting a new record high at $378.16. Since then, the price has been unable to revisit this level, initiating a first downward impulse. Therefore, we now consider the prominent wave b top as established and are preparing for a significant sell-off, with extension targets below the $274 support. Thus, the still ongoing correction should continue.

Very long pattern on crm! This is a massive cup
And handle. This means you can’t expect it to play out quickly. But as you can see from the breakout it does move have momentum. So it’s active to about 500$. That’s a huge move. 40%! Capturing even a piece of this would be great for anyone! But keep in mind. Might be a better leap or even short term spread?
