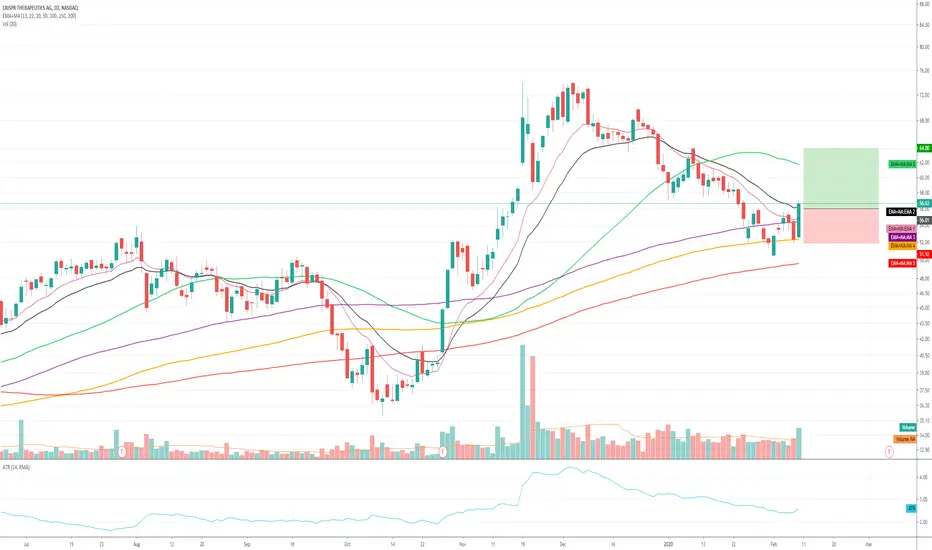
Short $CRSP - Bearish shooting star candle after extended rallyShort $CRSP - Bearish shooting star candle after extended rally and at resistance
CRSP/N trade ideas

DressmNice I have fun Watching this thing breathe low time frame it looks like its suffocating but one week older candles looks alive I wonder if that translates long term amazing buy under $35.
Thanks for stoping in.
Shit head


Lader Be nice to see this get some traction and back into the yellow channel, may just consolidate in the green channel for a bit yet too. Blue lines will be support and resistance. I think it could go to $60 range.

Still waiting for $44.49 (updated)Still in a downtrend until confirmation of an uptrend. $44.49 seems to be the next swing opportunity.

CRSP Bull RocketAs we see here the volatility is steadily increasing and is possible going to break that line and rocket up who knows how long...


CRSPLooking at the chart it is testing the previous swing and if it holds up it will continue towards its previous high.

Looking for a retracement to the 0.5 Fib extension @ $42.26Short-term bearish - the 50MA is curling downward. Should find some support at the 0.5 fib retracement level at $42.26.

CRSP LONG breakout potentialCRSP got some attention a few months ago with the Netflix series "Unnatural Selection" in which it melted up for a while before crashing down on profit taking
As CRSP broke its minor downward trendline and came back down to a retest, a long position with a good reward to risk ratio can be entered with a tight stop.
Factors leading to the decision:
The recent downtrend has been broken after price recently bounced at a major support line
The 20ma was broken, pulling in moving-average traders off the side-lines
A recent low offers a perfect spot to put a logical technical stop
Price is now finishing a retracement after bouncing off recent highs, so we can avoid that pain by entering now that the retracement seems to be flattenting out
As always, respect a tight-stop. If it rips up, let it run and trail stops behind.

CRSP - Month was on td 9 perfected sell set up, week on imperfected buy set up ,what it meant to me, next possible rebound at @ 46 but this stock can easily test the low range at PRZ 38.50

Is CRSP trading in a descending triangle or bull flag?Key Takeaways
A descending triangle is a signal for traders to take a short position to accelerate a breakdown.
A descending triangle is detectable by drawing trend lines for the highs and lows on a chart.
A descending triangle is the counterpart of an ascending triangle, which is another trend line based chart pattern used by technical analysts.
Bullish flag formations are found in stocks with strong uptrends. They are called bull flags because the pattern resembles a flag on a pole. The pole is the result of a vertical rise in a stock and the flag results from a period of consolidation. The flag can be a horizontal rectangle, but is also often angled down away from the prevailing trend. Another variant is called a bullish pennant, in which the consolidation takes the form of a symmetrical triangle. The shape of the flag is not as important as the underlying psychology behind the pattern. Basically, despite a strong vertical rally, the stock refuses to drop appreciably, as bulls snap up any shares they can get. The breakout from a flag often results in a powerful move higher, measuring the length of the prior flag pole. It is important to note that these patterns work the same in reverse and are known as bear flags and pennants.
EOM.

CRSPR is the future. Inverted H&S and short-term bullish signalsBullish chart signals and looks like good outlook. Recent earnings has made the IV way more attractive for entry.
Look for $65 target in next month and then back up to $75.
Trade with caution. There is a 6% short interest on this. Not considered high, but not nothing.
CRSPR technology is the future. With treatments already being implemented such as for Duchenne's Muscular Dystrophy, this technology is going to keep making strides.
CRSPR is a gene-editing tool used by scientists to engineer animal models and create potential treatments for genetic disorders.

CRSP - is the rally over or just getting started?Since my last published idea on NASDAQ:CRSP we have seen bullish momentum as CRISPR Therapeutics posts higher lows and higher highs. We have also seen the 10 EMA crossing above the 20 EMA potentially signaling that we are just getting started. Recent low was supported by a newly established trend line as well before rallying to close above the 10 EMA. CRSP also beat earnings estimates last week causing a temporary bump in price. The coming days should be very crucial for CRSP.

DFT - Resultant dephasing price_CRISPR try a pull backTwo TP above the rope.
-Long term waves on current price rope are building up a momentum.
-Price waves resultant is almost positive (green).
-Green cloud on volume resultant is trying to creat an escape channel (wormshole).
Because of this last indicator still in ""orange light", i wouldn't try to TP above TP1. Btw still a fair trade :)
GL
nb: More than just a TA, CRISPR has a monumental fondamental ;).

CRSP is going to rally hard leading up to it's next earnings.You're gonna want to go long on this. www.tradingview.com

CRSP - Ready for BreakoutWhile CSPR did finish Friday down 3.7% it also happened to close on top of what was previous resistance during it's late 2019 rally. If it were to break below this level my next target would be the psychological $50 area which has acted as solid resistance on the way up and should now provide good support. Support at $50 would also confirm retracement to the 61.8 fib level potentially signaling the bottom of this correction. Lastly i would like to mention the RSI which as of Feb 07 was sitting at 35.13. During the previous breakout the RSI was much higher and resulted in a double top. This time it would seem that we have even more fuel in the tank.

CRSPDoubt it will climb any higher, if it clears 56.29 could move to 0.382, but looking at momentum and RSI it doesn't look promising.

Waiting for breakout in Crispr Therapeutics
Bullish channel devolved and a perfect retrace complete.
Large time-frame you will see a massive Cup and Handle pattern developing
Average analysts price target $74 | Overweight
Short interest 9%
Company profile
CRISPR Therapeutics AG engages in the development and commercialization of therapies derived from genome-editing technology. Its proprietary platform CRISPR/Cas9-based therapeutics allows for precise and directed changes to genomic DNA. The company was founded by Rodger Novak, Emmanuelle Charpentier, and Shaun Patrick Foy in 2014 and is headquartered in Zug, Switzerland.

Trade Journal: Short CRSP - 1/23/2020Shorted CRSP today based on the descending triangle pattern on the Daily Chart. CRSP has recently rejected a previous high and looks to be pulling back/down trending. I am expecting CRSP to continue this down trend till around the 200MA on the daily chart at 50.00.
Entry - 56.70
Stop Loss - 59.50
Target 1 - 50.00
Target 2 - 45-46

Tightening falling wedge pattern with agressive breakout?57$ looks like it's holding up before close and there has been no agressive sell off from these levels. I'm wondering if this might be the turning point for this stock before it goes higher. Looks interesting from an elliot wave perspective and there could be some fundamental catalysts for this stock with the corona virus headlines. I read an article about virus problems in chickens and how they had solved it with CRISPR. This is just me speculating but to me it looks like a good entry point if the wedge/pennant breaks. It also looks like it could be oversold pretty soon.
