Return to the mean-Covid ignored. We returned to the mean.
-Purple area = consolidation zone = buy zone.
CRISPR is a truely amazing discovery. Imagine if we could perfectly edit genes within 5 or 10 years. I don't think everyone understands how big this is. Good luck! Target 1 = double top, other 2 the fibonacci extensions.
Edit: Don't buy before we stay above the 20MA.
CRSP/N trade ideas

CRSP Possible BottomCRSP is currently at key support and the 200 week moving average. This may be a possible bottom, however it is best to look for an entry on a lower time frame (4hr or 1hr chart) before entering. Bottoming patterns to look out for are inverted head and shoulders, double bottoms, and/or higher highs with higher lows.

CRSP - WEDGE ON SUPPORT - PIVOT CANDLE CONFORMATION **ON ALERT**All,
Pretty easy to see why you would be bullish here. Few things need to happen.
1) full candle break watch for a gap etc
2) needs to break horizontal SR at 81.50s (full candle above)
3) market needs to hold this in here if it were to somehow lose these yellow levels would be big downside imo.
Add alerts and keep this on a short timeline maybe literally one more day.

CRSP: 45, then LongThat was a nasty double top on the monthly time frame.weve come this far and we are over sold but we may come all the way down to the main support. Comforting as well to see volume increasing and picking up again recently.
Over sold on multiple indicatora.
Not trading advice.

$CRSP RSI Oversold; Expecting Bounce to $105Historically everytime RSI was this oversold, stock had a nice bounce/run ~ based on history expect a bounce to to $105 /// Additionally $75 seems like a strong support...I think bottom is in - I'm long Dec & Jan calls / not financial advice do your own research NASDAQ:CRSP

CRSP Falling Wedge/RetestCRSP looks to be retesting the breakout to all time highs while forming a falling wedge. If this level holds it could be a good entry point. Wont be jumping on this anytime soon but interested in the setup will be watching.

CRSP CRISPR Therapeutics at 52 Week LowCRSP CRISPR Therapeutics 52 Week Range 77.42 - 220.20
Now the price is 80.08usd.
Bounced from its last support level.
Barclays has a price target o 148usd for it.
My price target by Q1 2022 is the 100usd resistance.
Looking forward to read your opinion about it.

CRISPR lookin readyIf crispr can hold support over the next few weeks, we could see some nice returns.
The weekly shows a falling wedge pattern with class a bullish divergence maturing.
A move to the .618 could mean nice gains.

This thing's going higher imo SWING IDEA
I like Crsp as a long stock hold but i always think the two week outlook on this thing is huge, price targets in post but gosh darn i like it all bullish signals
Godbless, safe trading to all bulls and bears
-nio_to_da_moon225


CRSP ANALYSISCRSP broke its trend line to the downside coming out of a head and shoulder pattern, has a bullish regular divergence. There is chance to broke to the next level of $80 where it has found resistance in the past, but divergence indicates that it probably continue to consolidating and then broke to the upside. It has found resistance at these levels in the past more then 3 times which indicates is a strong level of resistance. It's sitting at the golden zone level at the fibonacci, usually a good point for stocks to turn over. I hope it is helpful to someone. Not financial advice, thanks for the feedback!
CRSP rompió su línea de tendencia a la baja saliendo de un patrón de cabeza y hombros, tiene una divergencia regular alcista. Existe la posibilidad de romper al siguiente nivel de $ 80 donde ha encontrado resistencia en el pasado, pero la divergencia indica que probablemente continúe consolidándose y luego rompió al alza. Ha encontrado resistencia en estos niveles en el pasado más de 3 veces, lo que indica un fuerte nivel de resistencia. Se encuentra en el nivel de la zona dorada en el fibonacci, generalmente un buen punto para que las acciones cambien de direccion. Espero y le sea util a alguien. No es un consejo financiero, gracias por la retroalimentacion!

CRSP is bullish here, build up is enough to overcome downtrendCRSP is bullish here, build is enough to overcome downtrend
RSI has been progressively gaining momentum

CRSP Crispr Trend Change PossibleThis is a daily chart of CRSP. As you can see, I marked the areas where high volume has occurred in the past. It's a little hard to see as I had to make the vertical lines almost transparent so you could see the candle and the volume I marked.
In every recent case a high volume daily candle has marked a trend change. This may not be the case now, but from the looks of it, it would hard to be short after the bulls stepping up like this during a down trend.

Pull Back FishingCRSP gapped down yesterday. The candle it gapped down on closed green and quite a bit higher than the day's low. There was also a pocket pivot, a large money footprint, that formed even though negative volume is on the low side. Someone or some folks, did not want to see this go lower or they took advantage of the lower price. Obviously, a lot of shares were purchased on the gap down yesterday.
Price was below the lower band set on 80. Price eventually returns to the bands.
Short interest is 3.84%.
Biotech has been a struggle and this could go lower. I would think these buyers will come back in before it fell too much as evidenced by yesterday's reaction to the gap down.
The moving averages need a lot of work )o:
No recommendation/earnings 10-27 after market close

CRSP look below 97 and fail, strong support level.NASDAQ:CRSP
The lines represent the price level that has been traded upon or will be traded.
The more it hit the line, the stronger the level.
It can be use to set profit taking price or stop loss price.
Every level is of same significant until order flow trades upon it.
DYODD.

Bottom of the trend line - IF hold, then bulls have it - $200+Trend is your friend.
Part of the future of medicine belongs to crispr.
Please don't take trade advice from some random dude from Florida. Do your research and good luck!

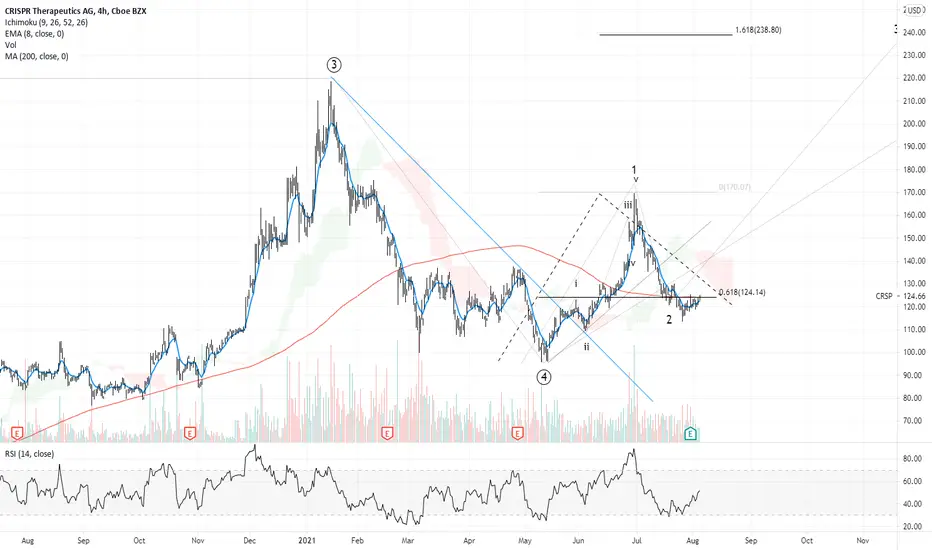
CRSP: Drop before 50% up move! (Requested by Chartguru1)Blue 12345 = wave 1 of Weekly
Green ABC = wave 2 of Weekly
This means we can prepare for Wave 3 of Weekly which should take us to retest the $220 high.
However, there's strong Supply Zone at $170-180 area. This area seems more likely to halt wave 3's move.
Disclaimer: I'm not giving any trading and investing advice. I'm just sharing my chart observations.
If you have any symbols that you'd like me to analyze, feel free to drop me a comment.

CRSPFrom 2018 to 2020, there may just be an alphabet and a different line, but it is not applied by ALT variants.
You can tarnish after the test with blue.
It can go lower, since the 5th stretched was-the zones are on the chart.
All development is in the distant future, the stock is VERY volatile, it can easily still go to the prices of the 90-70 level. It is more suitable for medium-and long-term investors. This is a deal up to 3 is possible only under extremely favorable circumstances, so it is from a year.
Entry point # 1-High risk:
According to the current ones, we are catching a U-turn. "catching a knife".
Entry point # 2-Conservative strategy (safe):
$ 128.4. This is a level above all emas. We are waiting for a breakdown, a rollback and again growth from this level – this is the safest option, since the price can go to the 90-70 zone. We will consider further the scenario when the price is fixed above our level.
P/R=3,5
✅ Take profit:
TP1= $ 144.37 (30% fixed – serious resistance)
TP2= $ 160 (65% fixed-serious resistance)
TP2. 5= $ 182 (75% fixed-intermediate, where you can close the entire transaction, those who believe in the future of CRISP technology can leave. P/R=5.5.)
T3-T4 – Long-range goals to where the price will go, in case of success with the company. TP3-resistance – here already P/R=9.3

CRSP Harmonic Pattern (M) 1H, 1D, bullish to at least 124.78CRSP has a bullish Harmonic on 1H and 1D timeframe. Is aiming to grow to at least the resistance of 124.78.
There is also strong bullish signs on the Weekly Chart supporting the Harmonics.

CRSP longdaily symmetrical triangle breakout, watching out for $136 for 1 10% trade. Stop loss below bottom trend line if we fall back down.

Crisper Starting to set up. Chart starting to come together in my veiw. Symmetrical triangle. Strong consolidation after blow off top…. Previously ripped out of long consolidation. Could be primed for a rip to 145 resistance at least… target is 250
lower support 117$ upper Resiatnce 145
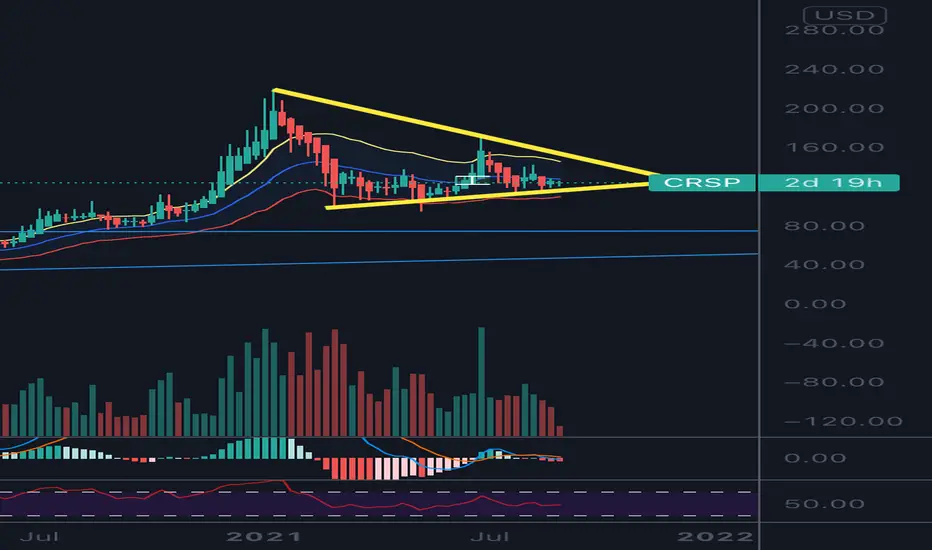
$CRSPHuge symmetrical triangle on the daily chart right at support.
You might want to keep this on your watchlist for a possible break or reversal.
- Factor Four

Estimating a nice upmove from here.Looks like correction is over and we should see it pushing up from here.