CRWD trade ideas

$CRWD H&S Bear Pennant Breakdown$CRWD is breaking down through channel support and top formation.
Patience.

Bias more on downside for CRWD3rd Sep 2022
Break below 50% fibo = $165
Next Support @ 38.2% fibo = $135

Rising Bear Channel Breakdown $CRWDPerfect rising bear channel.
As you can see since the channel began forming June 7, 2022 $CRWD rallied to top of channel, price action then returned it to support line of $148 it then rallied again towards top of channel, only to be rejected back support line. Next subsequent rally only took it to upper 1/3rd of channel, not all the way to top of channel, that was the first sign of weakness. Each subsequent rally or bounce only took price back to middle of channel (dashed line), until finally price action could not even get off support line until it finally broke down, today 8.31.22.

Further downside for CrowdStrike? CrowdStrike
Short Term
We look to Sell at 189.88 (stop at 203.91)
Preferred trade is to sell into rallies. Buying continued from the 61.8% pullback level of 199.22. Posted a Double Top formation. There is scope for mild buying at the open but gains should be limited. Our outlook is bearish.
Our profit targets will be 130.20 and 120.15
Resistance: 200.00 / 240.00 / 288.00
Support: 169.00 / 153.00 / 130.00
Disclaimer – Saxo Bank Group. Please be reminded – you alone are responsible for your trading – both gains and losses. There is a very high degree of risk involved in trading. The technical analysis, like any and all indicators, strategies, columns, articles and other features accessible on/though this site (including those from Signal Centre) are for informational purposes only and should not be construed as investment advice by you. Such technical analysis are believed to be obtained from sources believed to be reliable, but not warrant their respective completeness or accuracy, or warrant any results from the use of the information. Your use of the technical analysis, as would also your use of any and all mentioned indicators, strategies, columns, articles and all other features, is entirely at your own risk and it is your sole responsibility to evaluate the accuracy, completeness and usefulness (including suitability) of the information. You should assess the risk of any trade with your financial adviser and make your own independent decision(s) regarding any tradable products which may be the subject matter of the technical analysis or any of the said indicators, strategies, columns, articles and all other features.
Please also be reminded that if despite the above, any of the said technical analysis (or any of the said indicators, strategies, columns, articles and other features accessible on/through this site) is found to be advisory or a recommendation; and not merely informational in nature, the same is in any event provided with the intention of being for general circulation and availability only. As such it is not intended to and does not form part of any offer or recommendation directed at you specifically, or have any regard to the investment objectives, financial situation or needs of yourself or any other specific person. Before committing to a trade or investment therefore, please seek advice from a financial or other professional adviser regarding the suitability of the product for you and (where available) read the relevant product offer/description documents, including the risk disclosures. If you do not wish to seek such financial advice, please still exercise your mind and consider carefully whether the product is suitable for you because you alone remain responsible for your trading – both gains and losses.

CRWD. Correction Complete. Expecting bearish continuation to start with CRWD
Everything is explained on the chart but we have a big bearish H&S complemented with a Bear Flag with strong monthly rejection from 200 & Neckline
Have December 16th Options

$CRWD H&S Bear Pennant BreakdownHi! $CRWD displays a fantastic symmetrical H&S top formation. This is accompanied by a bear pennant formation forming at the neck line breakdown area of $169. The entire formation is bearish. Nothing about this stock appears friendly. PE is 167 and trading at 43X price to book, (which is very expensive).

CRWD Bullish on ERBullish structure towards previous high. Possible a retest 3B (Green pivot support) area.

CRWD CrowdStrike Holdings Options Ahead Of EarningsLooking at the CRWD CrowdStrike Holdings options chain, i would buy the $290 strike price Calls with
2023-3-17 expiration date for about
$7.56 premium.
Looking forward to read your opinion about it.

CRWD is next for the BIG move down! Must SeeWe are looking at CRWD for the next big continuation down
We have already booked over 300%+ from CRWD on the first leg down shorting from 220 to sub 160.
Now we are looking for a pull back into the 170s or low 180s, ideal to continue short.
There is a TON of bearish momentum on this play so there may be a early dynamic entry to secure positions however we are looking for 3-4 month contract to first take CRWD down to $120 but ultimately sub 100 around the $90 mark.
Keep this one on your watch list, one of our favorite shorts for the year!
We are staring at a Big Head and Shoulders bearish pattern with a Bear Flag to lead into the break.
Looking at Volume we have confluence there as we started to "dry" up towards the top and activity increased during the B corrective waive and failed to make a NH. (New High)
Monthly charts are just as bearish as were looking at a huge bearish continuation bar with last months close.
Looking at the A, B, C move. The C leg takes us to our destinations which also agrees with the projections from the head and shoulders pattern.
We have earnings in June which may take us to our destination much quicker than the 3-4 month contract we are looking for but we are securing extra time to ensure we get there.
Very Similar move to UPST we called to perfection. We have the link to that idea provided.

$CRWD huge top formation$CRWD huge H&S top formation with bear channel formed
at neckline of approx $169.
If $169 give way, downside obj <$100.

$CRWD Earnings possibilitiesLooks like it will trend down towards $187 and will sit on support. Positive or negative earnings will send it higher or break support. Important to note that they typically beat earnings

Bullish- Watching Closely Keeping a close eye here on CRWD heading into earnings on 10/8'. CRWD has been testing the $195.11 mark for quite some time now and just closed out the week reclaiming its 20-Day SMA. Additionally, it would look like a smaller ascending triangle is forming within a broader falling wedge, accompanied by some slight bullish hidden divergence on the RSI, Bollinger bands squeezing (Not Pictured), and an increase in buyer volume relative to seller volume- all points to a breakout coming. I will be looking for a breakout from this wedge (Broader Markets Permitting) - Just some support and resistance levels along with some RSI-based supply and demand zones to keep an eye on in the meantime - Bullish and looking for a breakout from this wedge & triangle
--Previous Charts & Price Targets Attached Below--
PT1- $189.36
PT2- $187.64
PT3- $191.48
PT4- $195.37


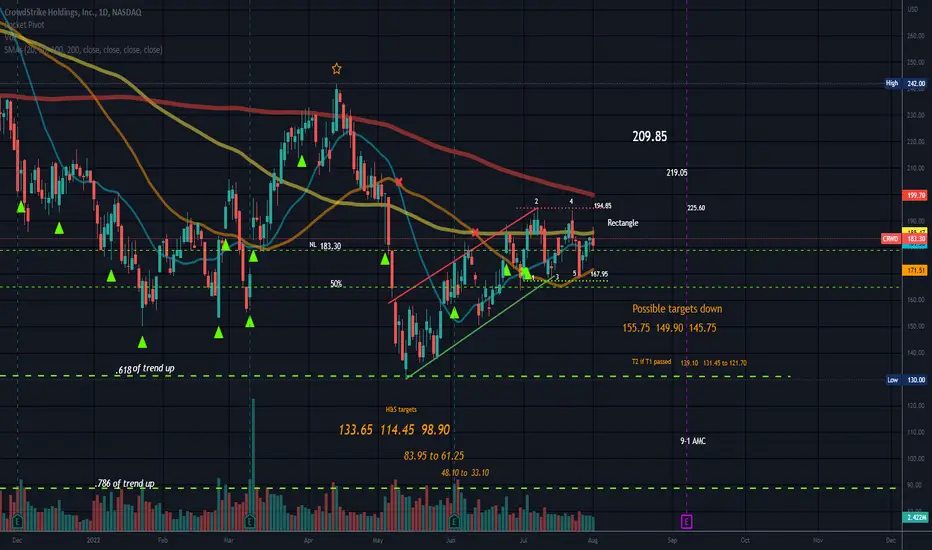
RectangleCRWD has an ugly looking top and price is barely above the neckline which is 183.30. The neckline is a level of support until broken with a downtrend.
I see a channel up that spread out and went horizontal after a break of the bottom trendline of the channel. The channel up looks a bit too long and heavy to be a flag.
A small rectangle is forming with 5 douches so far. This is a horizontal trading channel that is neutral until a trendline is broken with a trend in that direction. Some use 2 candles, some use 3 or more candle closes to confirm a trend and even then it can change directions. The rectangle is just above the 50% trend retracement level.
Volatile stock.
Targets above are for a break of the top trendline of the rectangle. (194.85)
Targets below are for a break down from the rectangle and separate for the ugly top.
No recommendation
It's way too Crowded in here!CrowdStrike
Short Term
We look to Sell at 178.02 (stop at 186.93)
Preferred trade is to sell into rallies. Reverse trend line resistance comes in at 178.00. Selling continued from the 50% pullback level of 186.00. We therefore, prefer to fade into the rally with a tight stop in anticipation of a move back lower. Our outlook is bearish.
Our profit targets will be 136.75 and 120.15
Resistance: 178.00 / 193.50 / 240.00
Support: 169.00 / 153.00 / 130.00
Disclaimer – Saxo Bank Group. Please be reminded – you alone are responsible for your trading – both gains and losses. There is a very high degree of risk involved in trading. The technical analysis, like any and all indicators, strategies, columns, articles and other features accessible on/though this site (including those from Signal Centre) are for informational purposes only and should not be construed as investment advice by you. Such technical analysis are believed to be obtained from sources believed to be reliable, but not warrant their respective completeness or accuracy, or warrant any results from the use of the information. Your use of the technical analysis, as would also your use of any and all mentioned indicators, strategies, columns, articles and all other features, is entirely at your own risk and it is your sole responsibility to evaluate the accuracy, completeness and usefulness (including suitability) of the information. You should assess the risk of any trade with your financial adviser and make your own independent decision(s) regarding any tradable products which may be the subject matter of the technical analysis or any of the said indicators, strategies, columns, articles and all other features.
Please also be reminded that if despite the above, any of the said technical analysis (or any of the said indicators, strategies, columns, articles and other features accessible on/through this site) is found to be advisory or a recommendation; and not merely informational in nature, the same is in any event provided with the intention of being for general circulation and availability only. As such it is not intended to and does not form part of any offer or recommendation directed at you specifically, or have any regard to the investment objectives, financial situation or needs of yourself or any other specific person. Before committing to a trade or investment therefore, please seek advice from a financial or other professional adviser regarding the suitability of the product for you and (where available) read the relevant product offer/description documents, including the risk disclosures. If you do not wish to seek such financial advice, please still exercise your mind and consider carefully whether the product is suitable for you because you alone remain responsible for your trading – both gains and losses.

$CRWD with a Bearish outlook following its earnings #Stocks The PEAD projected a Bearish outlook for $CRWD after a Negative Under reaction following its earnings release placing the stock in drift D.

CRWD BounceCRWD has a inclining support zone at the 173 area, with higher lows being met at this zone followed by higher highs. Thinking CRWD will bounce from here and reach a higher high around the 198 area.


CRWD-BUY strategyThis share has a lot of potential to test $ 185.00. The DARK MOON phase and GANN support and two hammer bottoms, provides a clear basis for the test of $ 185.00.
Strategy is BUY @ 171-173 and take profit @ 185.00 for now.

The Crowd Strikes BackTime to initiate order 66. Any remaining high price to sales stocks should be shorted into oblivion.

CRWD upside likely Crowdstrike holdings may embark on a mid-term upside after a diamond bottom was spotted. Furthermore, the bullish upside is confirmed by the ichimoku’s 3 bullish golden crosses after the candle has trended above the senkou-spanB and the last of kumo bullish twist has happened.
DMI shows a rising positive DM (blue) trended above 25 and with rising MACD confirm the bullish upside.

CRWD should hit $200There was a massive amount of compression on CRWD. Now as volatility increases we have bullish momentum. Fibonacci sequence shows $200 is reasonable.
