short term swing plantesting the Mando model with ICT concepts on CVNA - no position just observing - assumption next draw on liquidity is around 57
CVNA trade ideas

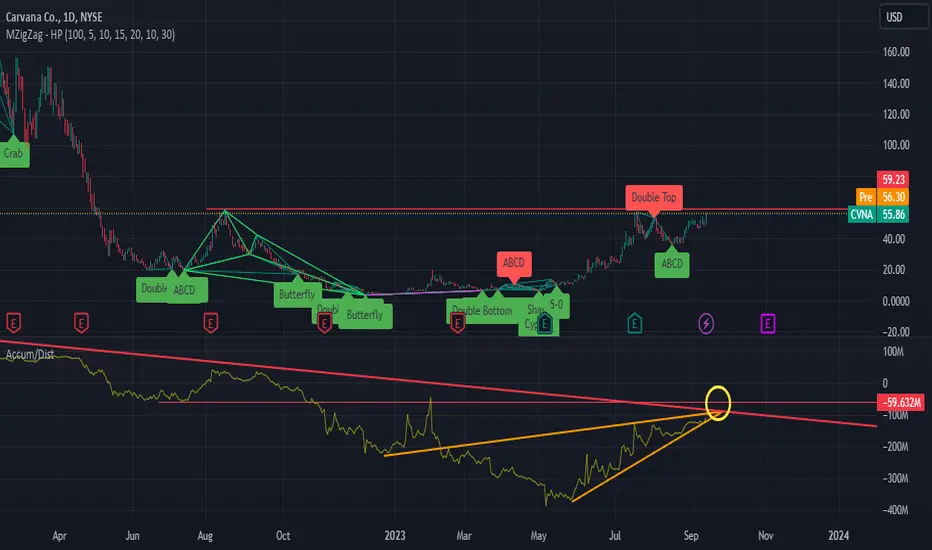
CVNA 3D Q4 2023, Q1 2024 Publishing this CVNA chart, as it's been an interesting one to follow. Above all the moving averages and looking to be retesting previous resistance.
Interested to see how this plays out considering the new, high interest rate environment and the current state of car sales.
From it's 3.60 low to now it's gone through a 10x rise, let's see how it opens 2024.


$CVNA: Is 35 Rejecting?CVNA has had a nice rip from the October lows but I'm wondering if that will fizzle out on the prospect of small cap stocks and retail names pulling back. May be short term but we'll need to see how things play out.

$CVNA - short before upward movementNYSE:CVNA has a good potential in the nearest feature, but it needs for correction.
29-31 is a layers to be ready to buy.
Does not constitute a recommendation.
#furoreggs #investing #stocks #shares #idea #forecast #trading #analysis
If you want to discuss, please subscribe and challenge this point of view )

CVNA Carvana Options Ahead of EarningsIf you haven`t bought CVNA here:
Then analyzing the options chain and the chart patterns of CVNA Carvana prior to the earnings report this week,
I would consider purchasing the 25usd strike price in the money Calls with
an expiration date of 2023-11-17,
for a premium of approximately $3.95.
If these options prove to be profitable prior to the earnings release, I would sell at least half of them.
Looking forward to read your opinion about it.

CVNA Shortsqeeze stockUpDating:
This is possible. Any idea please share it ?
Big hedgefond still holding CVNA in portfolio.
2 minutes ago
Comment:
We need a Big Green candle for positive sign for reversal.
Also it's look FLAG Pattern.


CVNALONG-TERM: Larger potential cup and handle, classic bullish divergence, falling wedge. (not financial advice)

$CVNA - looking good to reshortNYSE:CVNA
RSI getting high and momentum peaking as it approaches 52.50.
Short at 52.50 - 53.00 with duration of 3-4 weeks for options

$CVNA: Back up to 50?We'll see if CVNA can get an oversold bounce at least up into 50 or maybe more, we'll see

Are we forming a Bull Flag in Carvana?Hi guys! This is a quick analysis on my opinions on a current chart pattern that may be playing out in Carvana (CVNA).
At first glance you can notice the formation of a Bull Flag on the 1 Week CVNA chart.
As you can see we have had our Sharp price move to the Upside, almost resembling a straight line up. This is known as the Flagpole. The Volume spike seen in this move is supportive of this phase.
Followed by a pause or sideways action resembling a parallelogram. Here we see diminishing Volume, which is supportive of this phase as well.
This pause is to consolidate/ take a break from such a massive uptick in price during formation of the flagpole.
Flag patterns are known to be one of the most reliable continuation patterns and are said to rarely lead to Reversal of Trend.
Currently we are in the process, on our current Daily Candle of trying to breakout.
But we are meeting with Serious Resistance, depicted by a MASSIVE Upper Wick. Ideally, i'd like to see a larger body at the close of today's candle.
Could this still lead to a break out? Well one thing to check is the VOLUME.
For a breakout to occur we need to see a Massive Spike in VOLUME.
Which we have not seen yet.
Could be warning for a test back down to the lower rim of the parallelogram. This would also lengthen the time spent in forming this pattern.
Also note that Flag patterns are normally short term patterns and shuold breakout within 1 to 3 weeks, as per theory.
We are currently 8 bars in on the weekly chart indicating 8 weeks of consolidation.
This is Not Textbook. Which has me second guessing if this is a Bull Flag.
We have so much Resistance Above us, and the massive sharp move from $3, didnt create strong market structure. This in my opinion could lead to a collapse of current move with a massive correction.
Continue to monitor this. Remember to trade a Bull Flag:
You must wait for a breakout with CONFIRMATION before you take positions.
I would personally not take a trade inside the pattern. Watch for signs of rejection here as well.
__________________________________________________________________________________
Thank you for taking the time to read my analysis. Hope it helped keep you informed. Please do support my ideas by boosting, following me and commenting. Thanks again.
Stay tuned for more updates on CVNA in the near future.
If you have any questions, do reach out. Thank you again.
DISCLAIMER: This is not financial advice, i am not a financial advisor. The thoughts expressed in the posts are my opinion and for educational purposes. Do not use my ideas for the basis of your trading strategy, make sure to work out your own strategy and when trading always spend majority of your time on risk management strategy.

W PatternPossible Bearish Shark.
Valley 2 is lower then valley 1.
Short interest is over 45%!!!!!
No recommendation.

CVNA breakout continuation potentialHello,
It has been a very long time since I posted and I have started to go from an institutional style to adopting some Qullamaggie's breakout style. I still do longer-term trades as well.
This stock is breaking out from a range, not at tight as I'd want and not with as much volume as I would like but I am betting on previous momentum to help the trade work.

Monitoring bearish sentimentOn my short watch for a few reasons:
needs to breakout above $58
potential quadruple top
AD/Money Flow showing bearish divergence w/ stealth bear flag (yellow circle)
previous money flow/AD from July 2022 is currently acting as resistances.
I have no position, currently monitoring the bearish sentiment.. I need to go to the lower time frames 15min/30min possibly 5min chart to review intraday support/resistances level to see if the short is there for entry other than the weekly.. not trading or financial advice, please do your own due diligence
CVNA Inverse Head and ShouldersBig move to the upside today on high volume. Marking this for my own research. Current time: 2:35 pm (1.5H to market close)
Momentum needs to carry through into tomorrow and break the resistance between $55-58.


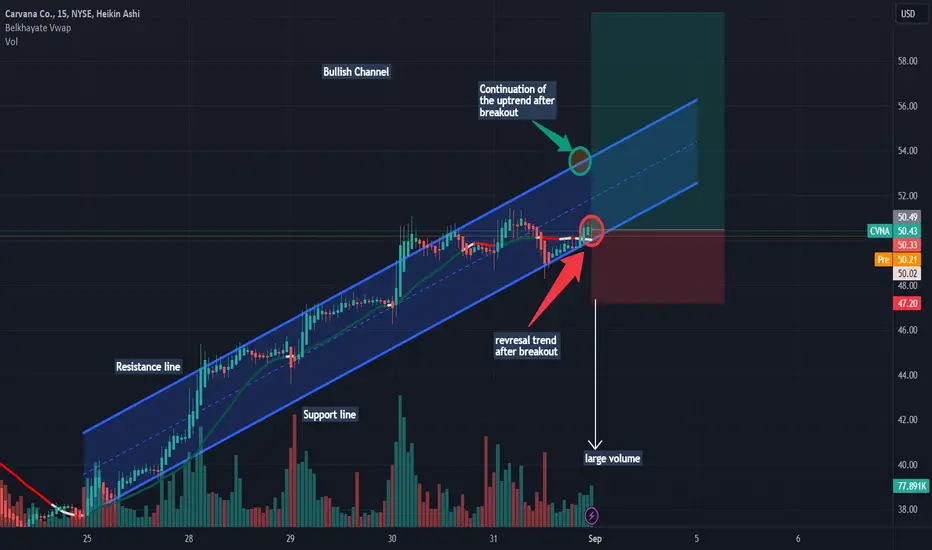
CVNA Tues Sept 5, Gameplan!
Stock to Watch: Carvana (CVNA)
(CVNA Long Above 52.25 , Short Below ! 50.59)
Carvana has shown impressive performance, gaining 12.08% since August 28, 2023.
On the latest trading day (September 1, 2023), the stock continued its winning streak, rising by 0.99% and closing at $50.85.
Notably, Carvana has experienced six consecutive days of gains, showcasing its strong momentum.
While the stock exhibited some intraday volatility, fluctuating between $49.68 and $52.62, it managed to maintain its upward trajectory.
Over the past two weeks, Carvana's stock price has surged by an impressive 29.69%.
Despite a slight drop in trading volume on the last trading day, it's essential to be cautious as it may signal a potential divergence and upcoming changes in the market.
The stock is currently in a robust short-term uptrend, suggesting the possibility of further gains.
Based on the current trend, Carvana is expected to potentially rise by approximately 75.42% over the next three months, with a price range between $71.37 and $125.23.
Technical indicators, including moving averages and MACD, are providing positive signals for the stock.
It's important to note that there have been some negative signals, including a recent sell signal, which led to an 8.87% decline.
Support levels for the stock are identified at $46.73 and $39.80, providing potential safety nets.
Carvana stock carries a "high risk" label due to its daily volatility, so careful consideration is advised.
The recent continuous upward movement suggests a slightly increased short-term risk.
For the upcoming trading day, a trading interval of approximately +/- $4.07 (+/- 8.01%) from the last closing price is expected.
Notably, insiders have been actively buying more shares than selling, reflecting positive sentiment among company insiders.
Overall, Carvana (CVNA) is a stock worth watching closely, given its positive technical signals and strong trend. It's currently considered a "Strong Buy" candidate.
Please remember that this information is for informational purposes only and should not be considered financial advice. Always conduct your own research and analysis before making any investment decisions.

CVNA: Buy ideaWe are in an uptrend and we will not go against this trend. However, if the resistance line is broken with force by a large green candle and followed by a large green volume it means that as soon as the second green candle appears with a large green volume we can enter a buy position. . On the other hand, we could have a reversal of the trend if and only if the vwap and the support line are broken with force by a large red candle and accompanied by a large red volume, this means that we can enter a position of selling on the appearance of the second red candle followed by a large red volume.Thanks.
$CVNA: Decent potential around 50CVNA seems like one to watch around the 50 handle, looking at the 55 level first

CARVANA CHANGED MY LIFEIm keeping bullish expectations on carvana I expect price to make a structural retracement
to my highlighted zone followed by stonks stonks stonks baby nothing to do with the underlying business at all just momentum and a whole lotta sass
that said here are some encouraging words from Ernie the CEO
“Carvana performed exceptionally well in the second quarter and set Company records for Adjusted EBITDA and gross profit per unit, which was up 94% year-over-year, all while continuing to lower expenses. Our strong execution has made the business fundamentally better, and combined with today’s agreement with noteholders that reduces our cash interest expense and total debt outstanding, gives us great confidence that we are on the right path to complete our three-step plan and return to growth,” said Ernie Garcia, Carvana's Founder and Chief Executive Officer.

shorts again?Five historical downward waves were created from the highest peak to the lowest bottom, after which only three upward corrective waves were formed, not a motive, and correspond to wave 4 of Elliott’s law. It is now possible that five more waves will be made to re-test the historical bottom of the currency, including the termination of wave C
