CVX trade ideas


Chevron Grinds Out a Higher Low as Energy Starts to MoveCrude oil is pushing back to its highest levels since September's drone attacks in Saudi Arabia. Energy stocks are following. The sector's the worst performer by far on a year-to-date basis. But in the last two weeks, the SPDR Energy Fund is leading all the other major SPDR tracking funds.
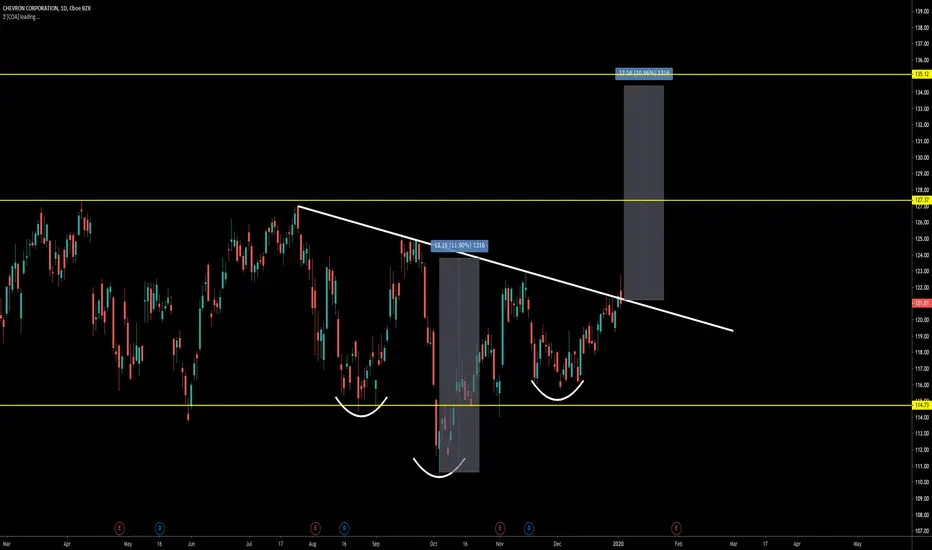
Chevron is the second-biggest company in XLE behind Exxon Mobil . Just as its bigger peer has been holding support at $67, CVX has been grinding out a higher low at $116. (See related XOM idea .)
The chart doesn't yet show a clear trend forming. However, the wider backdrop of oil trying to bottom creates a potentially interesting risk/reward to the upside if traders use $116 for risk-management.
Recapping the energy space, OPEC deepened its oil-production cuts by 500,000 barrels per day last week. Two days ago, the cartel forecast a crude deficit for 2020. Drilling in the U.S. has also dropped to its lowest levels in 2-1/2 years. Furthermore, two major geopolitical risks are fading: China and the U.S. have a trade deal and Boris Johnson's victory in the U.K. provides clarity about the direction of Brexit.


Chevron downside targetsThanks for viewing,
After record (and very profitable) drops in Crude in the last few days, Chevron will be put under significant profitability pressure. Well, now we have dipped well below that due to:
- as yet unknown, but likely double digit reductions in global demand for crude oil,
- Russia not going along with the OPEC plan, which resulted in,
- Saudi Arabia (for some reason) discounting up to $6 per barrel and markedly INCREASING production,
- The stated aim of all this is to put higher US shale producers underwater - which may already be working.
It looks like there will be major pressure on all high cost oil producers (Saudi Arabia has an all in cost basis around $10 per barrel) for some time. I am not picking on Chevron especially - but considering their situation in light of their (and recently) likely break-even price above $40.
Where to from here? Probably a gap down when the markets open targeting below $72 in the short term, potentially much lower ($30 / share) if the price hangs around present (sub $30 per barrel) levels for any length of time. If Chevron gets that low, they make a lot of sense to pick up.
Any catalysts for a major price increase? Not while Iran is busy fighting their COVID-19 outbreak - they are likely too busy at the moment to continue their work destabilising oil refining and shipping in the middle east with drones and cruise missiles.

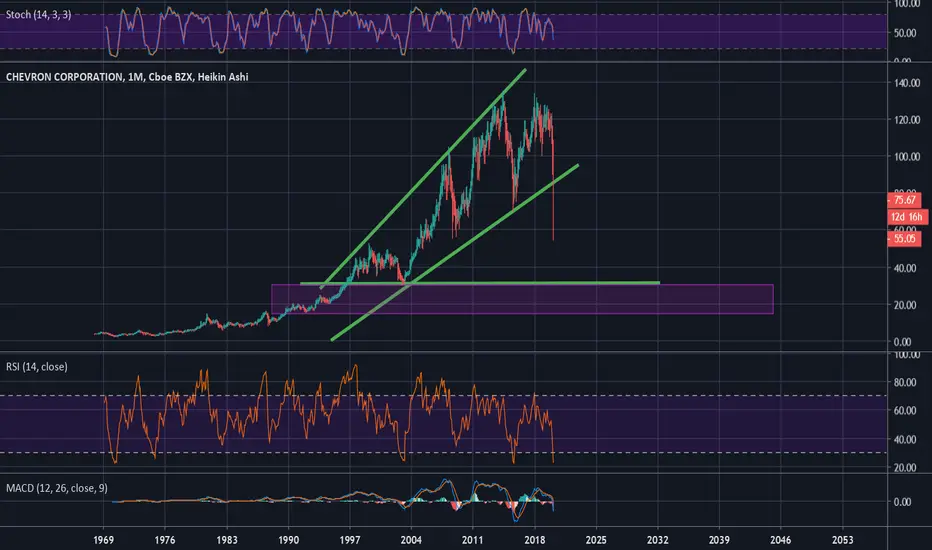


Oil stocks still a short as coronavirus crushes global demand.You can see from the chart that the price of Chevron (as one example) has declined in line with crude (WTI) price. However, you can also see the stocks tend to overshoot both on the upside and downside. This suggests there's more downside before the stocks bottom and can be bought.


CHEVRON (CVX): Close To Key Structure
chevron is coming closer and closer to a key structure support level.
I would consider a buying opportunity from 103.0 level with a potential bullish reaction to 114 / 121 levels.
with a stop below the X the position will be protected against the volatility and occasional fluctuations!
good luck!


Go long on CVX.Wall Street analysts see Chevron reporting earnings of $1.45 per share on revenue of $39.25 billion.
In the same quarter last year, Chevron reported EPS of $1.95 on revenue of $42.35 billion. If the company were to post earnings inline with the consensus estimate when it reports Friday, EPS would be down 25.64%. Sales would have fallen 7.32% from the same quarter last year. Chevron's reported EPS has stacked up against analyst estimates in the past like this:


Chevron Corp swing trade ideaChevron Corp -
Breakout to $133 or breakdown to $103?
The price likely has a bullish trait as support awaits at approx $115.
I favour the bullish movement upwards right now as the upwards trending (green dotted) support line awaits price. However, as always, wait for price action to form to provoke your next trade move here.
Enjoy your weekend and have a great trading week ahead.
All comments welcome.