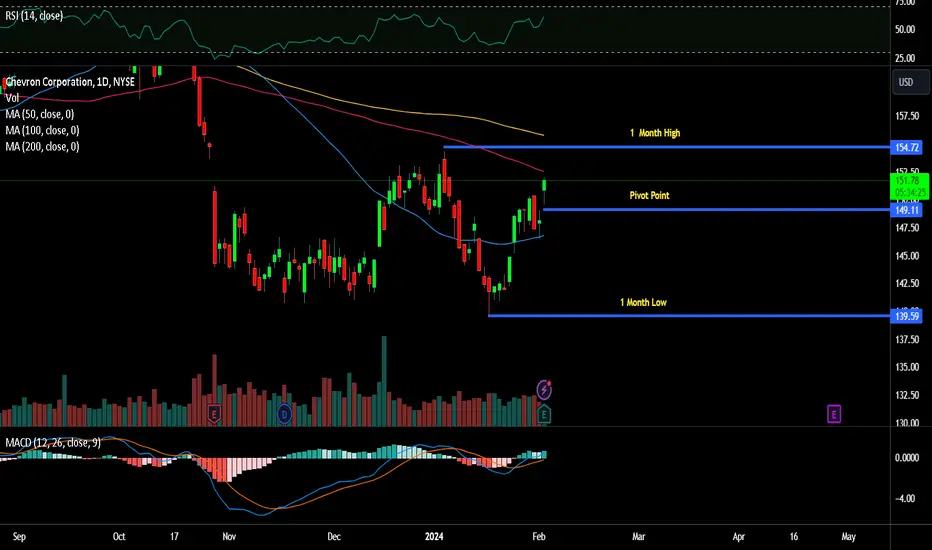
Bullish BAT on CVX Before Earnings!CVX is giving me some bullish signs, Bullish BAT, bullish engulfing candles, and standing right at strong pivot zone. Also RVOL is declining which shows less selling pressure. Could be a low risk Long Entry having SL set (Stop Loss) 🚀✌️🤑
CVX trade ideas


CVX making bullish Cypher Harmonic PatternCVX is in the process of making a bullish Cypher Harmonic Pattern. We are in a zone that could possibly become the bottom, but first we have to establish the bottom. And then we can aim for 3 green fib zones for taking profits. Please note that we are in a downward channel move, so for sure, breaking out from this channel can be very bullish.

See you later ChevronNYSE:CVX
note the following directional arrows are concepts and how I want to enter
With firms rotating out of AMEX:XLE we can expect some of the sectors top holdings and laggers get downside potential. Looking more into this I found NYSE:CVX to be the best candidate. NYSE:CVX and other gas stocks seem to be the ones catching the momentum down. Chevron also is following the same structure as AMEX:XLE which if AMEX:XLE gets the drop Monday we can expect NYSE:CVX to follow.
Expected Range - Upside $158.78 Downside $151.82
Key Levels - $153.37 - $153.59, $155.05 - $155.30, $155.61 - $156.94
Rating - Rotation out of AMEX:XLE +5, Rising volume near pivot +1, formed a base (slowed down)/topping wicks after break of base +1, same weakness as AMEX:XLE +1
8/10 Bullish, 2/10 Bearish

A US stock: CVX, Long setup, Swing trade H4 or above timeframe👋Hello Traders,
Our 🖥️ AI system detected that there is an H4 or higher timeframe ICT Short setup in US stock : CVX for Swing trade.
Please refer to the details Stop loss, FVG(Buy Zone),open for take profit.
For more ideas, you are welcome to visit our profile in tradingview.
Have a good day!
Please give this post a like if you like this kind of simple idea, your feedback will bring our signal to next better level, thanks for support!

CVX Chevron Corporation Options Ahead of EarningsIf you haven`t bought the dip on CVX:
nor sold the double top:
Now analyzing the options chain and the chart patterns of CVX Chevron Corporation prior to the earnings report this week,
I would consider purchasing the 165usd strike price Puts with
an expiration date of 2024-9-20,
for a premium of approximately $9.20.
If these options prove to be profitable prior to the earnings release, I would sell at least half of them.


CVX Potential Buy setupReasons for bullish bias:
- Safe entry at breakout for confirmation
- Price bounced from strong support
- SL below support
Entry Level(Buy Stop): 155.04
Stop Loss Level: 139.16
Take Profit Level 1: 170.92

Chevron Launches $500 Mln Investment Fund in Low Carbon TechChevron ( NYSE:CVX ), a prominent player in the energy sector, is embarking on a transformative journey with the launch of its $500 million Future Energy Fund III. This strategic move by the company's venture capital arm reflects a broader industry trend as oil majors pivot towards sustainable, low-carbon technologies in response to mounting pressure to address climate change.
A Green Investment Vision:
With the unveiling of the Future Energy Fund III, Chevron Technology Ventures ( NYSE:CVX ) is signaling a firm commitment to investing in renewable energy technologies. The fund's focus on innovations in industrial decarbonization, emerging mobility, energy decentralization, and the circular carbon economy underscores Chevron's ambition to drive positive environmental impact while embracing opportunities in the rapidly evolving energy landscape.
Diversifying Business Horizons:
As traditional oil and gas companies face increasing scrutiny over their carbon footprint, diversification has emerged as a strategic imperative. Chevron's move to allocate substantial capital towards low-carbon initiatives aligns with its broader goal of transitioning towards a more sustainable and resilient business model. By investing in novel low carbon fuels, advanced materials, and carbon transformation technologies, Chevron is positioning itself at the forefront of the energy transition.
Building on Past Success:
Chevron Technology Ventures' ( NYSE:CVX ) track record in fostering innovation is exemplified by its previous Future Energy Funds, launched in 2018 and 2021. With a total commitment of $400 million and investments in over 30 companies, these initiatives have laid the groundwork for future growth and expansion. The launch of Future Energy Fund III represents a natural progression in Chevron's ongoing efforts to drive positive change and create value in a rapidly evolving energy landscape.
Industry-wide Transformation:
Chevron's bold investment in low carbon technologies mirrors a broader shift within the energy sector. As the world's largest oil and gas companies set ambitious targets to reduce greenhouse gas emissions, initiatives like the Future Energy Fund III serve as catalysts for innovation and progress. By embracing sustainability and leveraging technological advancements, Chevron is not only future-proofing its business but also contributing to global efforts to combat climate change.
Conclusion:
Chevron's $500 million commitment to the Future Energy Fund III marks a significant milestone in the company's journey towards a more sustainable future. By investing in cutting-edge technologies and embracing the transition to a low carbon economy, Chevron is not only redefining its own business but also setting a precedent for the broader energy industry. As the world grapples with the urgent challenges of climate change, initiatives like the Future Energy Fund III underscore the critical role that innovation and investment play in shaping a more sustainable tomorrow.

Chevron Corporation (CVX) – A Comprehensive OutlookToday's focus is on Chevron Corporation (NYSE: CVX), a key player in the Energy Minerals sector. Our technical analysis will delve into the recent price dynamics and indicators to forecast potential price movements. We will also incorporate Chevron's strategic investment news, which can play a vital role in influencing investor sentiment and future price action.
Current Price Action:
Chevron's stock shows a closing price of $156.93 on the latest candlestick, with a noticeable pullback from the upper bounds of the Ichimoku cloud. This pullback is indicative of a potential reversal in the upward momentum witnessed in the prior sessions.
Ichimoku Cloud Analysis:
The Ichimoku Cloud, a comprehensive indicator that provides information on support/resistance, trend direction, momentum, and buy/sell signals, is currently signaling caution. Although the price is above the cloud – a traditionally bullish sign – the recent dip towards the cloud suggests that bullish momentum may be waning.
Fibonacci Retracement Levels:
By applying Fibonacci retracement levels to the recent uptrend, we identify critical support levels at 23.60% ($147.20) and 38.20% ($151.48). The stock has recently bounced off the 38.20% level, indicating resilient support; however, a break below this could trigger a move toward the 23.60% retracement level.
Volume and Volatility:
The volume has been relatively stable, yet we’ve observed an increase during sell-offs, a sign that bearish sentiment could be taking hold. However, the absence of extreme volume spikes suggests that the current retracement is not yet indicative of a major trend reversal.
Technical Indicators:
Relative Strength Index (RSI): The RSI hovers around 48, which is neutral territory. This indicates that there is neither overwhelming buying nor selling pressure currently in play.
Moving Average Convergence Divergence (MACD): The MACD line is beneath the signal line and the histogram shows bearish momentum building, albeit at a slow pace. Watch for a potential bullish crossover as an early indication of momentum shift.
Stochastic Oscillator: The Stochastic readings are currently near oversold levels, which could suggest an upcoming rebound if a bullish crossover occurs.
On-Balance Volume (OBV): The OBV shows no significant divergence from the price, which suggests that the recent price changes are supported by corresponding volume.
Market Sentiment and News:
Chevron's strategic move to pour $500M into renewable energy sources has been well-received, indicating a forward-thinking approach in a traditionally fossil fuel-dependent sector. This news could act as a catalyst for bullish sentiment, offsetting any technical bearishness.
Price Target Speculation:
Assuming the current support levels hold firm, a bullish scenario could see Chevron's stock price target the recent high of $165.21. Conversely, a breakdown below the 38.20% Fibonacci level may set the stage for a drop towards the $147.20 support level.
Conclusion:
In summary, Chevron's stock presents a mixed technical picture. The proximity to the Ichimoku cloud from above and the neutral-to-bearish readings on several indicators suggest a cautious approach. The resilience of the 38.20% Fibonacci support level is critical in the short term. Long-term sentiment could be swayed by the company's investment in renewables, potentially providing a fundamental tailwind to a technical rebound.
Traders and investors should monitor these levels closely and look out for volume surges and indicator crossovers for early trading signals. It is essential to keep an eye on broader market sentiment and news flow, which could significantly impact the stock's trajectory.

Chevron (CVX): Elliot Wave Analysis and Future OutlookChevron (CVX): NYSE:CVX
Examining Chevron's charts, starting with the weekly chart, we believe the first cycle concluded at the level of $120 in July 2014. That's quite some time ago. Since then, we've also developed Wave II at $51.60, coinciding with the COVID-19 low, marking the end of Wave II. From there, we've constructed the initial impulse waves upwards: Waves 1, 2, and 3. In our view, Wave 4 has not yet concluded, and there are reasons to believe this count cannot be adjusted otherwise. It's possible to count it differently, but we don't find it logically compelling. Looking post-COVID-19 low from $51.60, we've observed Waves 1 and 2, followed by a five-wave structure leading to Wave 3. What's interesting here is the absence of a five-wave impulse upwards, indicating Wave 4 is not yet complete. We also don't believe that Wave 4 lies at the level of Wave ((a)), a possible scenario, but not one we subscribe to. Given the sharp nature of Wave 2, as opposed to a sideways movement, we anticipate Wave 4 to be more extended and prolonged in time, likely moving sideways.
On a shorter time frame, since the all-time high of $189.68, we expect to see a five-wave structure moving downwards. Having completed Wave (iii), Wave (iv) should now stabilize between the 38.2% and 50% levels, potentially leading to an uptick in the coming days without significantly breaching the level of Wave (i). This would invalidate our analysis, marked in red as our invalidation line. If we exceed this, we'll need to reconsider our count. Until then, we anticipate a decline to complete Waves (v), ((c)), and 4.

Investment Opportunity Chevron CorporationPotential Investment Opportunity on Chevron Corporation.
+25% Upside
-11% Downside

$CVX heading to new highsNYSE:CVX Just made a double bottom at the support zone on 1W TF, which also happens to be the 200 EMA. It then went up to break the neckline, went back for the neckline retest, and now on its way up
I think we might see new highs here

Chevron: Bottom established 🌱The Chevron stock price has established the low of the blue wave (b). Going forward, the blue wave (c) should now push the stock above the resistance at $158.99, so that the overarching wave (a) in magenta can be completed there. The next step should then see a significant sell-off. However, there is a 37% chance that the price will set a new low with the blue wave alt.(b) below the support at $147.67 (but still above the next support at $139.62).

CVX - BullishProbabilities are lining up with CVX pushing for higher levels. 158 is target 1 for me. Good luck.
Not financial advice

CVX is Neutral With Two Key Price Levels to MonitorNYSE:CVX has lost support at the light blue resistance line, and this light blue trendline has flipped into resistance. CVX is trading above a yellow support level at $131.47. There is neutral price action here, and I think CVX doesn't have a clear direction for now. I would look for buy opportunities at or below the yellow trendline if CVX starts trending down, I think there will be a rebound there. If CVX starts trending up I would monitor for a rejection at the light blue trendline. I think CVX should find a direction within a few weeks, and I'd be happy to revisit the chart.

CVX drops and then starts to recover LONGCVX today dropped suddenly for unclear reasons. The possibility of a Israeli - Hamas War
cease-fire may have led to expectations that oil prices would fall as the shipping
quagmire in the Red Sea might stabilize. Later in the day OPEC+ announced a raised target of
$ 1.00 per barrel higher which on balance seems to be an offset maneuver. CVS in the drop
lost 2% printed a bear flag in about 90 minutes. i will use this opportunity to buy some all
options for September after the height of the summer driving seasons to add to my positions
in the futures ETF USO and OXY.

Chevron is getting ready to jump up?As seen on the chart: If the price breaks yesterday's daily high, I'll enter long into this stock.

Chevron Bulls take charge! Get in at discounted prices!NYSE:CVX
With oil prices on the rise, the price of CVX is going to be on the rise as well.
Great long opportunities here.
Analysis is based on simplified Smart Money Trading Concepts.
While the analysis was conducted on the Weekly time frame. Daily time frame has been taken in to account as well. Projections in time for Options are based off of the recent swing low to recent swing high. Also know as the current trading range or the Strong Low and Strong High.
***Any break and close below the Strong Low of $132.54 invalidates this trade idea. Triggering any long positions to be liquidated.***
Current and recent Price Action is/was deep into the discount zone prior to changing character at $154.35 with a daily break and close above that level.
Seen here on the daily chart :
TRADE SETUPS :
Reward to Risk ratios could vary between 3:1 up to greater than 10:1 depending on the instrument you are trading and the level that you enter in at. The trade setups fairly long term holds. 5-7 months
If you are trading stock CFDs or the underlying ticker :
4 positions between the 62% pullback($154.25) and the 89% pullback($144.54) would be ideal.
Exits:
1st = $189.68
2nd = $205.11
3rd = $225.11
4th = $246.82
------------------------------------------------------------------------------------------------------
If you are trading stock options:
NO less than a 7 to 9 month expiration!
Suggestion:
Sep 20th Expiration - Buy OTM CALLS between $185-$190
or
Dec 20th Expiration - Buy OTM CALLS between $185-190
ideally 3 or 4 positions
Exits:
(Stock price)
1st = $205.11
2nd= $225.11
3rd = $246.82
If you need an options calculator, I suggest using: www.optionsprofitcalculator.com
///////////////////////////////////////////////////
Premium - Discount Zones Explained:
In Bullish market structure/bias ---> Buy below the 50% of a fibo retracement
**Ideally between 62% to 89%**
In Bearish market structure/bias--> Sell above the 50% of a fibo retracement
**Ideally between 62% to 89%**
***Please note: the fibo retracement would be flipped in bearish market structure and the 62%-89% zones would be in the upper 50% of the fibo retracement***
///////////////////////////////////////////////////
-THERE IS NO CHARGE FOR AWESOMENESS-


CVXChevron Corporation is an American multinational energy corporation predominantly specializing in oil and gas. The second-largest direct descendant of Standard Oil, and originally known as the Standard Oil Company of California, it is headquartered in San Ramon, California, and active in more than 180 countries.
Potential to clear consolidation range.

Chevron's Resilience in a Volatile Market
In a year marked by turbulent oil prices and global economic challenges, Chevron (NYSE: NYSE:CVX ) showcased remarkable resilience, delivering a record windfall to its shareholders in 2023 despite a substantial dip in quarterly earnings. The second-largest U.S. oil company reported a net income of $2.3 billion, a 65% decline from the previous year, attributing the decrease to lower oil prices and several charges. However, the company's strategic moves, including an 8% increase in the quarterly dividend and robust capital expenditures, underscore Chevron's commitment to long-term growth and shareholder value.
Diving into the Numbers:
Chevron's (NYSE: NYSE:CVX ) fourth-quarter performance exceeded analyst estimates, with adjusted earnings per share coming in at $3.45 compared to the expected $3.21. While revenue fell short of projections at $47.18 billion, the company's ability to navigate challenging market conditions was evident. The decline in profits was partly attributed to impairment charges, with the U.S. oil and gas assets recording a loss of $1.35 billion. Excluding these charges, Chevron (NYSE: NYSE:CVX ) reported an adjusted profit that surpassed Wall Street's expectations, demonstrating the company's operational strength.
Record Windfall for Shareholders:
Despite the challenging economic environment, Chevron (NYSE: NYSE:CVX ) returned a staggering $23.6 billion to investors in 2023. This impressive sum was distributed through a combination of dividends, totaling $11.3 billion, and share buybacks, amounting to $14.9 billion. The decision to raise the quarterly dividend by 8%, starting in March, showcases Chevron's confidence in its financial position and long-term prospects. Shareholders reacted positively to this announcement, with the company's stock rising over 1% in early trading.
Strategic Investments and Expansion:
Chevron's (NYSE: NYSE:CVX ) resilience is not solely attributed to financial management but also to strategic investments and expansion initiatives. The company entered a landmark $53 billion deal to acquire Hess Corp, a move aimed at expanding its footprint in Guyana, a significant emerging crude producer. This acquisition aligns with Chevron's (NYSE: NYSE:CVX ) commitment to securing future growth opportunities amidst a dynamic energy landscape.
Production Highlights and Future Outlook:
Despite the challenging market conditions, Chevron (NYSE: NYSE:CVX ) achieved a record production of 3.1 million oil-equivalent barrels per day in 2023. The company experienced a remarkable 14% growth in the U.S., driven by increased capital expenditures. While international production saw a slight decline due to normal field declines, Chevron (NYSE: NYSE:CVX ) remains optimistic, projecting a 4% to 7% production increase in 2024. The company's commitment to investing in recently acquired assets and ventures like the hydrogen fuel project developer ACES Delta reflects its forward-looking approach.
Conclusion:
Chevron's (NYSE: NYSE:CVX ) 2023 performance paints a compelling picture of a company navigating adversity with strategic acumen. Despite lower oil prices, volatile markets, and impairment charges, Chevron delivered substantial returns to shareholders, increased its dividend, and made strategic investments for future growth. As the energy landscape continues to evolve, Chevron's resilience and forward-looking initiatives position it as a key player in shaping the future of the industry.
CVX Chevron Corporation Options Ahead of EarningsIf you haven`t bought the dip on CVX:
nor sold the Double Top:
Then analyzing the options chain and the chart patterns of CVX Chevron Corporation prior to the earnings report this week,
I would consider purchasing the 140usd strike price Calls with
an expiration date of 2025-1-17,
for a premium of approximately $9.30.
If these options prove to be profitable prior to the earnings release, I would sell at least half of them.
