RectangleThe support line of this horizontal trading channel is strong due to multiple touches.
Targets are calculated using the height of the channel.
It is a neutral pattern until broken. This did break up but fell back into the channel.
No recommendation.
CVX trade ideas

Chevron continues to hold back the bears.Chevron Corporation - 30d expiry - We look to Buy at 150.33 (stop at 146.33)
150 continues to hold back the bears. We look to buy dips.
149.91 has been pivotal.
149.74 has been pivotal.
This is currently an actively traded stock.
The primary trend remains bullish.
Our profit targets will be 160.33 and 162.33
Resistance: 164.04 / 166.00 / 169.00
Support: 158.50 / 156.00 / 153.00
Please be advised that the information presented on TradingView is provided to Vantage (‘Vantage Global Limited’, ‘we’) by a third-party provider (‘Everest Fortune Group’). Please be reminded that you are solely responsible for the trading decisions on your account. There is a very high degree of risk involved in trading. Any information and/or content is intended entirely for research, educational and informational purposes only and does not constitute investment or consultation advice or investment strategy. The information is not tailored to the investment needs of any specific person and therefore does not involve a consideration of any of the investment objectives, financial situation or needs of any viewer that may receive it. Kindly also note that past performance is not a reliable indicator of future results. Actual results may differ materially from those anticipated in forward-looking or past performance statements. We assume no liability as to the accuracy or completeness of any of the information and/or content provided herein and the Company cannot be held responsible for any omission, mistake nor for any loss or damage including without limitation to any loss of profit which may arise from reliance on any information supplied by Everest Fortune Group.

Leveraging on WB's investment in Chevron CorporationMany investors, institutional and retail follow the trades of Warren Buffett, the legendary investor like a hawk. Recently, he invested 41 billion in this oil company called Chevron Corporation.
Could he be looking at renewable energy growth that these Oil companies are now penetrating into ? Or looking at Oil prices now, he is expecting these Energy companies to follow suit ?
Please DYODD and be comfortable with the risks that follows.


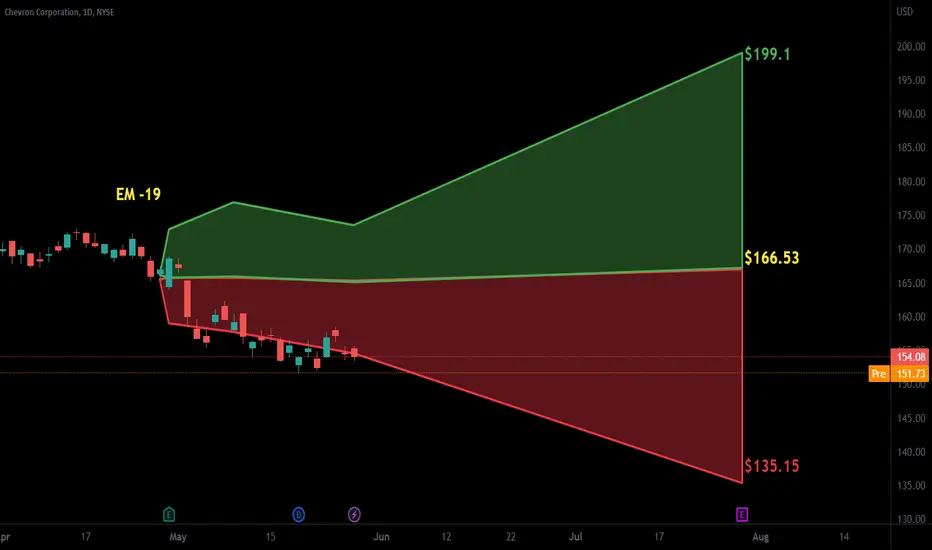
Chevron Could Be Squeezing from its LowsBig tech stocks have gotten a lot of attention lately, but another theme has been cyclicals rallying off intermediate-term lows. Some of June’s bigger gainers, like Carnival and Delta Air Lines, advanced from these patterns. Today’s idea considers whether Chevron could follow a similar path.
We’ll start by identifying the two potentially key ingredients preceding the upside moves. First is a basing pattern near an intermediate-term low. Second is improving price momentum prior to the breakout (measured with the 9-day Rate of Change). Some of the charts in question also breached falling trendlines.
Now consider how CVX hit a five-month low of $150 in March. It then bounced and held the same level twice in June. Does that represent an intermediate-term bottom?
Second, the Rate of Change (ROC) oscillator has inched higher since early May. That may suggest sellers are losing control, even without the bulls yet clearly in charge.
Traders could now eye the mid-June high around $160.77 as a potential breakout zone. The closeness of the recent low around $150 may also create a threshold for risk management.
Finally, the macro backdrop may favor CVX. Cyclical groups like industrials, transports and materials outperformed last month as recession fears diminished. Investors looking for that pattern to widen may target energy given the tight oil inventories and the sector’s link to economic activity. Energy could also be active with an OPEC meeting this week.
TradeStation has, for decades, advanced the trading industry, providing access to stocks, options, futures and cryptocurrencies. See our Overview for more.
Important Information
TradeStation Securities, Inc., TradeStation Crypto, Inc., and TradeStation Technologies, Inc. are each wholly owned subsidiaries of TradeStation Group, Inc., all operating, and providing products and services, under the TradeStation brand and trademark. TradeStation Crypto, Inc. offers to self-directed investors and traders cryptocurrency brokerage services. It is neither licensed with the SEC or the CFTC nor is it a Member of NFA. When applying for, or purchasing, accounts, subscriptions, products, and services, it is important that you know which company you will be dealing with. Please click here for further important information explaining what this means.
This content is for informational and educational purposes only. This is not a recommendation regarding any investment or investment strategy. Any opinions expressed herein are those of the author and do not represent the views or opinions of TradeStation or any of its affiliates.
Investing involves risks. Past performance, whether actual or indicated by historical tests of strategies, is no guarantee of future performance or success. There is a possibility that you may sustain a loss equal to or greater than your entire investment regardless of which asset class you trade (equities, options, futures, or digital assets); therefore, you should not invest or risk money that you cannot afford to lose. Before trading any asset class, first read the relevant risk disclosure statements on the Important Documents page, found here: www.tradestation.com .

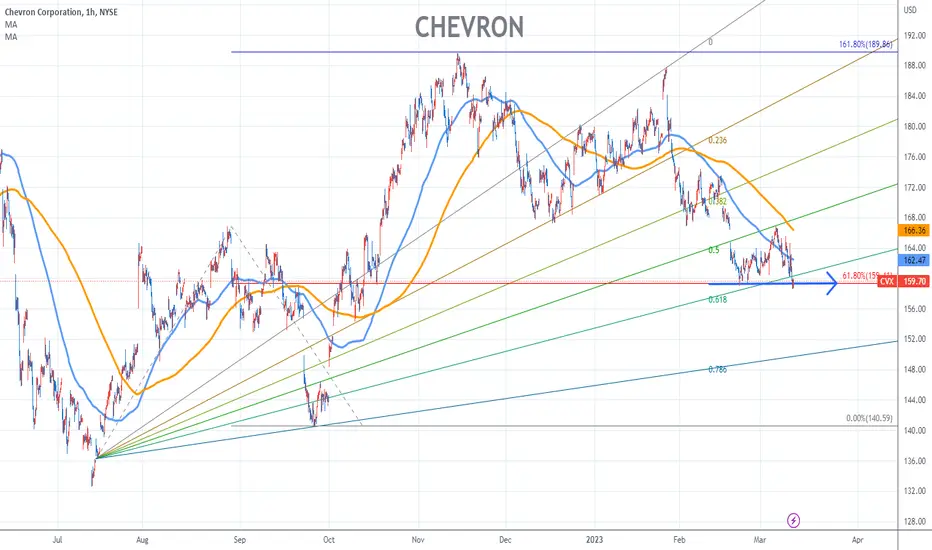
CVX: back to its 200-day?A price action above 155 supports a bullish trend direction.
Further bullish confirmation for a break above 160.
The target price is set at 165 (its 200-day simple moving average).
The stop-loss price is set at 153.
The concept of price stability is highly attractive and desirable in the realm of this stock.


CVX to find buyers at current support?Chevron Corporation - 30d expiry - We look to Buy at 150.33 (stop at 146.33)
150 continues to hold back the bears.
We look to buy dips.
149.91 has been pivotal.
149.74 has been pivotal.
This is currently an actively traded stock.
Our profit targets will be 160.33 and 162.33
Resistance: 155.00 / 157.00 / 160.77
Support: 152.00 / 149.74 / 148.00
Please be advised that the information presented on TradingView is provided to Vantage (‘Vantage Global Limited’, ‘we’) by a third-party provider (‘Everest Fortune Group’). Please be reminded that you are solely responsible for the trading decisions on your account. There is a very high degree of risk involved in trading. Any information and/or content is intended entirely for research, educational and informational purposes only and does not constitute investment or consultation advice or investment strategy. The information is not tailored to the investment needs of any specific person and therefore does not involve a consideration of any of the investment objectives, financial situation or needs of any viewer that may receive it. Kindly also note that past performance is not a reliable indicator of future results. Actual results may differ materially from those anticipated in forward-looking or past performance statements. We assume no liability as to the accuracy or completeness of any of the information and/or content provided herein and the Company cannot be held responsible for any omission, mistake nor for any loss or damage including without limitation to any loss of profit which may arise from reliance on any information supplied by Everest Fortune Group.

CVX could see a potential rise, possible tradeNYSE:CVX has been recently undersold the past few days, unfortunately I do not see a bullish 38.2% candle (hammer candle) unlike how I saw it on the recent small bull run, the price of the stock has hit a low-ish 52 week low at $150~ compared to the $130~. Liquidity is sitting on it's current price and at ~$170. I am aiming for $160 and will sell, I also have my stop loss at $148~


CVX - Continuation Pattern Above Trend LineAn idea for CVX showing similar double bottom formations in a strange sort of inverted H&S way.
If you do consider this a H&S we just experienced the right shoulder, following this is a bullish period, hence my continuation assumption in green bars pattern.
Thicker Trendline is a longer term trend line
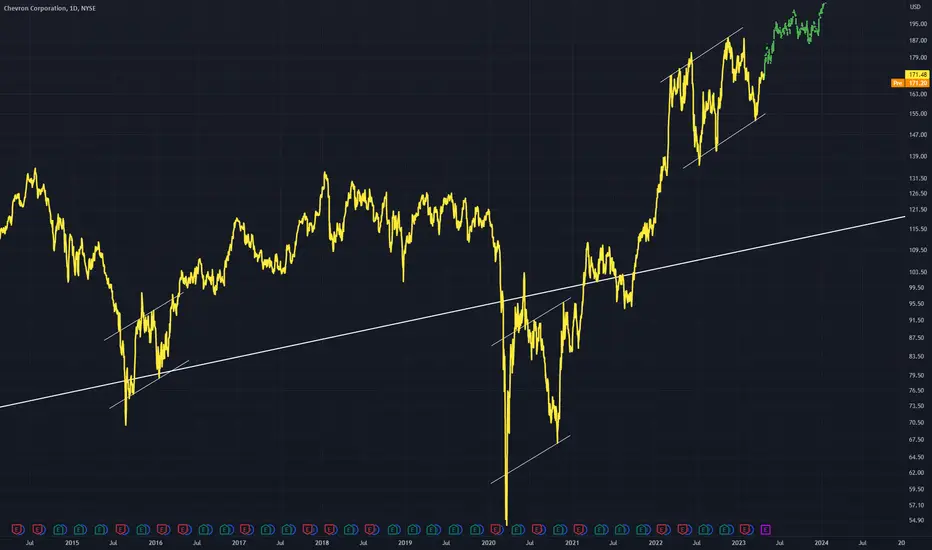
CVX = Long Set-Up I'm bullish on WTI and the energy sector in general at this level.
I like Chevron which is close to my buy point for a fifth wave to new highs.
Chart pretty much says it all. Wait for it. It needs to find at bottom at the confluence of trendlines on the chart.
I'll update as needed in the near future

