FCX trade ideas

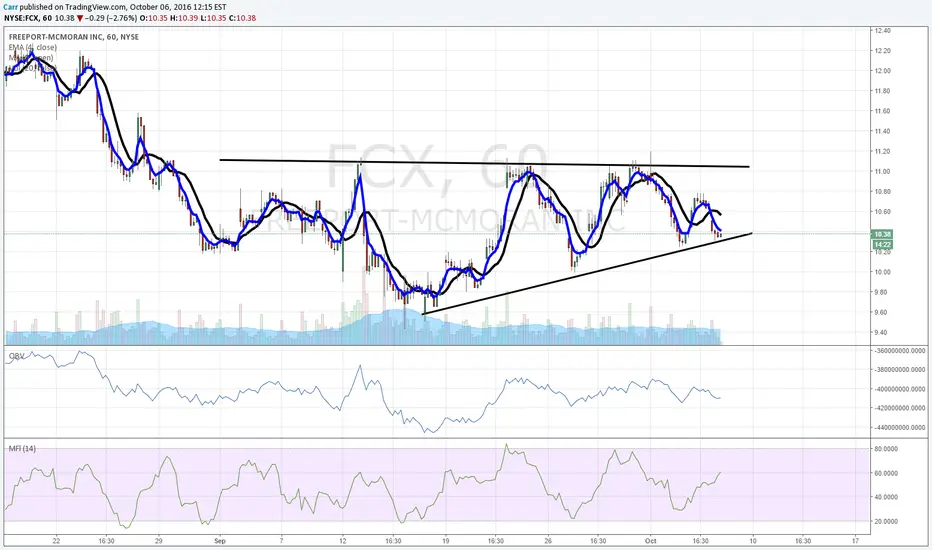
FCX On Verge Of Dropping 21%FCX is on the verge of dropping 21%. Investors need to take note of these this major factor that dictates price action. Notice on the stock chart below, how over the last two weeks Freeport-McMoRan has been unable to make new highs while the stock market has made multiple new all-time highs. In addition, the stock chart over those same two weeks has a clear bear flag pattern formation. This usually forms when small investors are buying but big institutional traders are gently selling into them, dumping shares. All in all, these are huge bearish signals on the Freeport-McMoRan and investors should be selling or shorting the stock heavily. The first target to the downside is $13.20, a net profit from the current price of 14% for shorts. The second target is $12.10, a net profit for shorts of 21%. This trade will likely play out in the next six weeks, if not sooner.
View all of my trades VERIFIED right here: verifiedinvesting.com

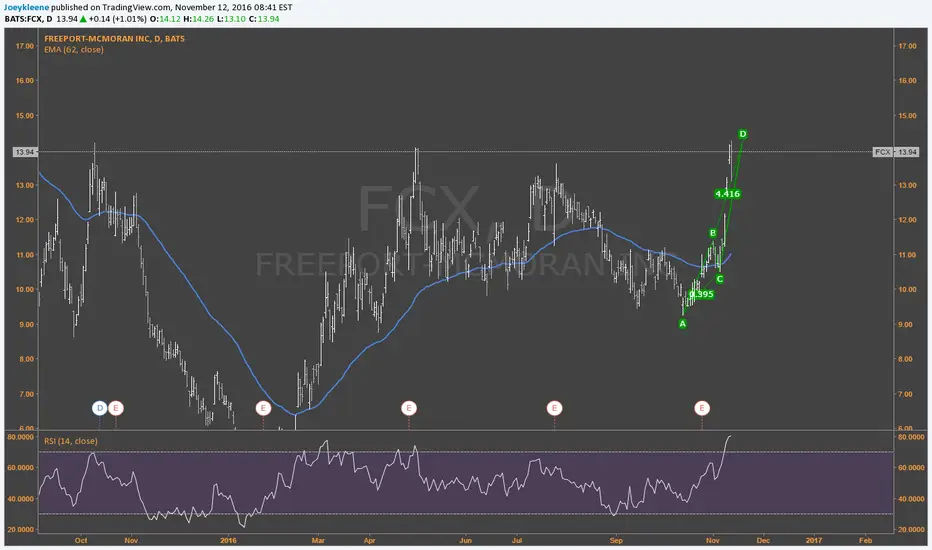
FCX - 2hrShould start to see some consolidation here soon for wave 4 of (1). Retraces could be shallow if this is indeed setting up wave (3) of Primary 3.

FCX potential breakoutFCX tried to breakout last 2 weeks ago, but it failed and pulled back slightly. As of yesterday, the stock closed above the recent highs. If it can stay above 14.2 area, the next major resistance is not until 16.5 or so.

FCX Bullish SwingThough we had a gap and go today, I want to see it retest the resistance level it just broke through. Looking to enter on the retest and have an initial target of 15.25 with an ultimate target of 16.45

FCX breaking out of daily resistanceFCX had a nice close today and is finally breaking out of the resistance on the daily chart, watching for a gap up and then continued momentum tomorrow


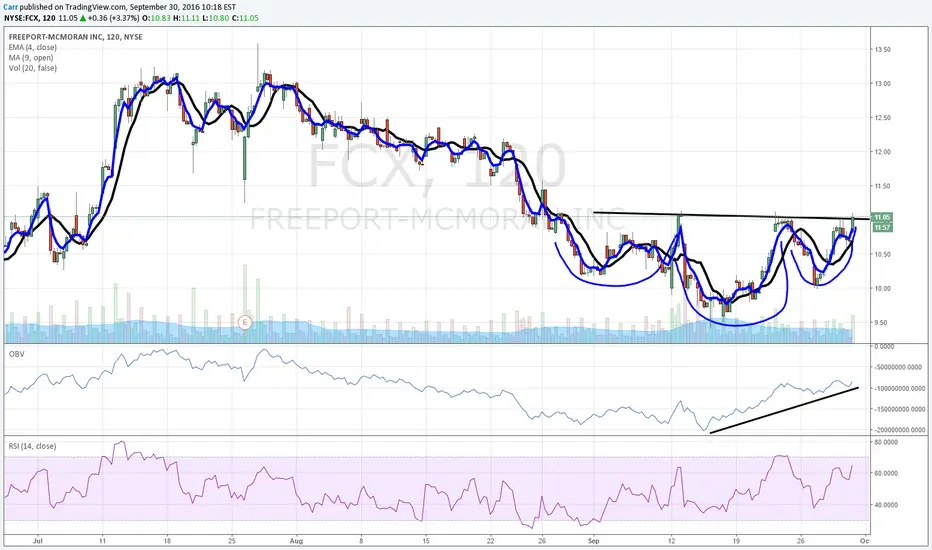

$FCX buy buy buy Yup, can't print much nicer than this. Buy half now, half at breakout over 11. This one is going to $12.50.


Long FCX on supportLong FCX on strong daily support at $10. Long term FCX has enormous upside with its goldmine and copper mine interests. The value of its gold reserves alone tops $25 Billion (it has a large share in the worlds largest gold mine in Indonesia). As long as the company can continue to restructure and pay down some of its debt its long term prospects are 3x current valuations. I look for a stop at $9.00 with reentry on large dips below that level. I don't have a price target below $20, but rather see this as a long term buy and hold (I recommend trading around the long position on volatility). If you follow my 10000 USD base account recommendations I advise a 200 share long position at 10.05.


$FCX potential cup and handle$FCX potential cup and handle move on daily. Could see a nice move north if valid. Long over 14.25

FCX long termI've changed my main count giving wave as finished in January. It seems all is prepared for wave 3 of 1. It may be a deeper wave 2 can be seen, but it's not my preferred way. The solution in next weeks ....


FCX SHOULDER HEAD SHOULDERLas tendencias que se muestran se ven con bandas de Bollinger, donde se puede notar en las bandas mas angostas se notan fuertes tendencias y los promedios moviles de 9 y 20 dias, se puede ver en los cruces de estas líneas que van hacia arriva los precios suben y puede ir a un largo (compra del activo) y a la inversa, cuando las lineas promedio moviles que se cruzan van hacia abajo los precios bajan y se puede ir a un corto (venta del activo). El patron que se muestra es de hombro cabeza hombro, cuando la tendencia llega al cuello tiende nir a la baja donde se puede ir a nun corto.
