$FSLY first target hit...last week $48 calls bought at $0.26, now $1.71, wish I bought more! Close those out, looking out for a spread position for the next target price around $60
FSLY trade ideas

FSLY Major Trendline ResistanceNYSE:FSLY is currently sitting on support with a major trendline resistance which is dictating the medium-term downtrend.
If the $35 level is broken to the downside then the stock can see a big decline in price.
On the other hand, if the trendline can be broken then a potential uptrend may be on its way.

FSLY last hurdle to cross45.50.. would push it across.
Got rejected today after a nice move up.
Has been riding under this divergence since last summer
All other daily indicators are bullish.
let's see what happens

Fsly breakoutFsly breaking out of a long downtrend that started with that possible tik tok ban fiasco.
First TP - 47$/ Daily 100ma
Second Tp - 51$
FInal TP - 76.30$

$FSLY example trade...Got the first move I was looking for, did not enter in time to get the first move. If we continue, would look to get over $45 before end of the week. Going to try a $48 call for next week at close probably around $0.26

$FSLY really liking this set up....Long term VWAP right here, looking for set ups that could go even with a market decline. Going to take a try here on a call option a few weeks out

$FSLY new one on watch...VWAP back to May 2020 acting as a solid base, starting to watch here for a long term play to the upside.

FSLY Parabolic breakdownFSY continues on its parabolic decline. This system which should take FSLY to its near term target of $37.00 is part of a larger parabolic decline that will unfold over the coming weeks. Opportunities to the long side will present themselves as the near term parabolic systems are completed.

FSLY - LONGInitiating a 1/5th position here for shares and long term 01/19/2024 $40C options
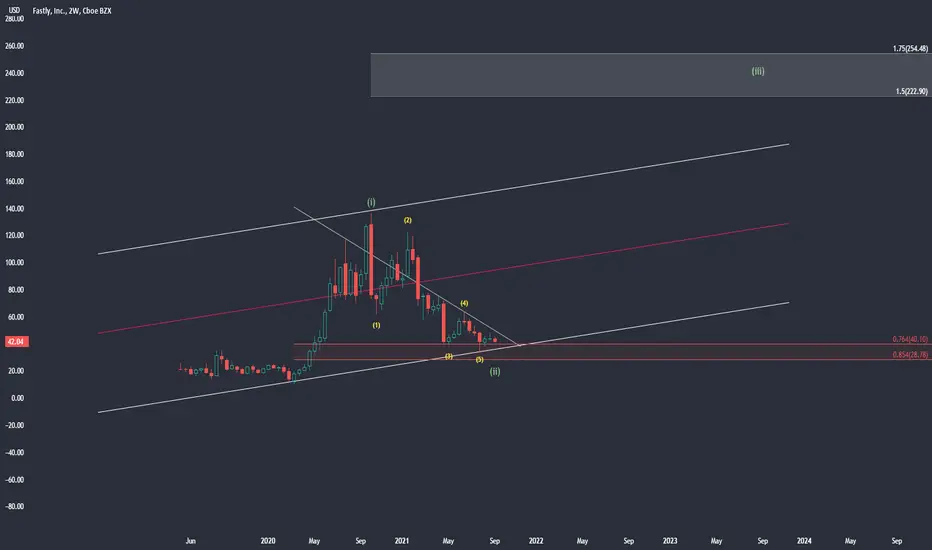
Weekly chart should be at or close to near term bottom for a major wave 3 towards upper white box.
FSLY breaking from baseFSLY making a move through the downward trend line after being in the dog house for a while. Like it above the green box. Would prefer a pull back to the the trend line for and entry. It may a run as it has 20% short float. Targets would be the fibs.

FSLY zoomed in. Wait for $40 to buy. And buy big. Wave 3 of 3 coming. This stock is in a larger wave 2 and you can call that the institutional due diligence phase. Same story as NVDA, TWLO

FSLY preferred countThe bottom is in according to this count. We are in the large wave 3. I'd be a heavy buyer at the .618 for the smaller degree wave 2 pullback

Fastly - investment ideaFor a long-term investment this stocks looks absolutely fine at current prices.
If we zoom in to look at the wave structure - right-side chart H4 - I would expect a lower low to complete an ending diagonal in the wave C.

Potential FSLY count - not preferredAs with many long term stocks they have the massive wave 1 before a significant and deep wave 2. Call this an institutional due diligence phase. That's where I believe FSLY is at. It's scary right now, but this could be an NVDA or TWLO type name.
This is not my preferred count. I prefer the wave 1 top in October which is the all-time high. If this count is wrong then the bottom very well could be in.
For trade ideas, portfolio building and stock picks go to Thesmartcents . com to join our group.

Falling Wedge- BullishBig falling wedge on FSLY that it has been holding for quite some time now, however, is seemingly starting to break out of this formation- Bullish and will be looking for a breakout, just some FIB levels & RSI-based supply and demand zones to keep an eye on-
- Closed Friday sitting right on its 20-day SMA (Not Pictured)
- Bollinger Bands Squeezing
- RSI has been in the oversold range for quite some time
- Buyer volume starting to pick up
- Weekly Timeframe (See Below)
PT1- $44.35
PT2- $45.58
PT3- $46.30+


FASTLY SHORTWith consecutive LL HL potential target for toward define with help of ABCD pattern chart for EDUCATIONAL purpose .

FSLYSmall caps look weak, and when in doubt short garbage
I think this one needs to head back to where earnings took it. Double bottom.
Other garbage stocks look weak, like BYND and FCEL

FASTLY Ready For Lift-Off [LONG]The chart here of FSLY might be one of my favorite looking charts of recent memory.. however, if you are a close follower of the company, you may be a little fearful at the moment as this stock has gotten hammered for 10 months now. Not to mention the miss they had on earnings recently PLUS a bug in the company's infrastructure that apparently caused the web traffic of a major customer to vanish for almost an hour.
This has resulted in shareholders dumping the stock and leaving it for savvy traders to now scoop it up for pennies on the dollar as the stock has fallen 75% in value back down to fair value areas according to what we have outlined here in what appears to be the completion of a classic 5 Count Elliot Wave correction.
And now this young stock has found itself back above the $41 price level.. a very important level as there is nothing to catch the price below this level as far as the eye can see according to the common Fibonacci retracement of this asset's all time high to its all time low.
This makes the levels shown on this chart very credible and one who owns this asset would be wise to not fall asleep on what is happening to the stock's current price.
Furthermore, we have possible classic bullish divergence on the weekly.. although it is much more discernable on the daily.
Either way, FSLY looks all systems go in the fact that it is sitting snug above our .236 fib level, a technically great area for price to run to higher prices if support is maintained here.
It is currently a 6% drop to reach our desired entry at $41. So one might find a better, yet slightly riskier entry just above our heads at the next fib level which would be $45.40. Much higher above that we have more buy zones but the spot we are at now will be where the most gains are made.
Lastly on Fastly, anything below $40 is bearish and a daily/weekly candle close below this level would be enough to refrain from looking for any further longs in the immediate future.
If you own this stock and you are fed up with it, you may want to stick it out just a little longer as FSLY could be looking at a DOUBLE in price in the not so distant future.

$FSLY Bullish ReversalTechnology / Software Co. Fastly ( $FSLY ) has setup nicely to continue with its bullish trend.
Looking at weekly chart its found some solid buying interest at previous highs ( 35.25 ) set all the way back in Sept. 19'
First target / resistance lines up with its 50% retrace of its last move lower around 49.00
If we can see a break and hold above its halfway back setup and weekly trend line, $FSLY looks for a nice swing towards second target at 72.55
Long term I'm looking to play retest / potential break above ATH
- Krecioch

FSLY Fastly Head and Shoulders Price TargetThe head and shoulders pattern is one of the most reliable trend reversal patterns.
The distance from the neckline to the head is the same for the retracement from the neckline to the bottom.
In this case, using Renko candles to understand better the H&S chart pattern, the price target is 31usd.

Falling Wedge- Watching CloselyFSLY has been selling off for quite a bit now, however, is forming quite a large falling wedge. Some slight bullish divergence on the RSI last week, Bollinger bands are squeezing (not pictured). With buyer volume, should pop and will be looking for a breakout- just some support and resistance levels to keep an eye on as well as some RSI-based supply and demand zones.
**Broader Market Conditions Permitting**
